Report on Stromboli (Italy) — February 2021
Bulletin of the Global Volcanism Network, vol. 46, no. 2 (February 2021)
Managing Editor: Edward Venzke.
Edited by Kadie L. Bennis.
Stromboli (Italy) Explosions, incandescent ejecta, lava flows, and pyroclastic flows during September-December 2020
Please cite this report as:
Global Volcanism Program, 2021. Report on Stromboli (Italy) (Bennis, K.L., and Venzke, E., eds.). Bulletin of the Global Volcanism Network, 46:2. Smithsonian Institution. https://doi.org/10.5479/si.GVP.BGVN202102-211040
Stromboli
Italy
38.789°N, 15.213°E; summit elev. 924 m
All times are local (unless otherwise noted)
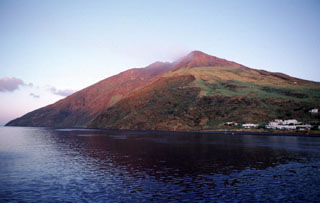
Stromboli, located in the northeastern Aeolian Islands, is composed of two active summit craters: the Northern (N) crater and the Central-South (CS) crater that are situated at the head of the Sciara del Fuoco, a large scarp that runs from the summit down the NW side of the volcano (figure 187). The current eruption period began in February 1934 and has been recently characterized by Strombolian explosions at both summit craters, ash plumes, and SO2 plumes (BGVN 45:09). This report covers activity consisting of dominantly Strombolian explosions, incandescent ejecta, and ash plumes from September to December 2020, with information primarily from daily and weekly reports by Italy's Istituto Nazionale di Geofisica e Vulcanologia (INGV) and various satellite data.
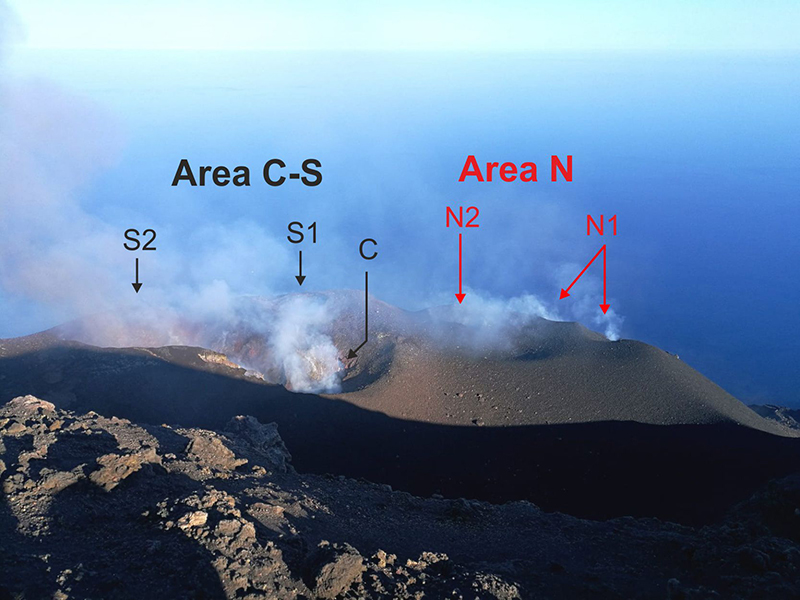 |
Figure 187. Photo of the summit craters at Stromboli showing the North and Central-South crater areas with the location of each active vent: N1 and N2 in the N crater and S1, S2, and C in the CS crater. Photo was taken from the Pizzo sopa la Fossa during an expedition on 22 August by INGV-OE personnel. Courtesy of INGV (Rep. No. 37/2020, Stromboli, Bollettino Settimanale, 31/08/2020 - 06/09/2020, data emissione 08/09/2020). |
Activity was consistent during this reporting period. Explosion rates typically ranged from 1-14 events per hour and varied in intensity that ejected material 80-250 m above the N crater and 150-250 m above the CS crater (table 10). An ash plume on 16 November rose 1 km above the crater, accompanied by a pyroclastic flow descending the Sciara del Fuoco to the NW as far as 200 m. As a result, some ash and lapilli fell in the town of Stromboli (2 km NE). Strombolian explosions were often accompanied by gas-and-steam emissions, occasional spattering that deposited material on the Sciara del Fuoco, small lava flows, and small pyroclastic flows. According to INGV, the daily SO2 emissions measured 250-300 tons/day.
Table 10. Summary of activity at Stromboli during September-December 2020. Low-intensity activity indicates ejecta rising less than 80 m, medium-intensity is ejecta rising less than 150 m, and high-intensity is ejecta rising over 200 m above the vent. Data courtesy of INGV.
| Month | Activity |
| Sep 2020 | Strombolian activity and degassing continued. Explosion rates varied from 2-22 per hour in the N crater and 1-10 in the CS crater. Ejected material rose 80-200 m above the N crater and 250 m above the CS crater. The average SO2 emissions measured 250-300 tons/day. |
| Oct 2020 | Strombolian activity and degassing continued, along with occasional spattering. Explosion rates varied from 2-13 per hour in the N crater and 1-4 per hour in the CS crater. Ejected material rose 80-250 m above the N crater and 150-250 m above the CS crater. The average SO2 emissions measured 250-300 tons/day. |
| Nov 2020 | Strombolian activity and degassing continued. Explosion rates varied from 2-10 per hour in the N crater and 1-4 in the CS crater. Ejected material rose 80-250 m above the N crater and 150 m above the CS crater. The average SO2 emissions measured 250-300 tons/day. |
| Dec 2020 | Strombolian activity and degassing continued, along with some spattering in the N crater. Explosion rates varied from 1-13 per hour in the N crater and 1-5 in the CS crater. Ejected material rose 80-150 m above the N crater and 150 m above the CS crater. The average SO2 emissions measured 250-300 tons/day. |
During September the frequency of the Strombolian explosions in the N crater typically ranged from 2-14 per hour; in the CS crater there were 1-10 explosions per hour. N1 consisted of three points of emissions that produced low- to high-intensity explosions, launching lapilli and bombs, sometimes mixed with fine ash, 80-200 m above the N crater and were distributed radially (figure 188); N2 typically showed low-intensity explosions (less than 80 m above the crater). Medium- to high-intensity explosions ejected mostly fine material mixed with some coarse tephra 250 m above the CS crater. On 28 September the number of explosive events reached a high of 22 per hour.
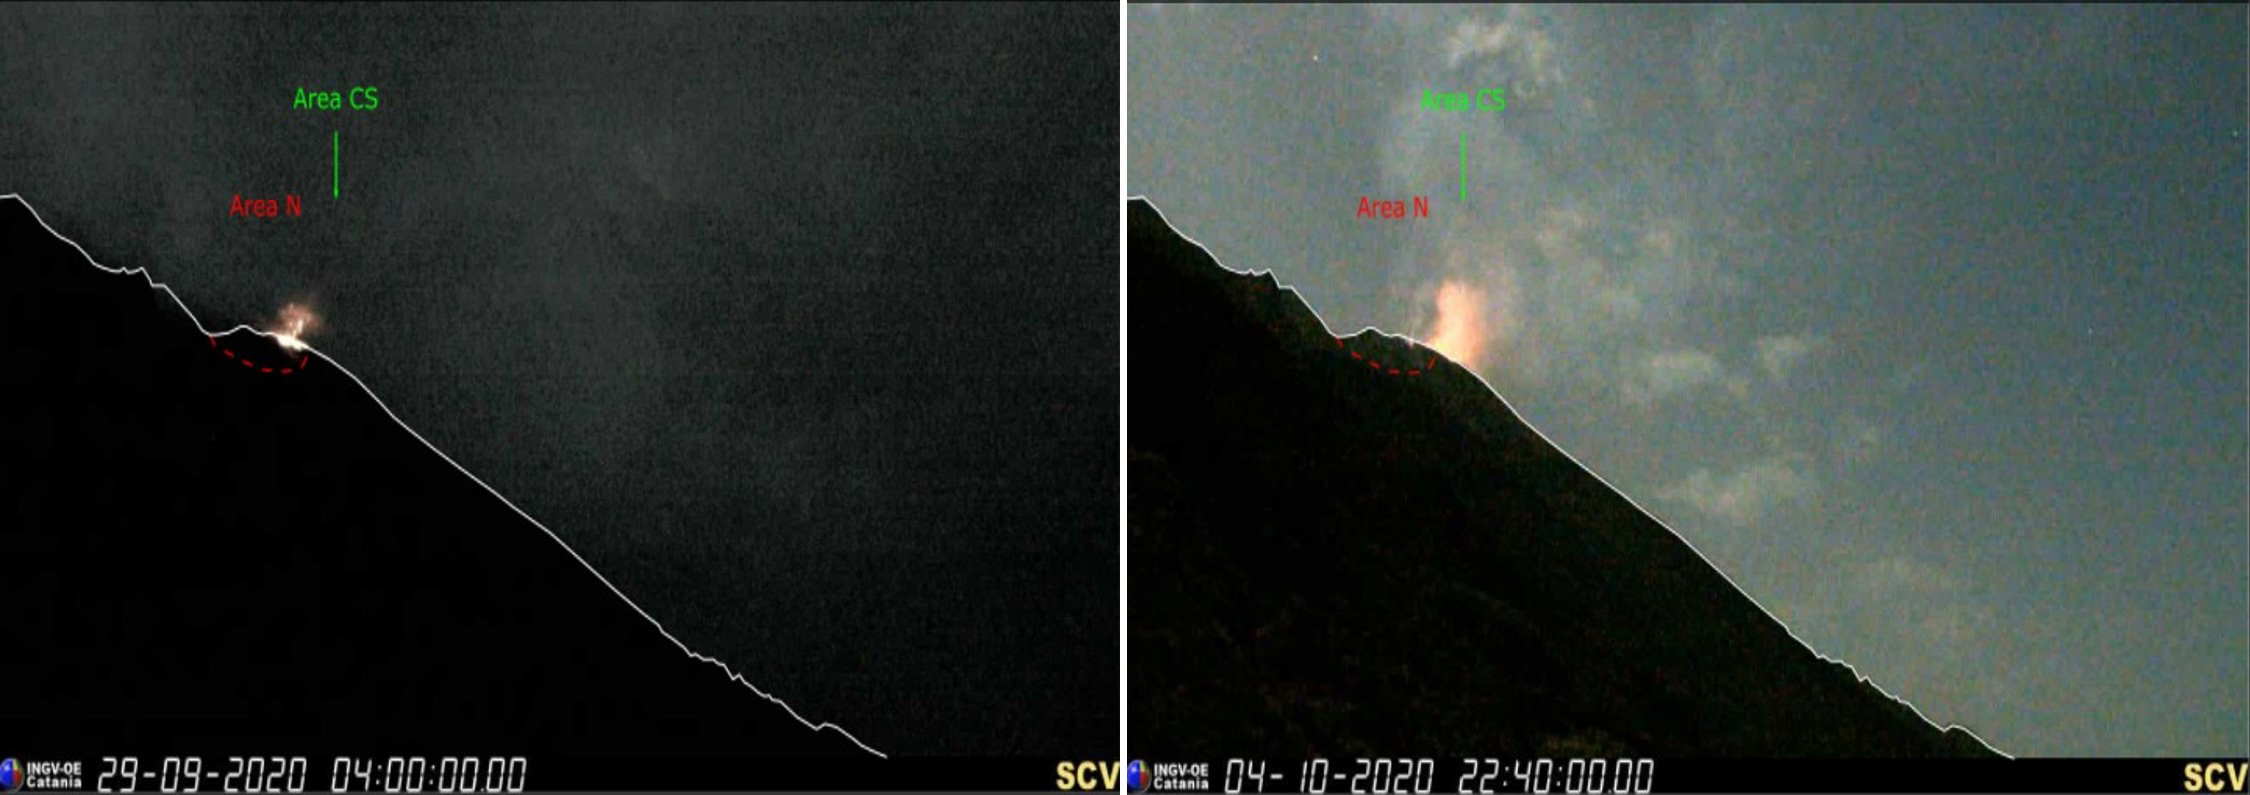 |
Figure 188. Webcam images of Strombolian activity at Stromboli in the N1 crater on 29 September (left) and in the CS crater on 4 October (right) 2020. Images captured by the SCV surveillance cameras. Courtesy of INGV (Rep. No. 41/2020, Stromboli, Bollettino Settimanale, 28/09/2020 - 04/10/2020, data emissione 06/10/2020). |
Explosions with occasional spatter continued in October at a rate of 2-13 per hour in the N crater and 1-4 per hour in the CS crater. In the N crater, N1 consisted of 2-4 eruptive vents that produced explosions of variable intensity while N2 contained two vents that primarily produced low-intensity explosions. Lapilli and bombs, sometimes mixed with fine ash, were ejected 80-250 m above the N crater. Fine ash sometimes mixed with coarse-to-medium tephra rose 150-250 m above the CS crater. Spatter was reported from two hornitos that formed in the N1 crater (figure 189). On 11 October sporadic ash emissions and coarse ejecta were observed above the S2 crater, episodic ash emissions rose above the S1 crater, and occasional degassing with modest spattering were visible in the C crater.
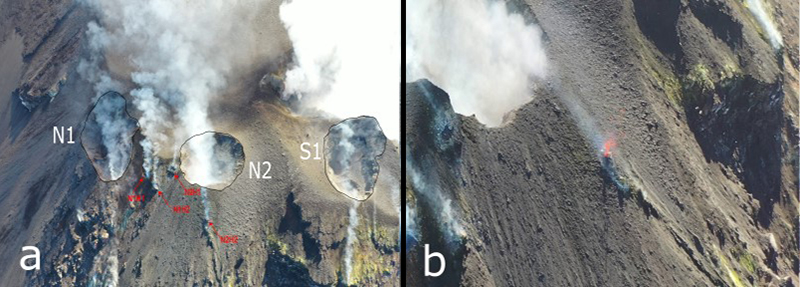 |
Figure 189. Drone images showing gas-and-steam emissions and Strombolian activity at Stromboli during 8-9 October 2020. The white annotations label the craters and the red show the active hornitos (H). The N2H2 label shows a small explosion (right). Images from the HPHT Lab from INGV-Roma 1. Courtesy of INGV (Rep. No. 42/2020, Stromboli, Bollettino Settimanale, 05/10/2020 - 11/10/2020, data emissione 13/10/2020). |
Strombolian explosions persisted into November. The N1 crater consisted of 2-3 vents, producing explosions of variable intensity; the N2 crater also consisted of 2-3 active vents that produced low- to medium-intensity explosions. The frequency of explosions ranged from 2-10 per hour in the N crater and 1-4 per hour in the CS crater. Lapilli and bombs, sometimes mixed with fine ash, rose 80-250 m above the N crater and fine material was ejected 150 m above the CS crater. On 10 November an explosion was detected at 2104 in the S2 crater of the CS area, producing pyroclastic material that was distributed radially along the Sciara del Fuoco, followed by an ash plume (figure 190). Within 30 seconds, another pulse of activity from the C crater in the northern part of the CS area produced intense lava fountaining that ejected coarse incandescent material 300 m above the crater, lasting about two minutes. At 2106 a small explosion was detected in the N2 crater, ending the explosive sequence.
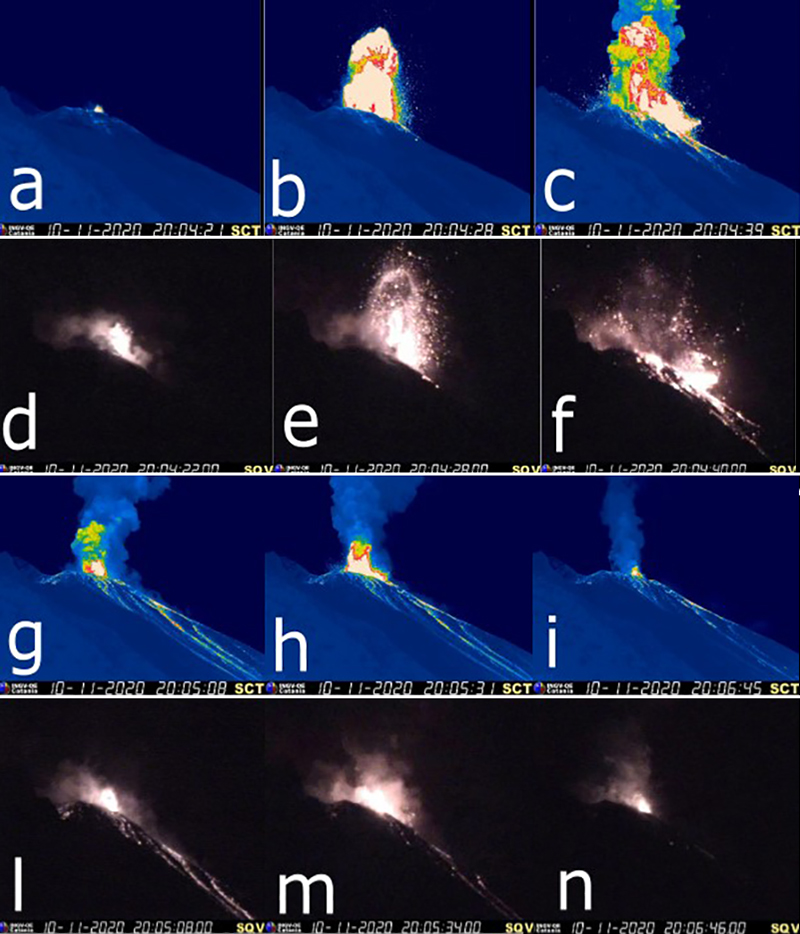 |
Figure 190. Thermal (rows 1 and 3) and webcam (rows 2 and 4) images showing the evolution of the explosion at Stromboli on the evening of 10 November 2020 accompanied by an ash plume and incandescent ejecta. Images captured by the SCT and SQV surveillance cameras. Courtesy of INGV (Rep. No. 47/2020, Stromboli, Bollettino Settimanale, 09/11/2020 - 15/11/2020, data emissione 17/11/2020). |
During an overflight by the 2nd Air Unit of the Coast Guard of Catania on 11 November, scientists identified degassing in the entire summit crater area; a small lava flow was observed in the S1 crater, originating from an intra-crater vent. Additional thermal anomalies were noted at the bottom of the C, N1, and N2 craters. Strong fumaroles were visible originating from a hornito located outside the S1 crater on the Sciara del Fuoco. A second hornito was visible on the slope of the Sciara del Fuoco near the N2 crater. On 16 November a major explosion was detected at 1017 in the N crater area and on the edge of the N2 crater. Thermal and visible images captured the resulting dense, gray ash plume that rose 1 km above the crater and the accompanying pyroclastic flow that descended the Sciara del Fuoco as far as 200 m (figure 191). Some ash and lapilli fell over the town of Stromboli, about 2 km away on the NE coast of the island. A sequence of explosive events at 0133 on 21 November was detected in three different craters: the first two events occurred in the N1 and N2 craters, and the third occurred in the C crater. Coarse material was ejected 300 m above the crater and was distributed radially, affecting the upper part of the Sciara del Fuoco. A small ash plume was also visible.
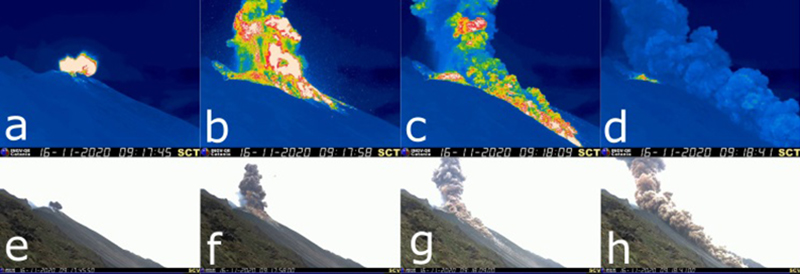 |
Figure 191. Thermal (top row) and webcam (bottom row) images showing the evolution of the explosion at Stromboli on the morning of 16 November 2020 accompanied by a significant gray ash plume. Images captured by the SCT and SCV surveillance cameras. Courtesy of INGV (Rep. No. 48/2020, Stromboli, Bollettino Settimanale, 16/11/2020 - 22/11/2020, data emissione 24/11/2020). |
During December, similar Strombolian explosions were reported. There were two eruptive vents in the N1 crater and 2-4 in the N2 crater that produced explosions of low intensity and low-to-medium intensity, respectively. The frequency of explosions ranged from 1-13 per hour in the N crater and 1-5 per hour in the CS crater. Fine ash mixed with some coarse material (lapilli and bombs) was ejected 80-150 m above the N crater and mostly fine material rose 150 m above the CS crater. Some spattering activity was reported in the N2 crater, which contributed to the formation of hornitos that produced incandescent material. On 6 December an explosive sequence of events was detected in the CS crater area at 0612. An explosion ejected material 300 m above the crater that were distributed radially, depositing on the upper Sciara del Fuoco. In addition, two small lava flows formed (figure 192). A second explosion was recorded at 0613, characterized by lava fountaining in the CS crater that reached a height of 200 m. Similar activity in the N and CS craters were also captured by webcam images on 21 and 27 December, which showed lava fountaining, accompanied by a small pyroclastic flow (figure 193).
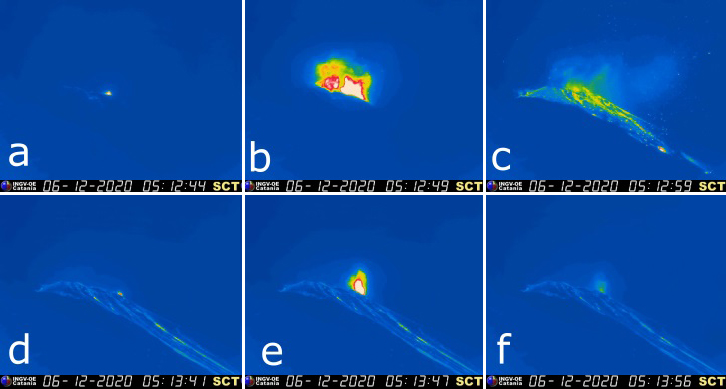 |
Figure 192. Thermal images of the explosion at Stromboli in the CS crater on 6 December 2020, accompanied by incandescent ejecta and two small lava flows. Some lava fountaining was visible in the bottom center image at 0513:47. Images captured by the SCT surveillance camera. Courtesy of INGV (Rep. No. 50/2020, Stromboli, Bollettino Settimanale, 30/11/2020 - 06/12/2020, data emissione 08/12/2020). |
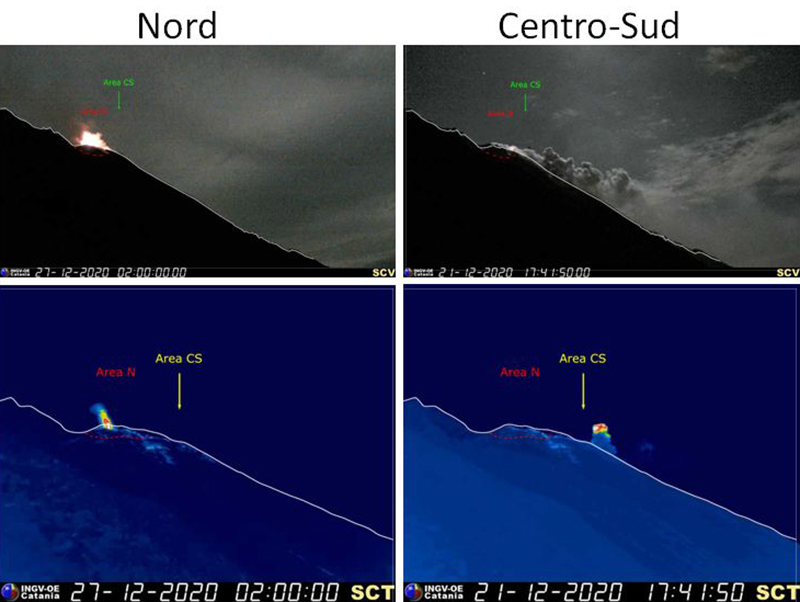 |
Figure 193. Webcam (top row) and thermal (bottom row) images of Strombolian activity in the N (left column) and CS (right column) crater areas at Stromboli on 21 December (top right) and 27 December (top left and bottom row) 2020. This activity included a small pyroclastic flow and lava fountaining. Images captured by the SCV and SCT surveillance cameras. Courtesy of INGV (Rep. No. 53/2020, Stromboli, Bollettino Settimanale, 21/12/2020 - 27/12/2020, data emissione 29/12/2020). |
Intermittent and low-power thermal activity was detected during September through December, according to the MIROVA Log Radiative Power graph using MODIS infrared satellite information (figure 194). Though there were no detected MODVOLC thermal alerts during this reporting period, many thermal hotspots were visible in one or both summit craters on clear weather days using Sentinel-2 thermal satellite imagery, which is due to Strombolian activity (figure 195).
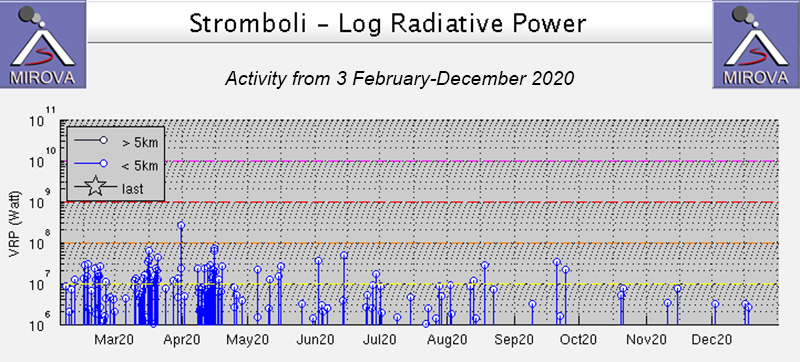 |
Figure 194. Intermittent, low thermal activity at Stromboli was recorded by the MIROVA graph (Log Radiative Power) during September through December 2020. The frequency of the thermal anomalies had decreased compared to the previous months of May through August; a total of eleven thermal anomalies were detected during this reporting period. Courtesy of MIROVA. |
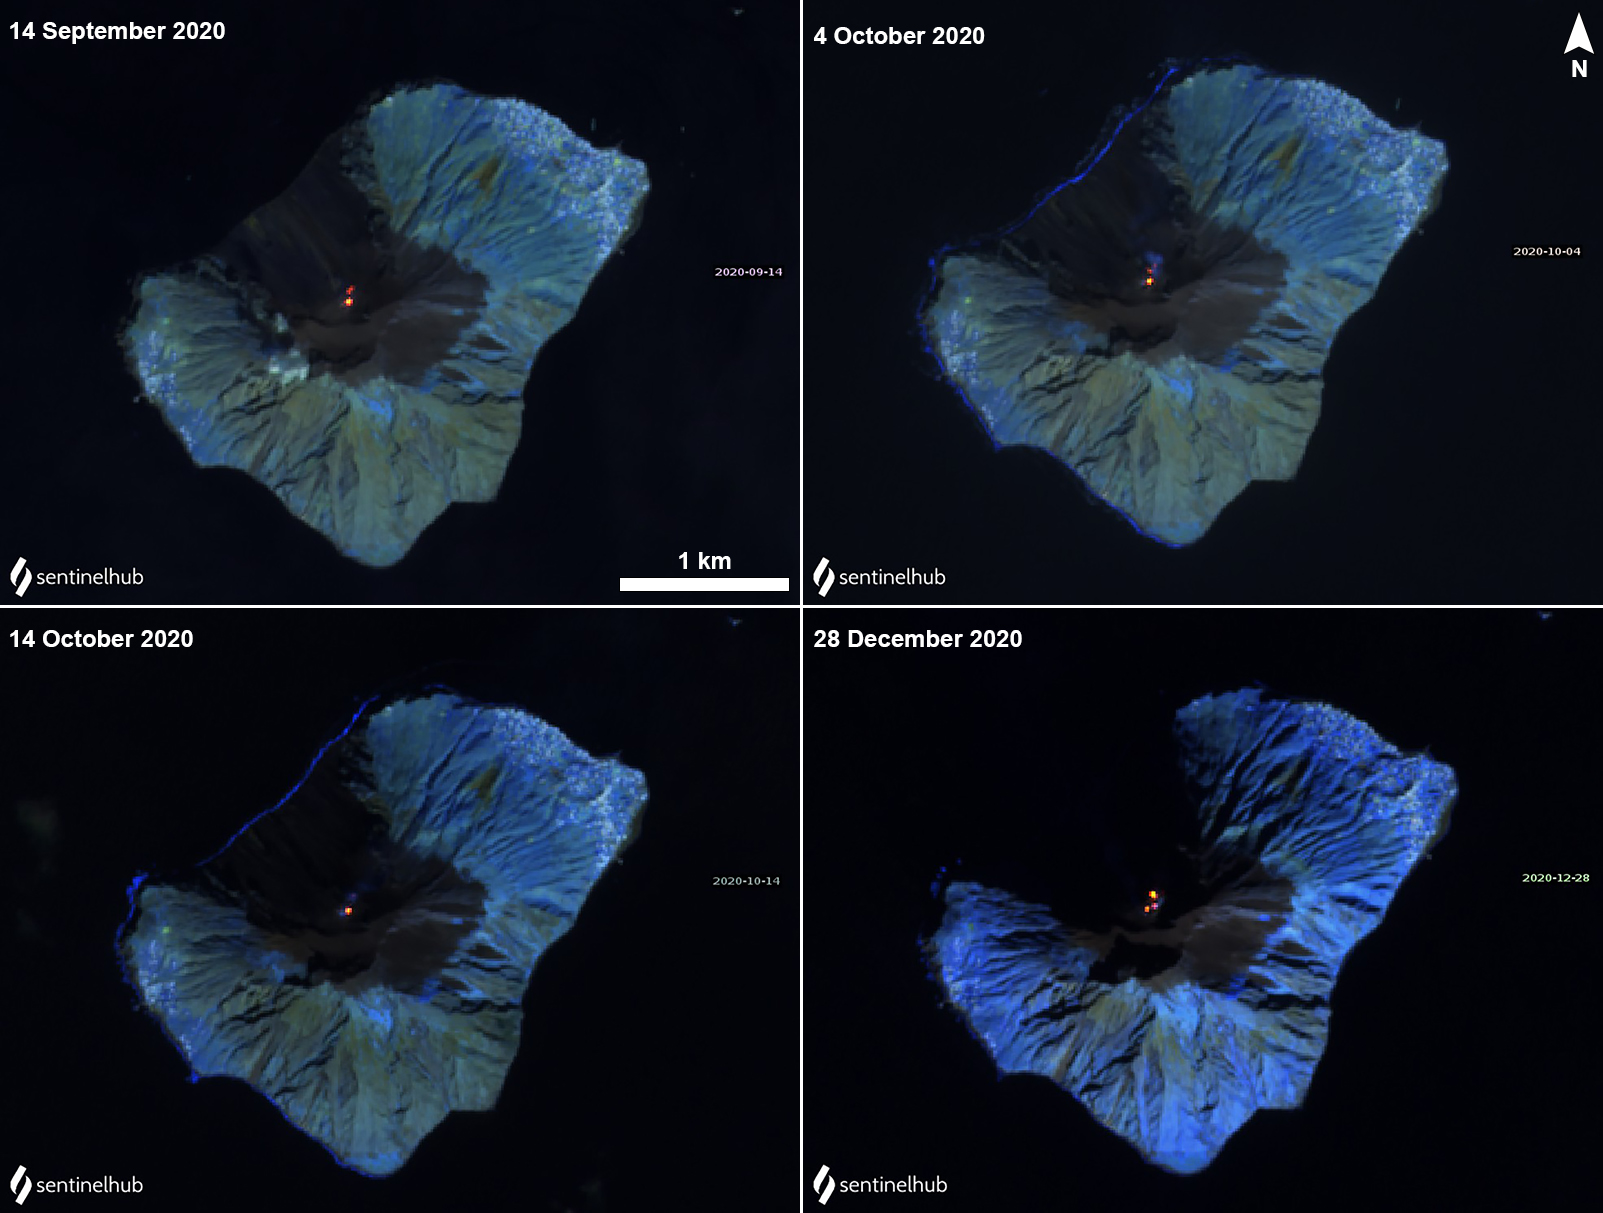 |
Figure 195. Weak thermal anomalies (bright yellow-orange) at Stromboli were visible in Sentinel-2 thermal satellite imagery from typically both summit craters during September through December 2020. Sentinel-2 satellite images with “Atmospheric penetration” (bands 12, 11, 8A) rendering. Courtesy of Sentinel Hub Playground. |
Geological Summary. Spectacular incandescent nighttime explosions at Stromboli have long attracted visitors to the "Lighthouse of the Mediterranean" in the NE Aeolian Islands. This volcano has lent its name to the frequent mild explosive activity that has characterized its eruptions throughout much of historical time. The small island is the emergent summit of a volcano that grew in two main eruptive cycles, the last of which formed the western portion of the island. The Neostromboli eruptive period took place between about 13,000 and 5,000 years ago. The active summit vents are located at the head of the Sciara del Fuoco, a prominent scarp that formed about 5,000 years ago due to a series of slope failures which extends to below sea level. The modern volcano has been constructed within this scarp, which funnels pyroclastic ejecta and lava flows to the NW. Essentially continuous mild Strombolian explosions, sometimes accompanied by lava flows, have been recorded for more than a millennium.
Information Contacts: Istituto Nazionale di Geofisica e Vulcanologia (INGV), Sezione di Catania, Piazza Roma 2, 95123 Catania, Italy, (URL: http://www.ct.ingv.it/en/); MIROVA (Middle InfraRed Observation of Volcanic Activity), a collaborative project between the Universities of Turin and Florence (Italy) supported by the Centre for Volcanic Risk of the Italian Civil Protection Department (URL: http://www.mirovaweb.it/); Sentinel Hub Playground (URL: https://www.sentinel-hub.com/explore/sentinel-playground).