Report on Nevados de Chillan (Chile) — May 2021
Bulletin of the Global Volcanism Network, vol. 46, no. 5 (May 2021)
Managing Editor: Edward Venzke.
Edited by A. Elizabeth Crafford.
Nevados de Chillan (Chile) N-flank flow grows 200 m while dome growth and explosions continue during November 2020-April 2021
Please cite this report as:
Global Volcanism Program, 2021. Report on Nevados de Chillan (Chile) (Crafford, A.E., and Venzke, E., eds.). Bulletin of the Global Volcanism Network, 46:5. Smithsonian Institution. https://doi.org/10.5479/si.GVP.BGVN202105-357070
Nevados de Chillan
Chile
36.868°S, 71.378°W; summit elev. 3180 m
All times are local (unless otherwise noted)
Nevados de Chillán is a large complex of late-Pleistocene to Holocene stratovolcanoes in the Chilean Central Andes that has had multiple historical eruptions dating back to the seventeenth century. The most recent eruption started with a phreatic explosion and ash emission on 8 January 2016 from a new crater (Nicanor) on the E flank of the Nuevo crater, itself on the NW flank of the large Volcán Viejo stratovolcano. Strombolian explosions and ash emissions continued throughout 2016 and 2017; a lava dome within the Nicanor crater was confirmed in early 2018. Explosions and pyroclastic flows continued into 2020; several lava flows appeared in late 2019. New dome growth began in late June 2020, accompanied by a new flow descending the N flank from the crater rim. This report covers continuing activity from November 2020-April 2021 when ongoing explosive events produced ash plumes, and growth of the dome inside the crater continued along with the lava flow extending farther down the N flank. Information for this report is provided primarily by Chile's Servicio Nacional de Geología y Minería (SERNAGEOMIN)-Observatorio Volcanológico de Los Andes del Sur (OVDAS), and from satellite data.
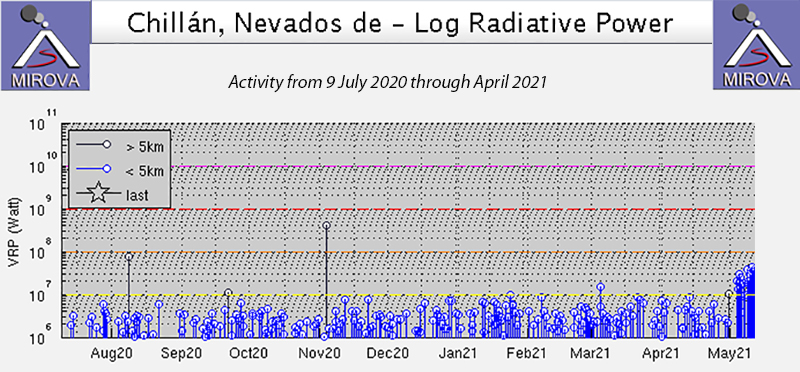
Activity at Nevados de Chillán during November 2020-April 2021 was similar to the previous few months. The flow that appeared on the N flank at the end of June lengthened by more than 200 m and increased significantly in volume. A second thermal anomaly on the edge of Nicanor crater at the head of the flow first appeared in satellite imagery on 14 July 2020 and persisted in all subsequent clear images through April 2021 along with the anomaly from the growing dome inside the crater. Tens of seismic explosive events were measured daily; many produced plumes of gas and ash. The dome inside the crater continued to grow even though explosive events intermittently destroyed parts of the dome. An increase in the flow rate was observed at the very end of April, and a new lava flow appeared on the NE flank at the beginning of May. Thermal activity shown in the MIROVA graph indicated a constant level of heat energy from July 2020 through the end of April 2021 (figure 69).
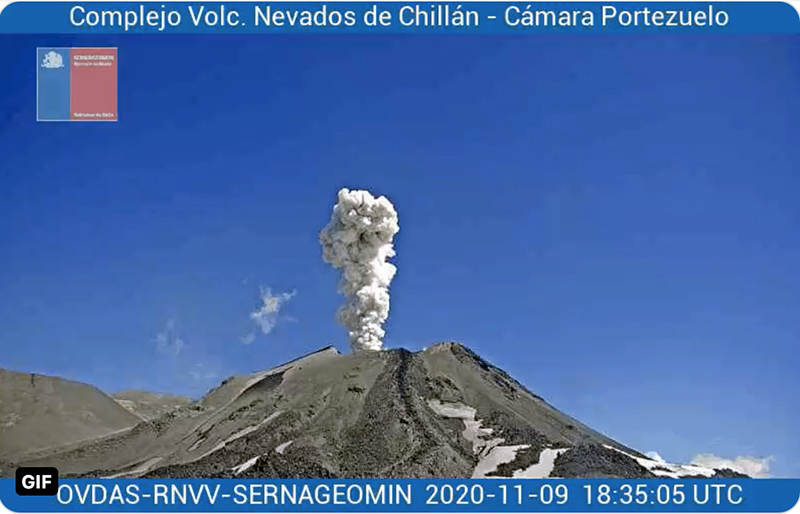
During the first half of November 2020 there were 61 volcano-tectonic (VT) and 575 explosive events recorded. Plume heights did not exceed 1,140 m above the Nicanor crater and only a few of them contained identifiable ash (figure 70). Incandescence was observed at the E edge of crater on clear nights. SERNAGEOMIN reported that a small crater continued to grow on the inner E rim of the Nicanor crater and was identified in satellite images; during some explosions, two sources of emissions were apparent. During the second half of the month 70 VT and 573 explosive seismic events were recorded. Webcam images indicated that the plumes from the explosions remained at low altitude (less than 1,000 m above the crater rim), and little to no tephra was noted; the emissions were primarily gas. Most of the emissions originated from the central area of the dome inside the crater, but the second emission site, located at the E edge of the crater remained active.
The lava flow (L5) on the N flank of Volcan Nuevo continued to advance during November 2020, reaching about 720 m from the rim of Nicanor crater by mid-month with an estimated speed of 1.4 m/day the flow only advanced about 10 m during the second half of November. Its size was estimated at about 580,000 m3 by the middle of the month. Dome growth inside the crater continued as well; it was measured in mid-November as 45 m high with a volume a little over 200,000 m3. During an overflight in mid-November SERNAGEOMIN scientists noted a fracture about 50 m long on the N side of the dome that extended NE-SW, was 10 m deep, and connected the dome to the central channel of the L5 lava flow. Inflation rates of 3-5 mm/month were recorded at GNSS stations around the active crater at mid-month. The vertical inflation increased to a rate of 12 mm/month during the second half of the month while the horizontal displacement remained low at 2 mm/month.
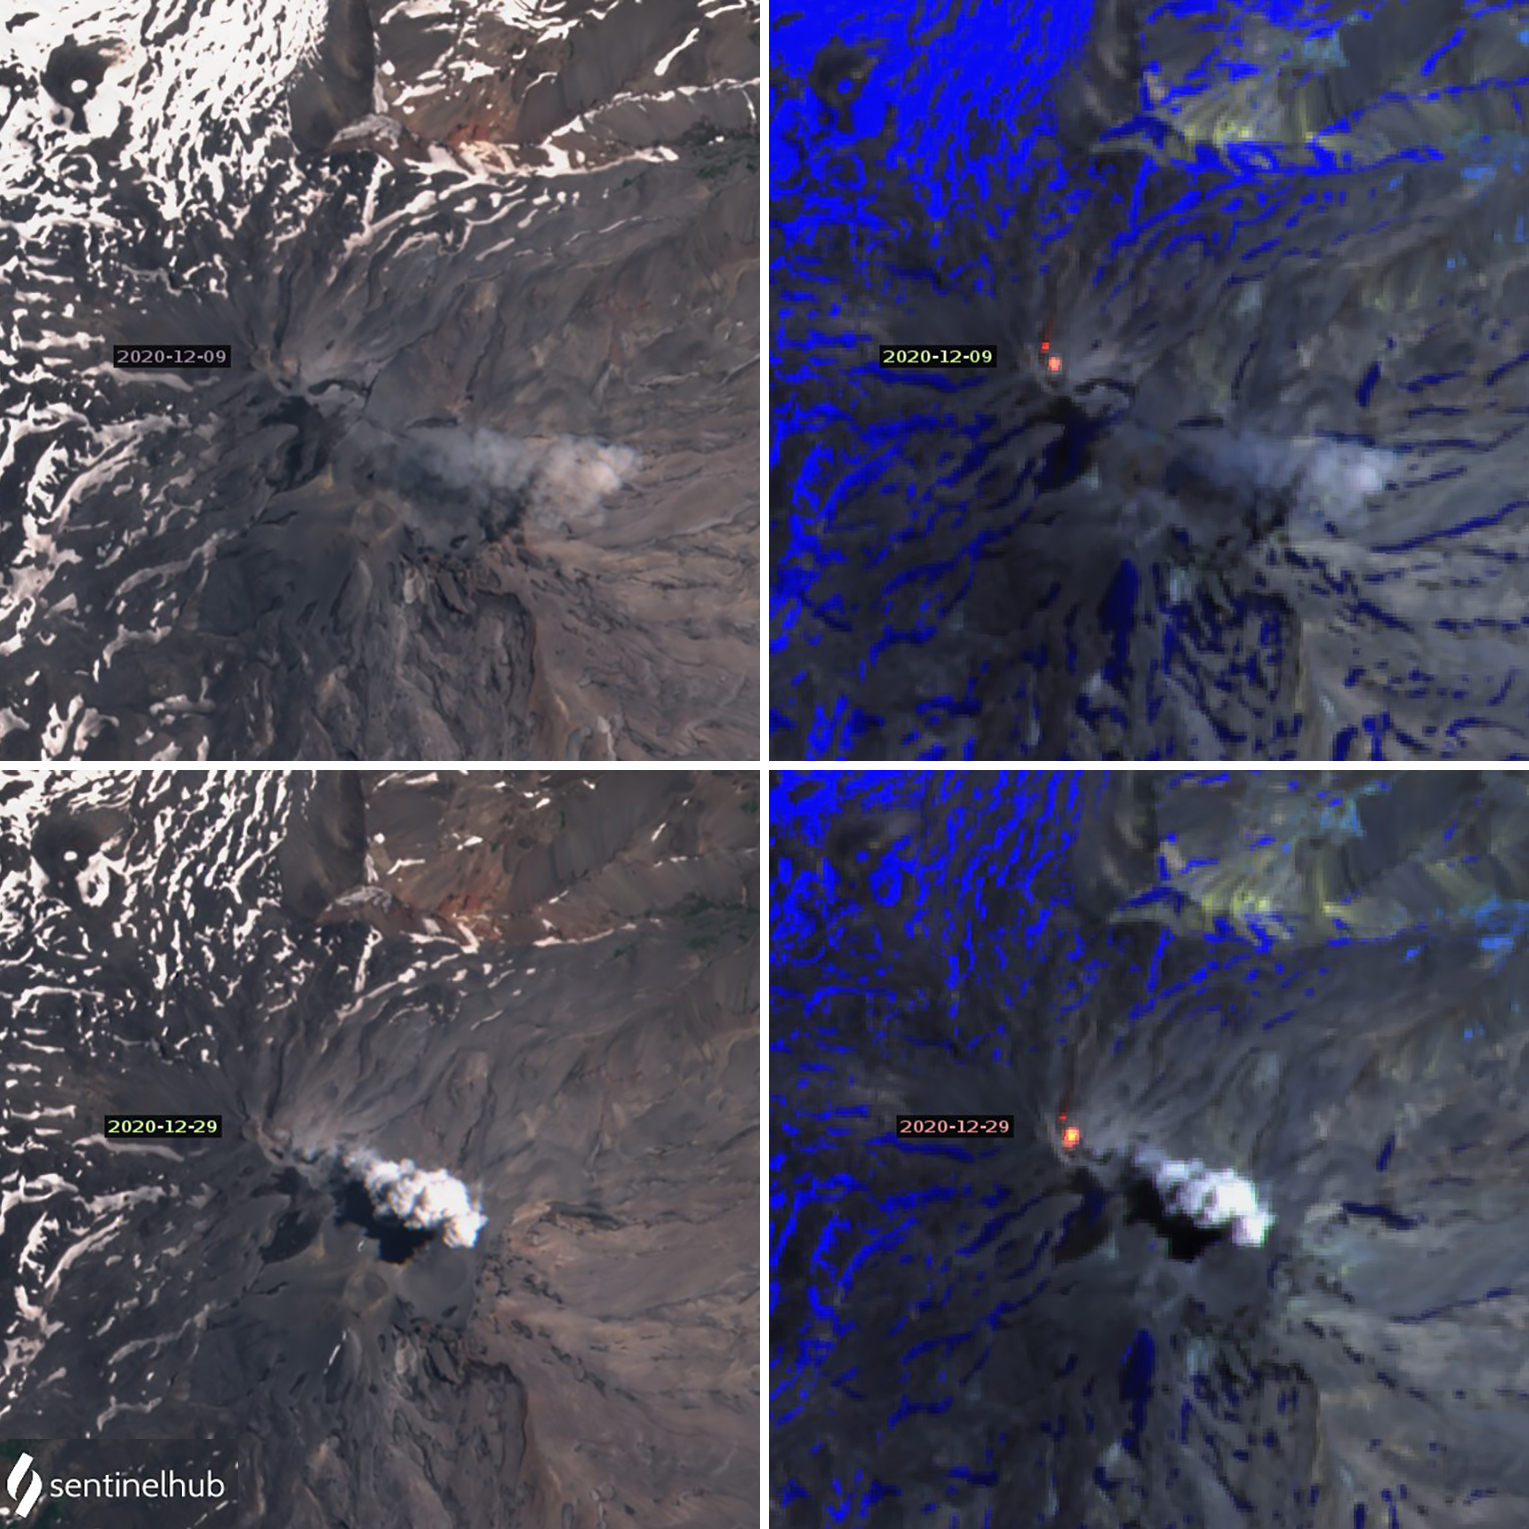
VT seismic events increased in frequency during December 2020 to 192 during the first half of the month and 236 during the second half. The numbers of explosions remained similar with 551 during the first two weeks and 582 during the second. Explosion plumes usually remained less than 1,200 m above the summit and contained moderate amounts of particulates (figure 71). Most of the explosions appeared to come from the dome inside the crater; later in the month a few explosions appeared to cause partial destruction of the NE corner of the dome and produced limited pyroclastic flows adjacent to the crater.
The L5 lava flow was 750 m long and 20 m wide by 15 December, and it had grown 15 m by the end of the month. The rate of dome growth appeared to increase during the second half of December, with the dome growing over the crater rim on the NNE edge, causing block avalanches to descend the NNE flank. Deformation data indicated a high level of inflation, with a horizontal displacement rate of 5 mm/month and a vertical rate of 11 mm/month. The accumulated volume of new material from both the dome and the flow since late June 2020 was estimated at a little over 1,400,000 m3 at the end of December.
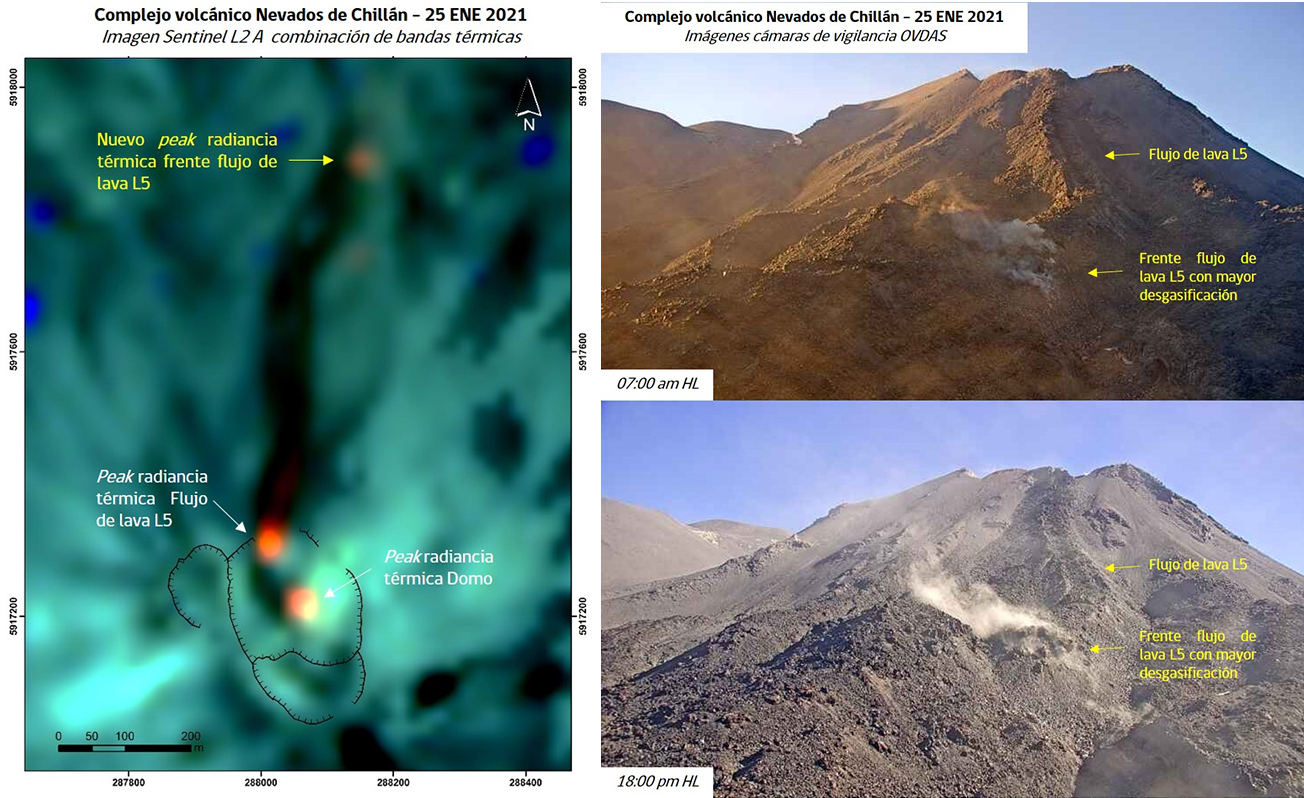
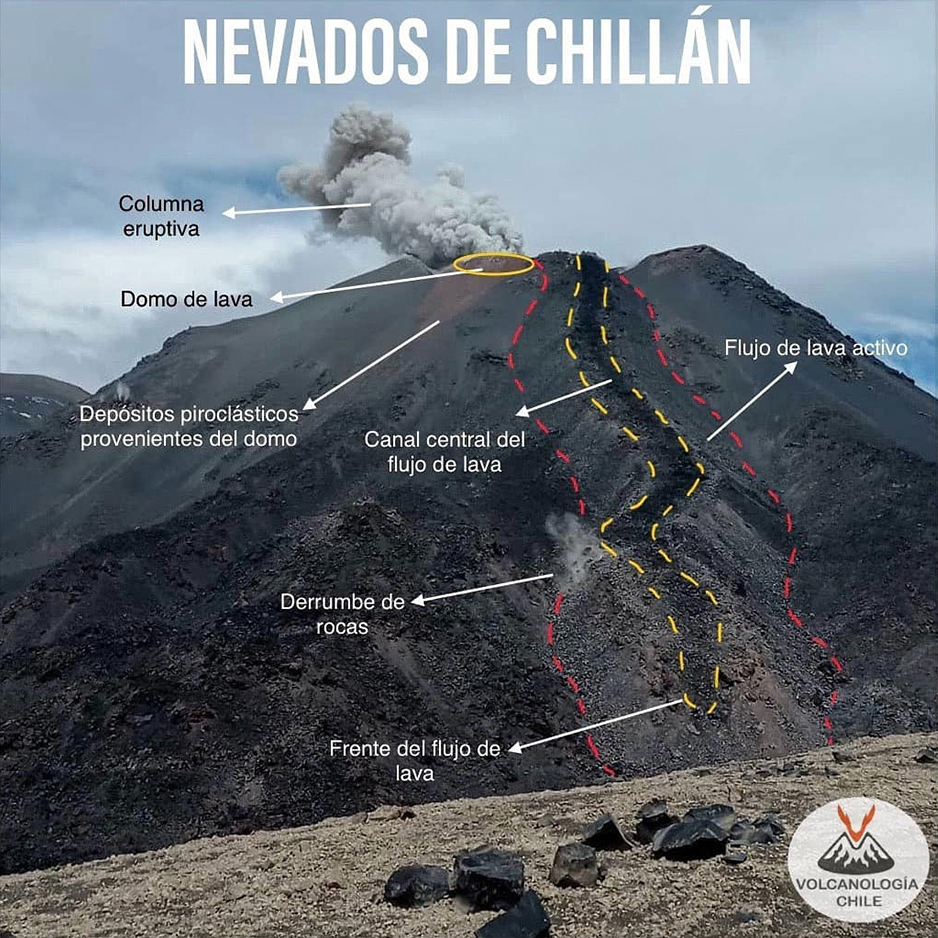
The number of seismic events continued to increase in January 2021 with 386 VT events recorded for 1-15 January and 244 events 16-31 January. For explosions, 659 events occurred during the first half of the month, and 676 were reported for the second half. The explosions from the dome rose up to 1,200 m above the crater during the first half of January and 1,400 m high during the second half. Dome growth continued with activity focused in the NNE part of the crater; fragments traveled up to 100 m down that flank. Increased flow from the fissure at the head of the L5 flow led to an increase in the flow rate at the head of the flow to about 1.7 m/day by mid-month when it was 788 m long. The inflation rate remained constant during the first half of the month. Intense continuous degassing was observed from the front of the L5 flow during 23-25 January (figure 72). This coincided with a rise in thermal radiance in the same area. By the end of the month the flow was 808 m long, and the central channel had enlarged to 40 m wide near the head of the flow. An increased flow rate observed in the webcams was accompanied by the development of lateral lobes at the head of the flow. A slight decrease in the rate of inflation was recorded near the end of the month.
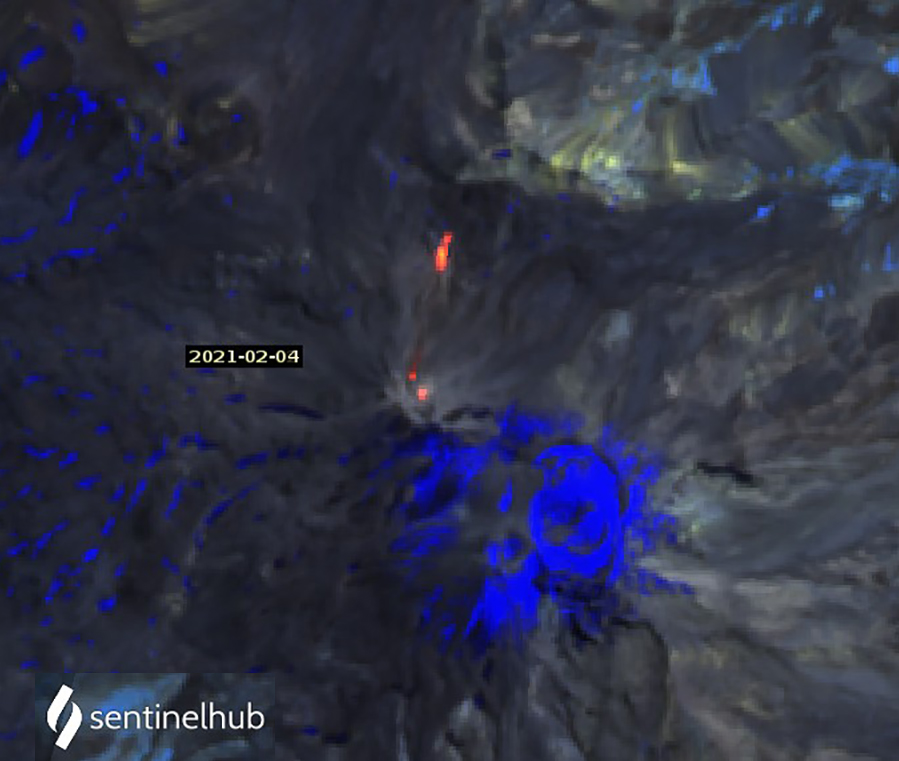
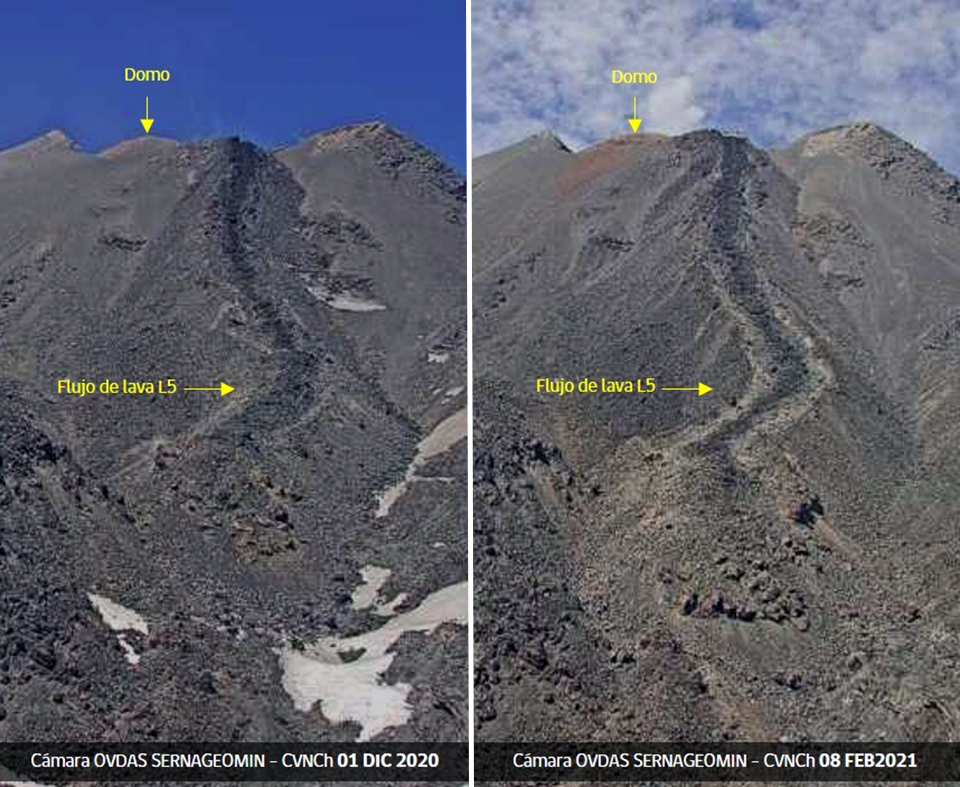
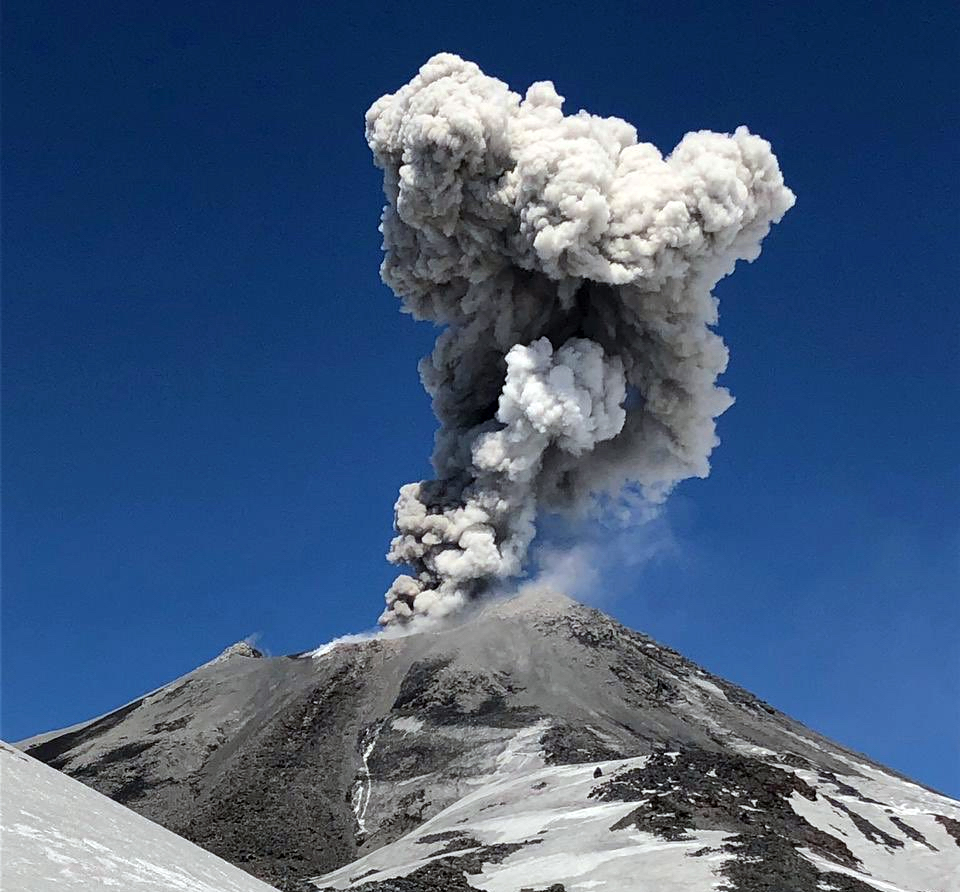
A bright thermal anomaly near the front of the L5 flow on 4 February 2021 was attributed by SERNAGEOMIN to the rupture of the crust and partial collapse of that area due to an increased flow rate (figure 73). Dome growth continued in February with ejecta from explosions reaching 70-100 m from the crater rim. The central channel of the L5 flow continued to widen from the inferred increase in flow rate (figure 74); it was 710 m long by the end of the month. The total flow length was estimated at 860 m by 15 February and 900 m long by the end of the month. Its volume measured on 15 February was about 1,700,000 m3. Inflation continued at a rate of 5-8 mm/month near the active crater, but a small deflation was recorded 11 km E. Eruption plumes rose no higher than 1,100 m above the crater during February 2021 and contained various amounts of particulate matter (figure 75). The number of VT seismic events decreased to 165 during the first half of the month and to 106 during the second half, but the number of explosive events was relatively constant at 598 during 1-15 February and 471 during 16-28 February.
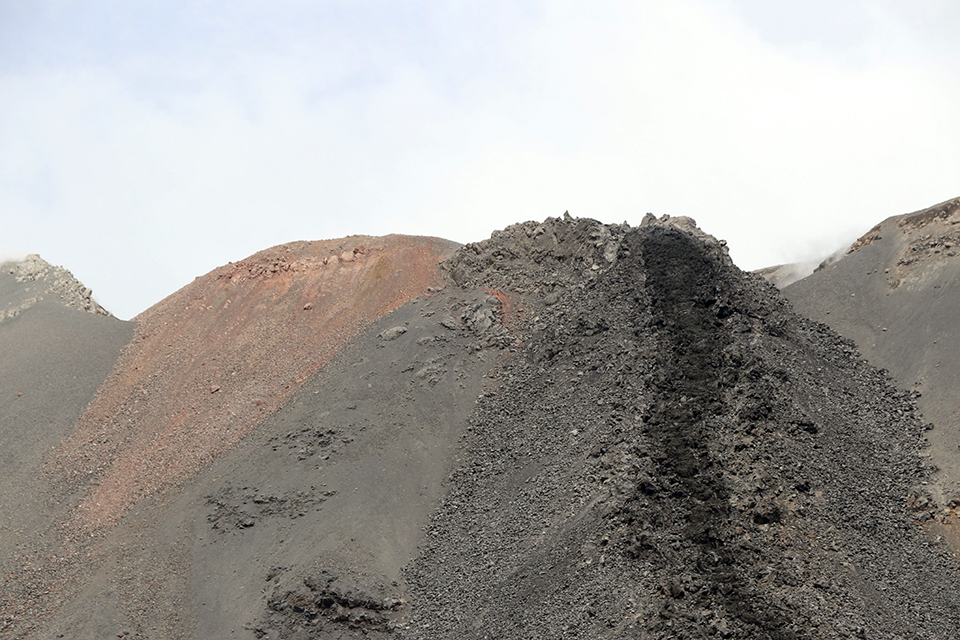
Incandescence at night was often visible from the E side of the crater during March 2021. The explosion heights were up to 1,200 m during the beginning of the month, and below 1,000 m during the latter half when most of the plumes rose less than 500 m. There were 232 VT events and 534 explosions during 1-15 March and 214 VT events and 556 explosions during 13-31 March. The estimated volume of the dome on 6 March was a little over 300,000 m3. Dome growth continued with ejecta traveling up to 160 m from the dome; the L5 flow front was 80 m wide by the middle of the month and measured 950 m long in satellite imagery; detachment blocks fell from the front and sides of the flow. The rate of inflation decreased during the month. During an overflight on 24 March SERNAGEOMIN observers noted a significant increase in the quantity of pyroclastic debris inside Nicanor crater compared with the previous overflight on 2 December 2020. Blocks as large as 50 cm were scattered around the dome, and a few reached the adjacent Nuevo and Arrau craters. Ejecta was scattered up to 140 m from the crater rim. A collapse on the N rim had sent debris down that flank. The main fissure feeding the flow had grown to 20 m wide and almost 70 m long by the end of the month (figure 76). Measurements of the volume of effusive material on 24 March from a DEM indicated that the extruded volume since June 2020 of the flow was just over 1,900,000 m3 and for the dome was almost 412,000 m3.
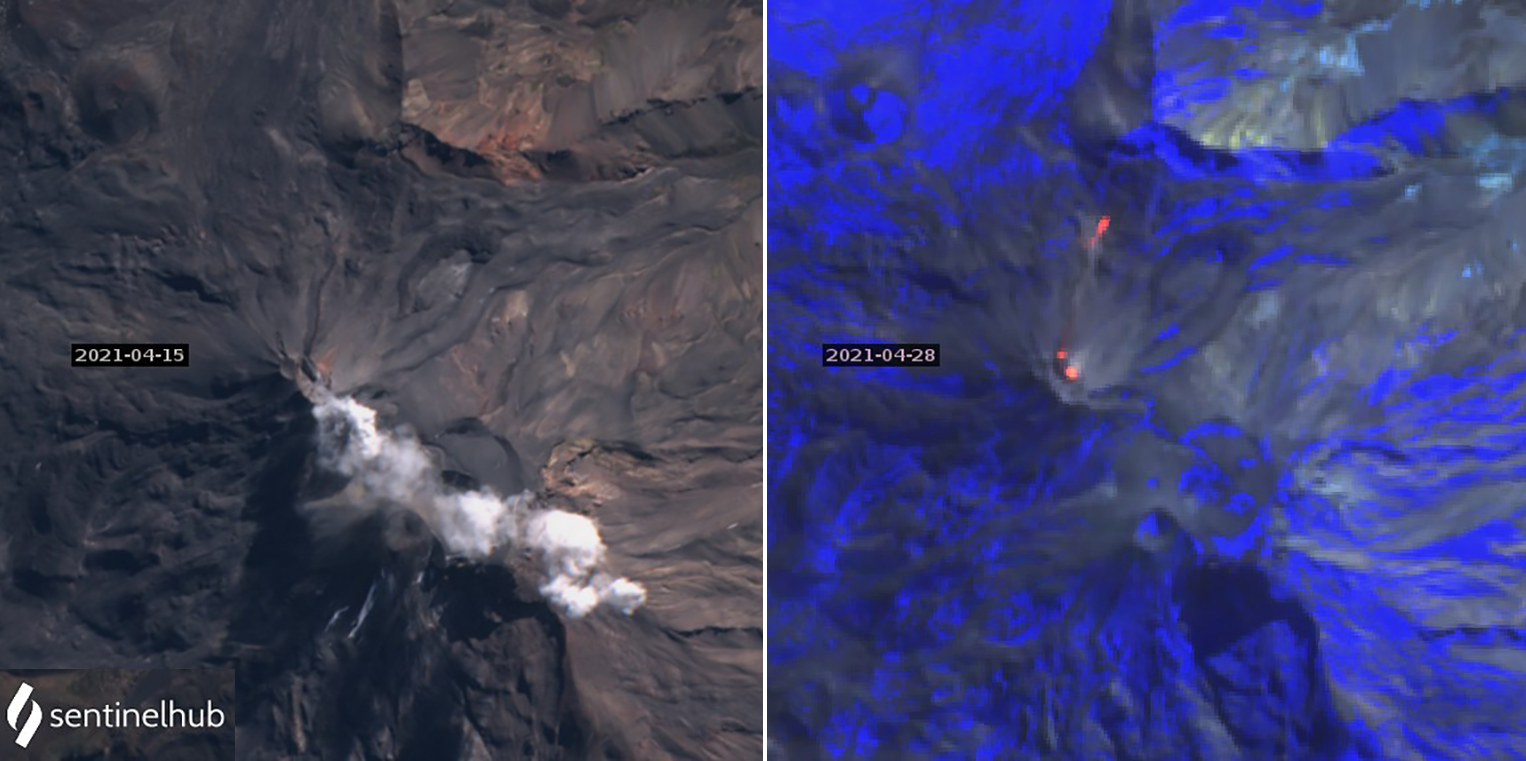
Both explosive and effusive activity increased during April 2021, although the height of the plumes remained below 800 m. Continued dome growth beyond the NE edge of the crater had created an area of unconsolidated deposits on the NE flank. The dome extended 140 m beyond the crater by mid-month. The fissure connecting the dome and the N-flank L5 flow measured 60 m long, 25 m wide, and 8 m high by 15 April, and had grown to 80 m long and 32 m wide by the end of the month (figure 77). The total volume of extruded material from both the dome and the flow on 13 April was about 2,760,000 m3. Lava spines were reported during the second half of April. The lava dome continued to grow and reached 66 m high by mid-month. Most of the growth during the first half of the month was concentrated on the edges, with a depression in the center of the dome. During the second half of April the dome growth was concentrated on the W edge of the crater. The lava flow was about the same length at the end of April as it had been at the end of March. Horizontal inflation increased to 12.5 mm/month during the first half of April but was stable during the second half; the vertical component indicated inflation from all the stations, with the maximum deformation of 21 mm at station FRSC. An increase in the flow rate was observed beginning on 28 April (figure 78), and a new lava flow on the NE flank was observed on 4 May 2021.
Geological Summary. The compound volcano of Nevados de Chillán is one of the most active of the Central Andes. Three late-Pleistocene to Holocene stratovolcanoes were constructed along a NNW-SSE line within three nested Pleistocene calderas, which produced ignimbrite sheets extending more than 100 km into the Central Depression of Chile. The dominantly andesitic Cerro Blanco (Volcán Nevado) stratovolcano is located at the NW end of the massif. Volcán Viejo (Volcán Chillán), which was the main active vent during the 17th-19th centuries, occupies the SE end. The Volcán Nuevo lava-dome complex formed during 1906-1945 on the NW flank of Viejo. The Volcán Arrau dome complex was then constructed on the SE side of Volcán Nuevo between 1973 and 1986, and eventually exceeded its height. Smaller domes or cones are present in the 5-km valley between the two major edifices.
Information Contacts: Servicio Nacional de Geología y Minería (SERNAGEOMIN), Observatorio Volcanológico de Los Andes del Sur (OVDAS), Avda Sta María No. 0104, Santiago, Chile (URL: http://www.sernageomin.cl/, https://twitter.com/Sernageomin); MIROVA (Middle InfraRed Observation of Volcanic Activity), a collaborative project between the Universities of Turin and Florence (Italy) supported by the Centre for Volcanic Risk of the Italian Civil Protection Department (URL: http://www.mirovaweb.it/); Buenos Aires Volcanic Ash Advisory Center (VAAC), Servicio Meteorológico Nacional-Fuerza Aérea Argentina, 25 de mayo 658, Buenos Aires, Argentina (URL: http://www.smn.gov.ar/vaac/buenosaires/inicio.php); Sentinel Hub Playground (URL: https://www.sentinel-hub.com/explore/sentinel-playground); Volcanología Chile (URL: https://www.volcanochile.com/joomla30/, Twitter: @volcanologiachl).


