Report on Masaya (Nicaragua) — June 2021
Bulletin of the Global Volcanism Network, vol. 46, no. 6 (June 2021)
Managing Editor: Edward Venzke.
Edited by Kadie L. Bennis.
Masaya (Nicaragua) Lava lake remains active accompanied by gas-and-steam emissions during December 2020-May 2021
Please cite this report as:
Global Volcanism Program, 2021. Report on Masaya (Nicaragua) (Bennis, K.L., and Venzke, E., eds.). Bulletin of the Global Volcanism Network, 46:6. Smithsonian Institution. https://doi.org/10.5479/si.GVP.BGVN202106-344100
Masaya
Nicaragua
11.9844°N, 86.1688°W; summit elev. 594 m
All times are local (unless otherwise noted)
Masaya is a 6.5 x 11.5 km caldera located about 20 km SE of Managua, the capital of Nicaragua, and includes the Nindirí, San Pedro, San Juan, and the currently active Santiago craters. Its current eruption period began in October 2015 and has been characterized primarily by an active lava lake and occasional gas-and-steam emissions (BGVN 45:12). This report updates activity during December 2020 through May 2021 using information from the Instituto Nicareguense de Estudios Territoriales (INETER) and various satellite data.
Thermal activity was consistent throughout the reporting period due to the active lava lake in the Santiago crater. MIROVA (Middle InfraRed Observation of Volcanic Activity) analysis of MODIS satellite data showed intermittent low-power thermal anomalies during December 2020 through May 2021 (figure 93). This thermal activity was also observed in Sentinel-2 infrared thermal imagery, which was represented by a bright yellow-orange thermal anomaly in the Santiago crater’s lava lake (figure 94). Small and intermittent sulfur dioxide emissions that drifted generally W were also observed during February through May based on data from the TROPOMI instrument on the Sentinel-5P satellite (figure 95). These SO2 emissions were also measured each month based on several transects using a mobile DOAS spectrometer.
 |
Figure 93. Intermittent low-power thermal anomalies were detected at Masaya between December 2020 through May 2021, as shown on this MIROVA graph (Log Radiative Power). Courtesy of MIROVA. |
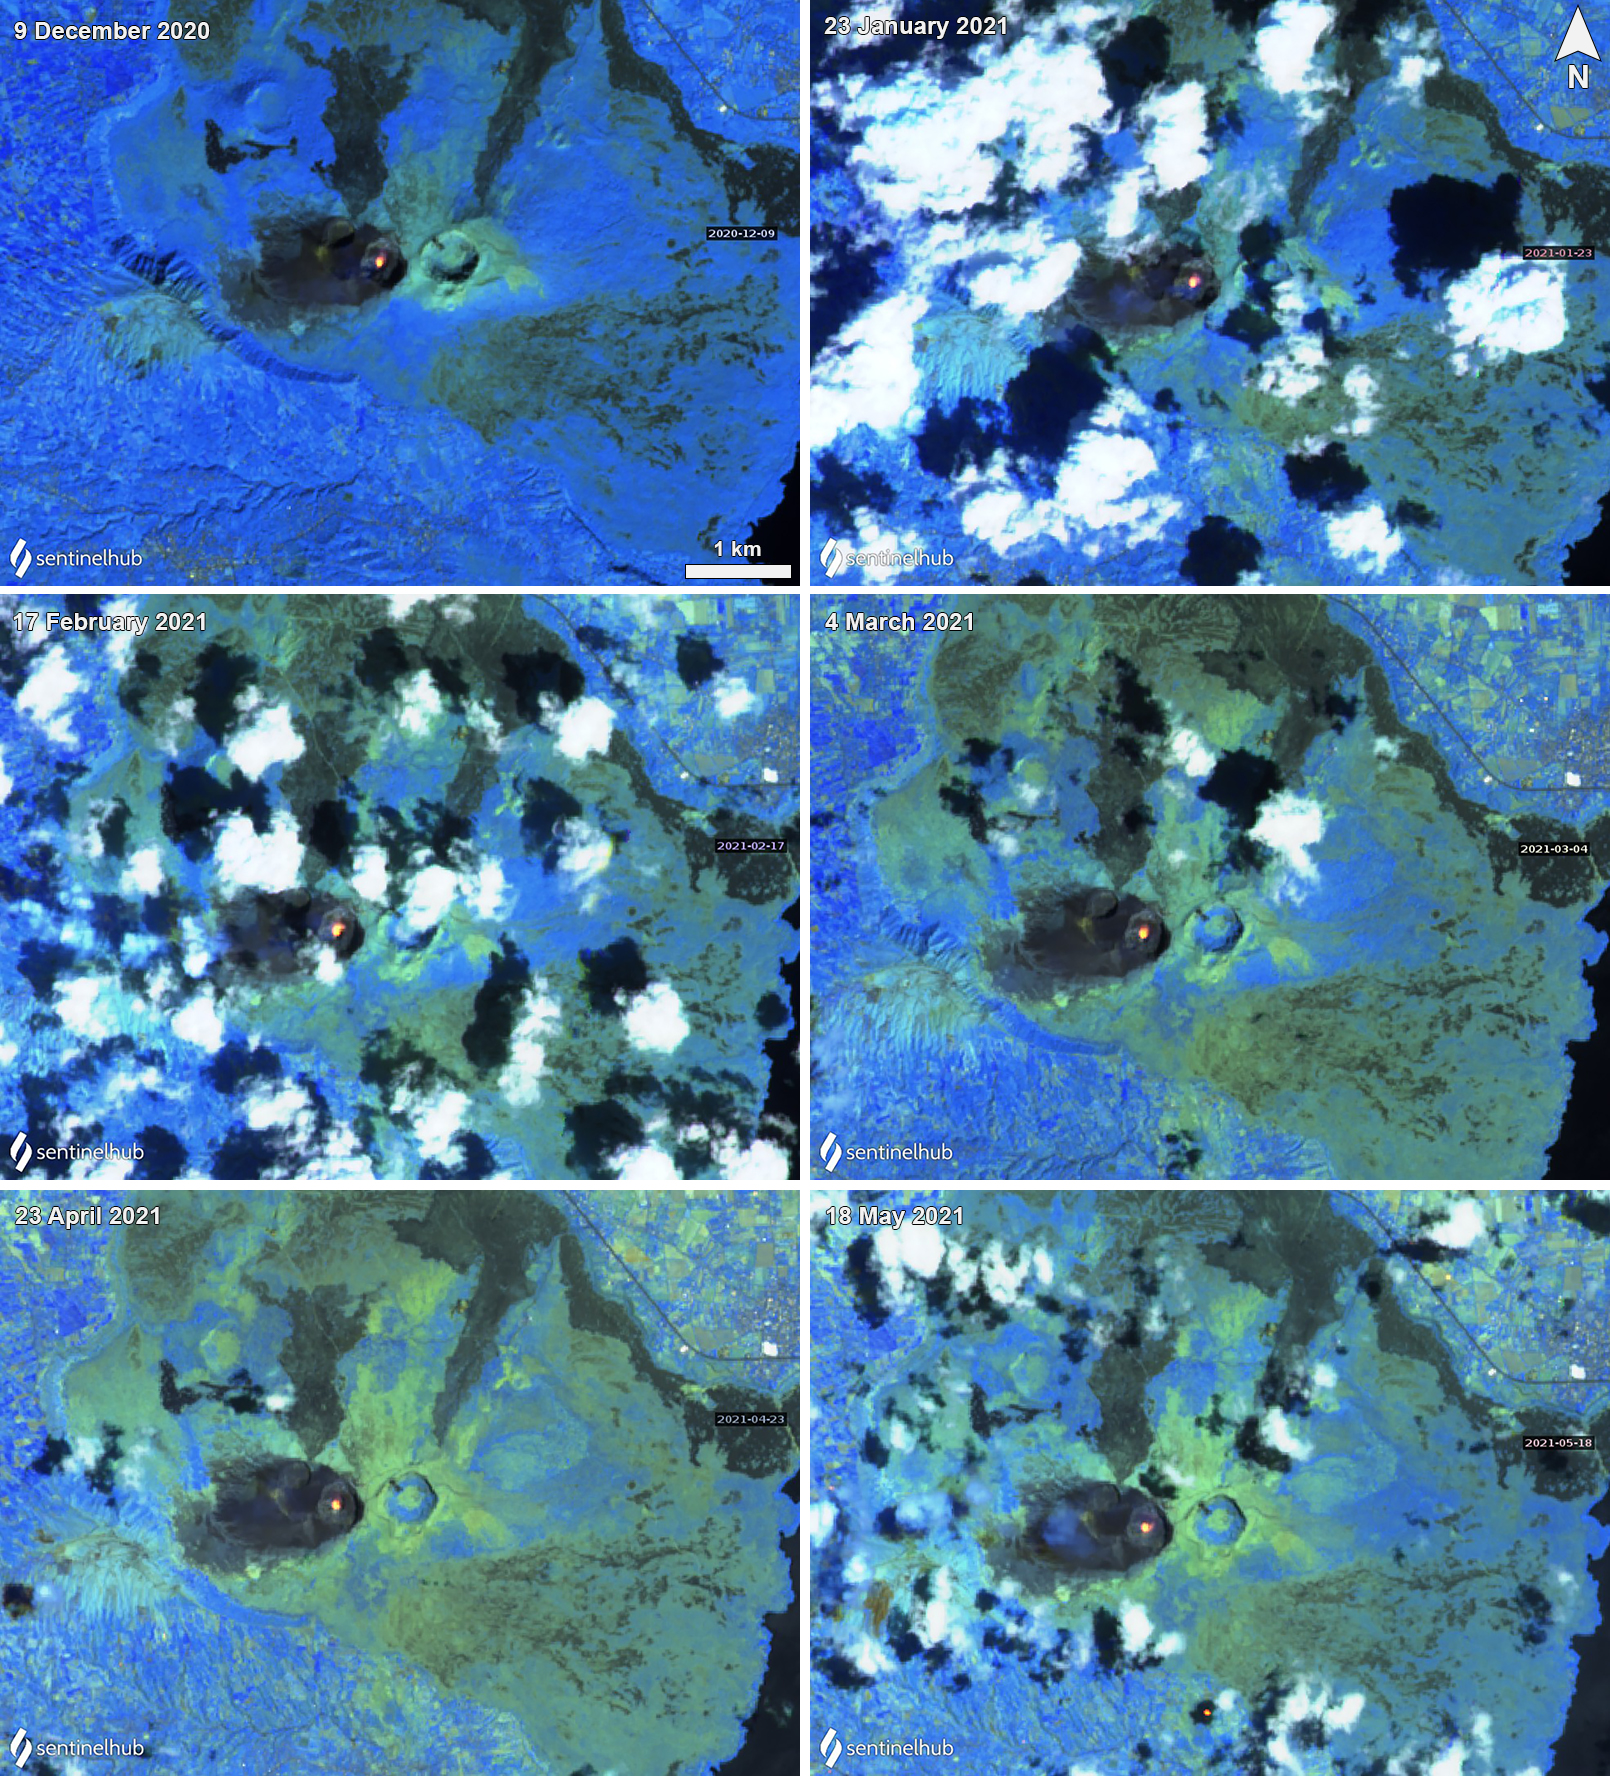 |
Figure 94. Sentinel-2 infrared satellite imagery showed the active lava lake (bright yellow-orange) at the summit crater of Masaya during December 2020 through May 2021. Images with "Atmospheric penetration" (bands 12, 11, 8A) rendering. Courtesy of Sentinel Hub Playground. |
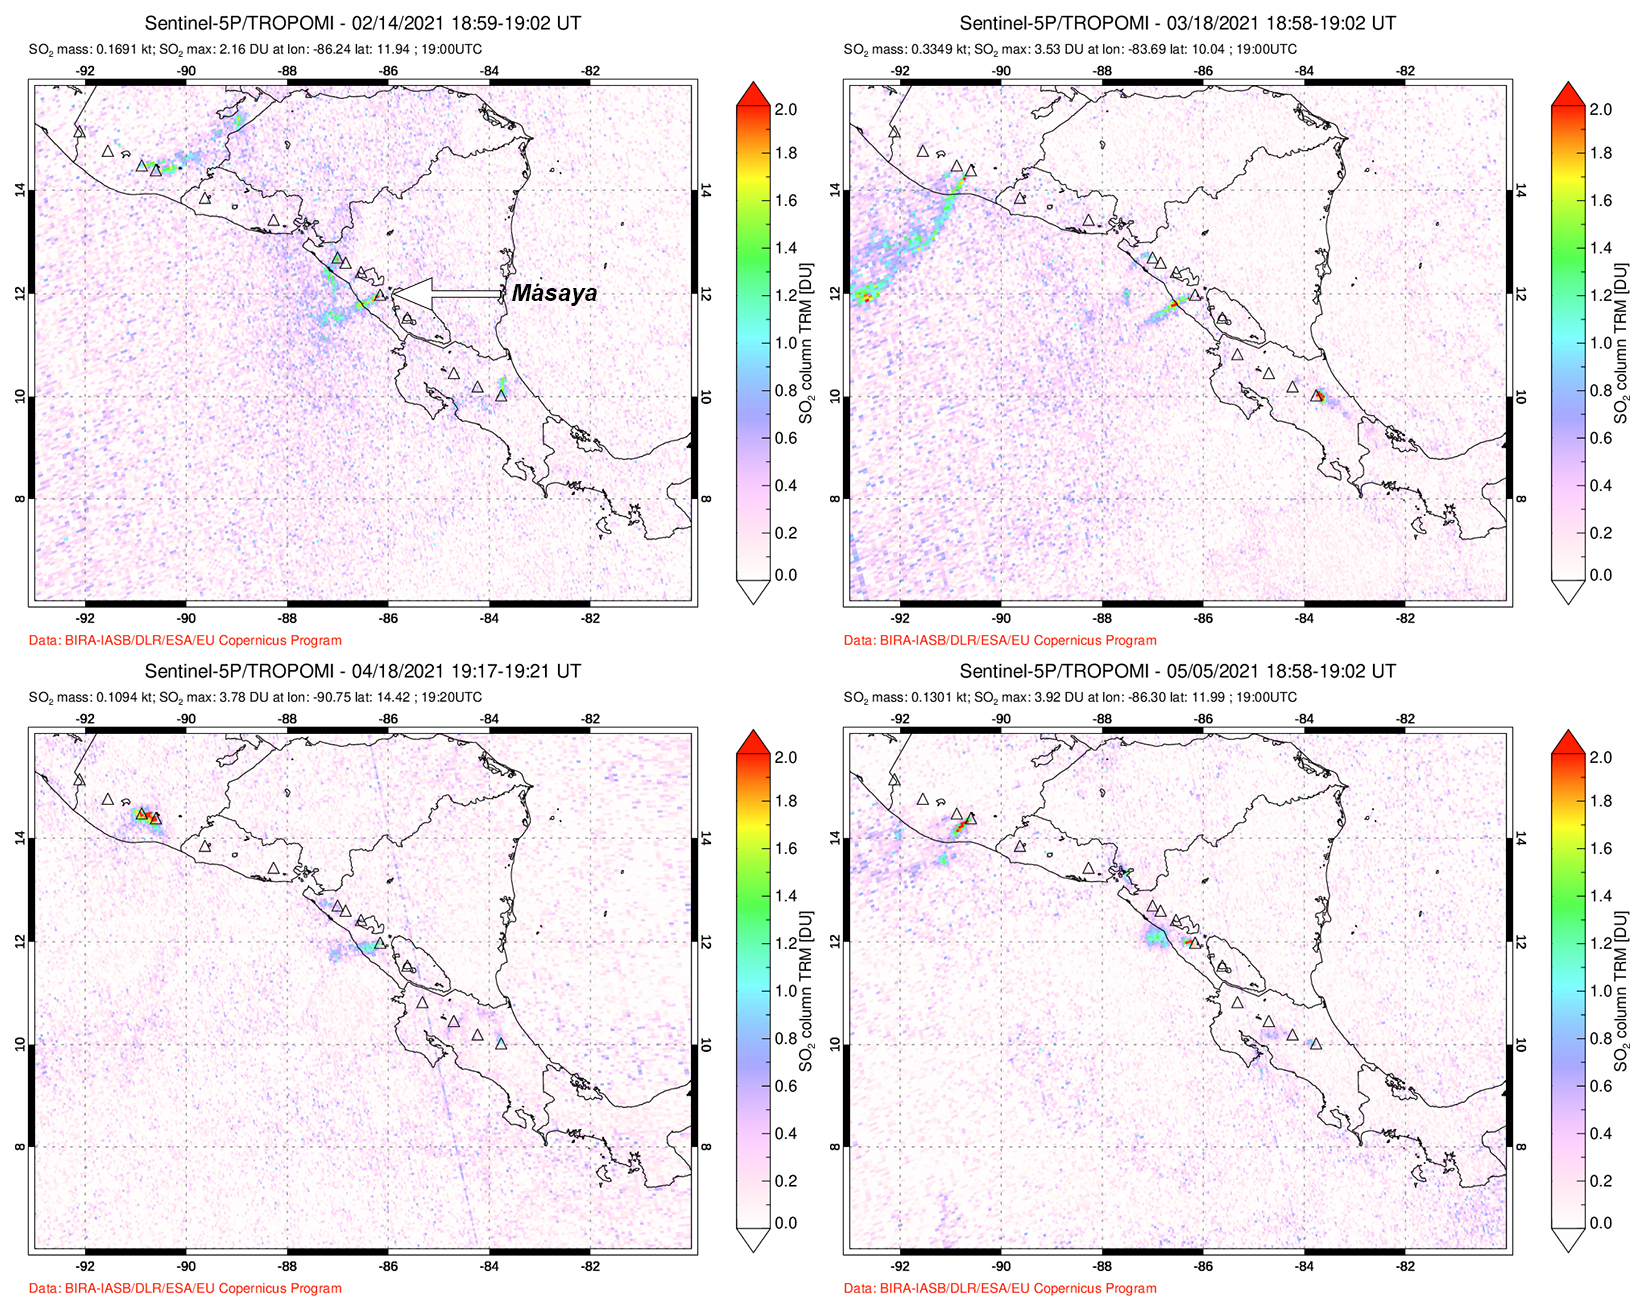 |
Figure 95.Weak sulfur dioxide emissions were captured rising from Masaya on 14 February (top left), 18 March (top right), 18 April (bottom left), and 5 May (bottom right) 2021 drifting generally W, based on data from the TROPOMI instrument on the Sentinel-5P satellite. Courtesy of NASA Global Sulfur Dioxide Monitoring Page. |
Volcanism was relatively low during the reporting period, with an active lava lake, white gas-and-steam emissions, and seismic events that included low-frequency (LF) and volcano-tectonic (VT) earthquakes. In December 2020 a total of 9,113 seismic events were detected, a majority of which were described as low-frequency events.
During January 2021 seismicity continued, with 23,291 LF events recorded at a constant 150 RSAM units. INETER scientists took SO2 measurements by making several transects using a mobile DOAS spectrometer that sampled for gases downwind of the volcano. The average value taken on 18 and 22 January was 1,088 tons/day, which was higher than values of 819 tons/day in November 2020. On 22 January thermal images of the active lava lake in the Santiago crater were taken to measure the temperature with a FLIR SC620 thermal camera. The temperature was 841°C, an increase of 83°C since the previous measurements in November. Some crater wall collapses on the E side were noted due to rock fractures and erosion.
Activity in February was similar with seismic events measuring around 150 RSAM units and according to INETER, the lava lake had decreased significantly; crater walls continued to frequently collapse. Fumaroles were commonly visible in the crater (figure 96). On 8 February thermal images of the Santiago crater showed temperatures of 338.7°C. SO2 measurements from 18 February averaged 1,466 tons/day, which was slightly higher than January.
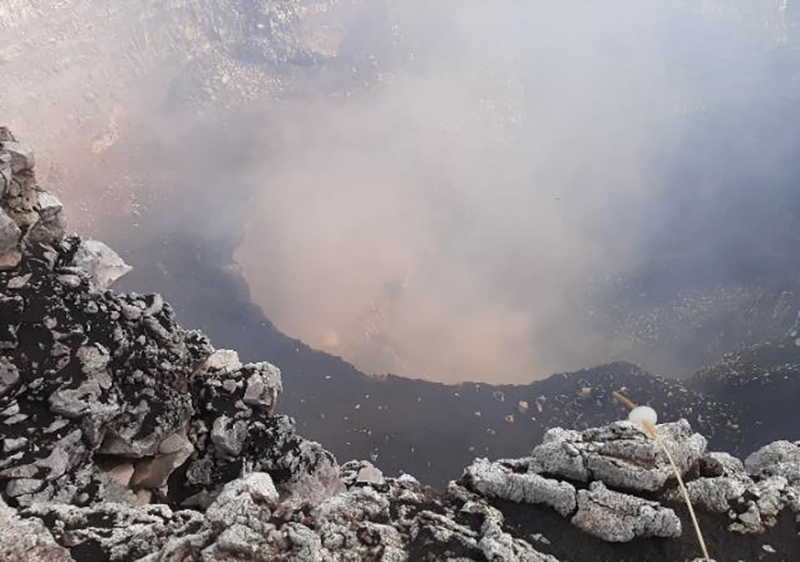 |
Figure 96. Photo of gas-and-steam emissions in the Santiago crater at Masaya during February 2021. Courtesy of INETER (Boletín Sismológico, Vulcanológico y Geológico Febrero, 2021). |
Seismicity continued in March, measuring between 200 and 250 RSAM units, as well as consistent gas-and-steam emissions. On 9 March SO2 measurements were an average of 1,423 tons/day. Temperature measurements were taken on 19 and 23 March; it had increased slightly to 903 °C, though the lava lake level remained low (figure 97). Landslides were observed on the E wall of the Santiago crater.
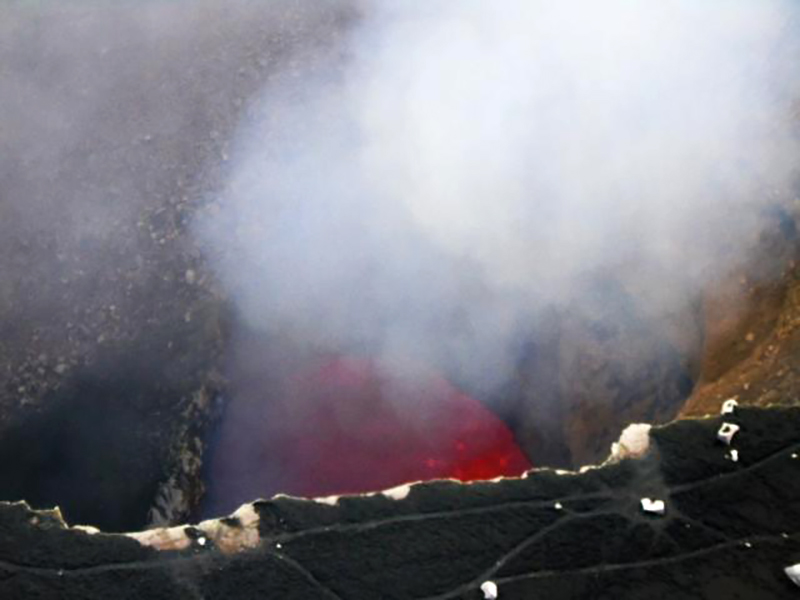 |
Figure 97. Photo of the lava lake in the Santiago crater at Masaya during March 2021. White gas-and-steam emissions accompanied the thermal activity. Courtesy of INETER (Boletín Sismológico, Vulcanológico y Geológico Marzo, 2021). |
During April the seismicity maintained 100-150 RSAM units; 14,505 small events were detected, seven of which were volcano-tectonic (VT), and the rest were LF events. New temperature measurements were taken on 8 and 9 April using thermal images and visual observations. The temperature had decreased to 797°C, which suggested that the level of the lava lake had also dropped. Collapses continued to be reported on the E crater wall. The lava lake level had increased, as well as the volume of high temperature volatiles, generating crater wall and crater floor collapses. The average SO2 values this month were 1,732 tons/day, higher than March.
Similar activity continued in May with 14,505 seismic events ranging 300-350 RSAM units, seven of which were VT events, and the rest being LF events. Temperature measurements taken on 3 May were 1,212.4°C, a significant 415°C increase compared to April (figure 98). Some internal wall collapses were reported on the S wall, as well as some subsidence as the lava lake levels declined (figure 99). On 11 and 15 May SO2 measurements were taken and were an average of 1,483 tons/day.
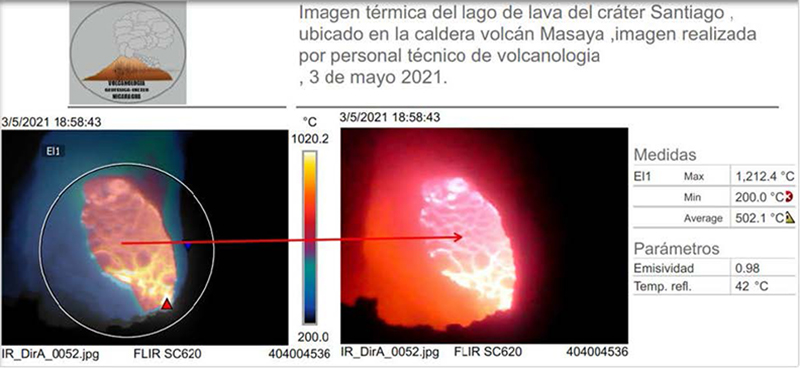 |
Figure 98. Thermal measurements of the active lava lake taken in the Santiago crater at Masaya on 3 May 2021 with a FLIR SC620 thermal camera. Temperatures reached up to 1,212.4°C. Courtesy of INETER (Boletín Sismológico, Vulcanológico y Geológico Mayo, 2021). |
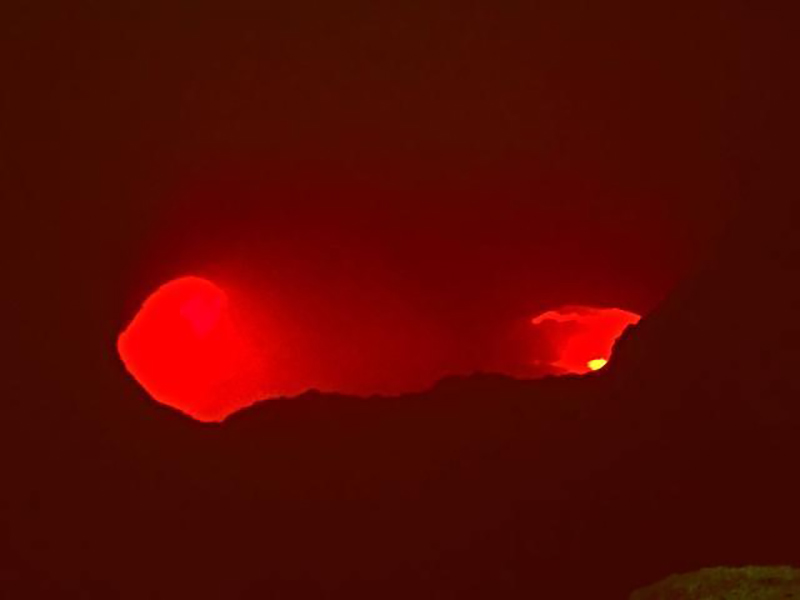 |
Figure 99. Photo of the active and incandescent lava lake at Masaya on 3 May 2021 taken from a distance of 80 m. Courtesy of INETER (Boletín Sismológico, Vulcanológico y Geológico Mayo, 2021). |
Geological Summary. Masaya volcano in Nicaragua has erupted frequently since the time of the Spanish Conquistadors, when an active lava lake prompted attempts to extract the volcano's molten "gold" until it was found to be basalt rock upon cooling. It lies within the massive Pleistocene Las Sierras caldera and is itself a broad, 6 x 11 km basaltic caldera with steep-sided walls up to 300 m high. The caldera is filled on its NW end by more than a dozen vents that erupted along a circular, 4-km-diameter fracture system. The Nindirí and Masaya cones, the source of observed eruptions, were constructed at the southern end of the fracture system and contain multiple summit craters, including the currently active Santiago crater. A major basaltic Plinian tephra erupted from Masaya about 6,500 years ago. Recent lava flows cover much of the caldera floor and there is a lake at the far eastern end. A lava flow from the 1670 eruption overtopped the north caldera rim. Periods of long-term vigorous gas emission at roughly quarter-century intervals have caused health hazards and crop damage.
Information Contacts: Instituto Nicaragüense de Estudios Territoriales (INETER), Apartado Postal 2110, Managua, Nicaragua (URL: http://www.ineter.gob.ni/); MIROVA (Middle InfraRed Observation of Volcanic Activity), a collaborative project between the Universities of Turin and Florence (Italy) supported by the Centre for Volcanic Risk of the Italian Civil Protection Department (URL: http://www.mirovaweb.it/); NASA Global Sulfur Dioxide Monitoring Page, Atmospheric Chemistry and Dynamics Laboratory, NASA Goddard Space Flight Center (NASA/GSFC), 8800 Greenbelt Road, Goddard, Maryland, USA (URL: https://so2.gsfc.nasa.gov/); Sentinel Hub Playground (URL: https://www.sentinel-hub.com/explore/sentinel-playground).