Report on Nishinoshima (Japan) — October 2021
Bulletin of the Global Volcanism Network, vol. 46, no. 10 (October 2021)
Managing Editor: Edward Venzke.
Edited by Kadie L. Bennis.
Nishinoshima (Japan) Ash eruptions during 14-15 August 2021
Please cite this report as:
Global Volcanism Program, 2021. Report on Nishinoshima (Japan) (Bennis, K.L., and Venzke, E., eds.). Bulletin of the Global Volcanism Network, 46:10. Smithsonian Institution. https://doi.org/10.5479/si.GVP.BGVN202110-284096
Nishinoshima
Japan
27.247°N, 140.874°E; summit elev. 100 m
All times are local (unless otherwise noted)
Nishinoshima is a small island located about 1,000 km S of Tokyo in the Ogasawara Arc in Japan. Historical eruptions date back to 1973, with more recent activity including brief eruptions in 2017 and 2018, ash plumes, incandescent ejecta, and lava flows during December 2019 through August 2020 (BGVN 45:09 and BGVN 46:02). This report covers activity during February through September 2021, including ash emissions during 14-15 August, using information from the Japan Meteorological Agency (JMA) monthly reports, the Japan Coast Guard (JCG), which makes regular observation overflights, the Tokyo Volcano Ash Advisory Center, and satellite data.
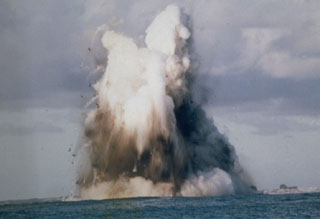
The last reported activity at the volcano occurred during August 2020, when ash emissions were observed but lava flows had stopped and were cooling (BGVN 46:02). Since then, JMA has reported that gas-and-steam emissions, and high temperatures, have persisted in the summit crater. Occasional brownish to yellowish discoloration has been visible in the water along the coasts of the island, as shown on 23 February 2021 (figure 112). Intermittent gas-and-steam emissions and high temperatures persisted in the summit crater during the reporting period (figure 113). The Japan Coast Guard conducted an overflight on 9 July during which gas-and-steam emissions and yellowish-brown discolored water were observed within about 2 km from the SW to the W side of the island.
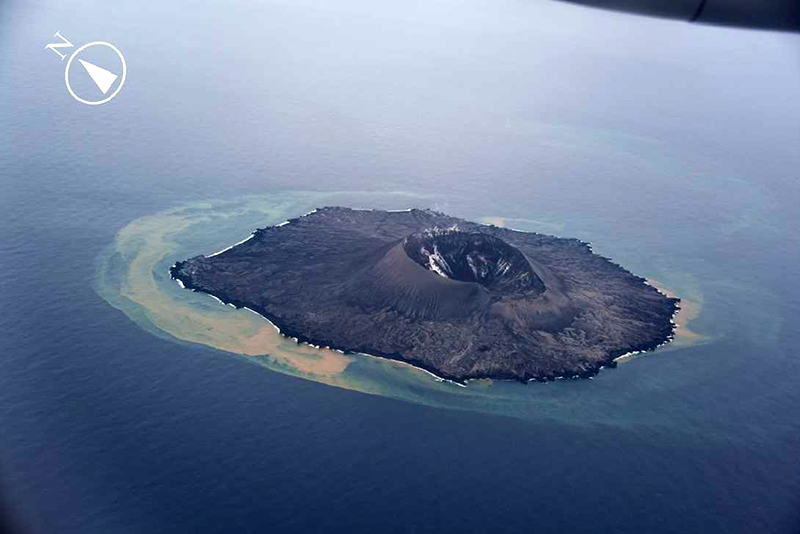 |
Figure 112. Aerial photo from the Japan Coast Guard showing brownish and yellowish discolored water around Nishinoshima on 23 February 2021. Courtesy of JMA (monthly report of activity at Nishinoshima, February 2021). |
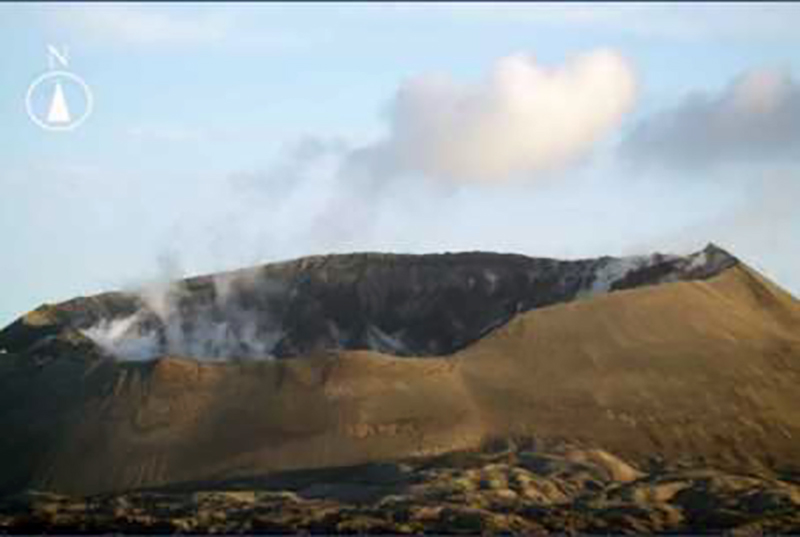 |
Figure 113. Photo from the Japan Coast Guard showing white gas-and-steam emissions rising from the inner wall of the Nishinoshima summit crater and the northern crater rim on 28 May 2021. Courtesy of JMA (monthly report of activity at Nishinoshima, June 2021). |
Ash plumes were detected in HIMAWARI satellite images on 14 August at 0600 rising to 1.9 km altitude and drifted N. Overflights by the Japan Coast Guard on 5, 15, and 16 August did not reveal additional eruptive activity or new deposits, though gas-and-steam emissions and high temperatures were still recorded in the central crater floor, inner wall, and crater rim. They also reported that the central crater floor and N part of the pyroclastic cone had sunk significantly on the 16th compared to observations made on the 5th. Yellowish-green discolored water was observed around the island, as well as brownish water on the S, SE, and SW coasts. The Tokyo VAAC issued a notice that described a period of continuous ash emissions on 15 August, based on satellite data. On 26 August the Japan Coast Guard conducted another overflight and detected gray and white gas-and-steam plumes, in addition to discolored water on the E, W, S, and SW coasts (figure 114). Persistent brown and white gas-and-steam emissions and high temperatures continued to be detected during September.
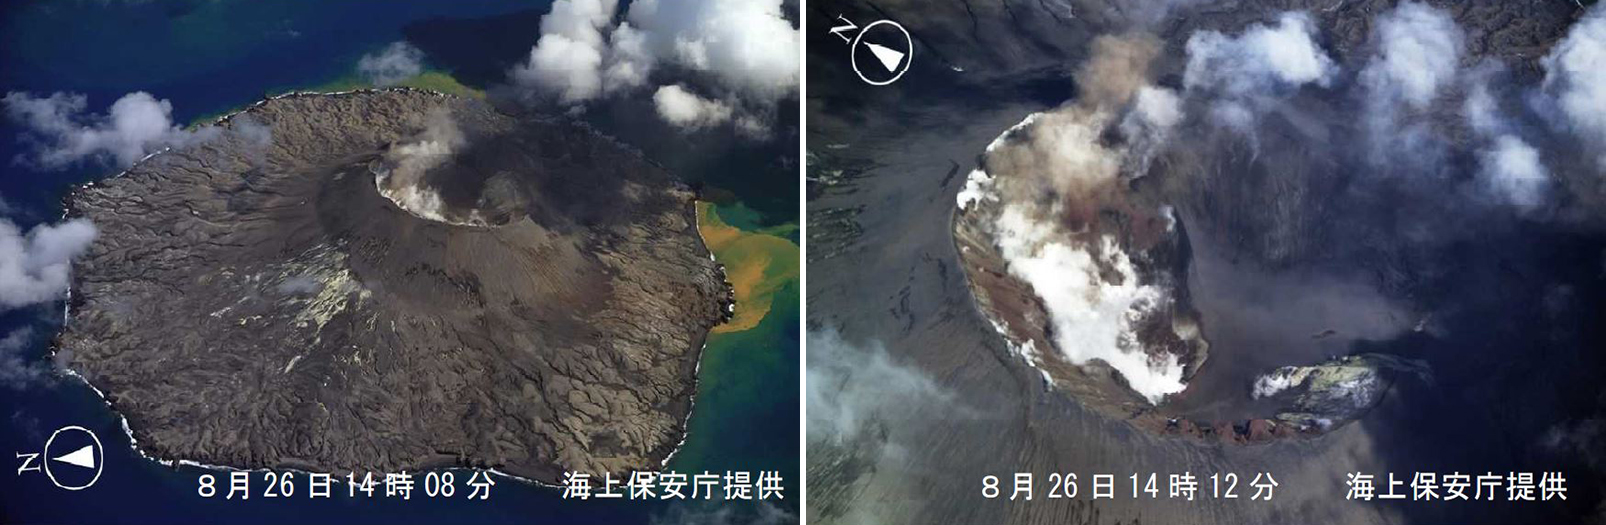 |
Figure 114. Aerial photos of the summit crater of Nishinoshima showing brown and white gas-and-steam emissions accompanied by discolored water on 26 August 2021 at 1408 (left) and 1412 (right). Taken by the Japan Coast Guard. Courtesy of JMA (monthly report of activity at Nishinoshima, September 2021). |
According to the MIROVA plot (Log Radiative Power), low-power thermal anomalies were detected infrequently during February through June, with some higher signatures during May. By early July, thermal activity increased in both frequency and strength and persisted through September, with a brief break during early August (figure 115). A single MODVOLC thermal alert was detected on 4 September.
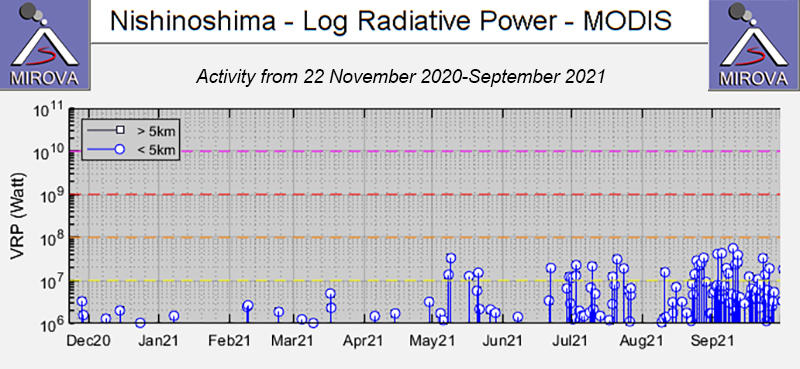 |
Figure 115. MIROVA (Log Radiative Power) graph shows infrequent thermal anomalies during February-June 2021; the thermal anomalies increased in frequency and strength in July and mid-August through September. Courtesy of MIROVA. |
Geological Summary. The small island of Nishinoshima was enlarged when several new islands coalesced during an eruption in 1973-74. Multiple eruptions that began in 2013 completely covered the previous exposed surface and continued to enlarge the island. The island is the summit of a massive submarine volcano that has prominent peaks to the S, W, and NE. The summit of the southern cone rises to within 214 m of the ocean surface 9 km SSE.
Information Contacts: Japan Meteorological Agency (JMA), 1-3-4 Otemachi, Chiyoda-ku, Tokyo 100-8122, Japan (URL: http://www.jma.go.jp/jma/indexe.html); Japan Coast Guard (JCG) Volcano Database, Hydrographic and Oceanographic Department, 3-1-1, Kasumigaseki, Chiyoda-ku, Tokyo 100-8932, Japan (URL: https://www1.kaiho.mlit.go.jp/GIJUTSUKOKUSAI/kaiikiDB/kaiyo18-e1.htm); Tokyo Volcanic Ash Advisory Center (VAAC), 1-3-4 Otemachi, Chiyoda-ku, Tokyo 100-8122, Japan (URL: http://ds.data.jma.go.jp/svd/vaac/data/); MIROVA (Middle InfraRed Observation of Volcanic Activity), a collaborative project between the Universities of Turin and Florence (Italy) supported by the Centre for Volcanic Risk of the Italian Civil Protection Department (URL: http://www.mirovaweb.it/); Hawai'i Institute of Geophysics and Planetology (HIGP) - MODVOLC Thermal Alerts System, School of Ocean and Earth Science and Technology (SOEST), Univ. of Hawai'i, 2525 Correa Road, Honolulu, HI 96822, USA (URL: http://modis.higp.hawaii.edu/).