La Palma
Spain
28.57°N, 17.83°W; summit elev. 2426 m
All times are local (unless otherwise noted)
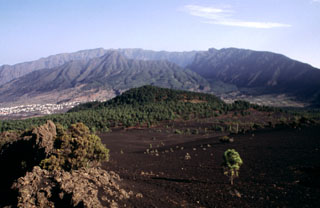
Multiple eruptions have occurred during the last 7,000 years at the Cumbre Vieja volcanic center on La Palma, the NW-most of the Canary Islands. The eruptions have created cinder cones and craters, and produced fissure-fed lava flows that reached the sea a number of times. Eruptions recorded since the 15th century have produced mild explosive activity and lava flows that damaged populated areas, most recently at the southern tip of the island in 1971. During the three-week eruption in October-November 1971, eruptive activity created a new cone, Teneguia, that had as many as six active vents (CSLP 90-71), and blocky lava flows that reached the sea on the SW flank.
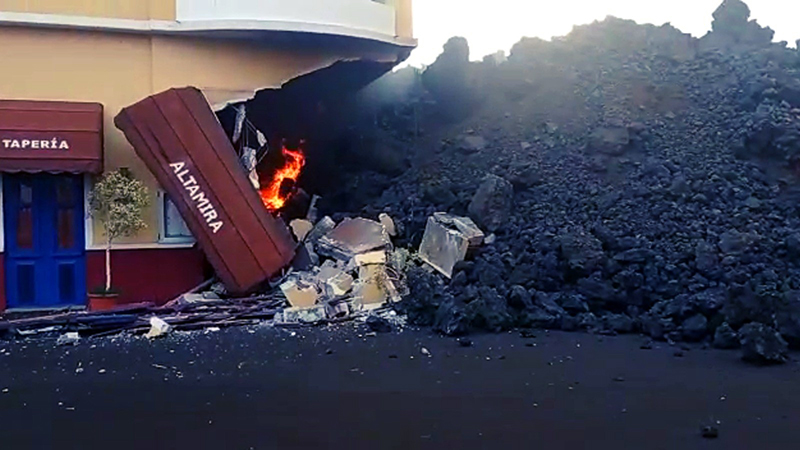
A new eruption began at La Palma on 19 September 2021 in an area on the SW flank of the island about 20 km NW of the 1971 eruption, after a multi-year period of elevated seismicity. Two fissures opened and multiple vents produced lava fountains, ash plumes, and flows that traveled over 5 km W to the sea, destroying hundreds of properties in their path (figure 2). Activity through the end of September is covered in this report with information provided by Spain’s Instituto Geographico Nacional (IGN), the Instituto Volcanologico de Canarias (INVOLCAN), the Steering Committee of the Special Plan for Civil Protection and Attention to Emergencies due to Volcanic Risk (PEVOLCA), maps from Copernicus EMS, satellite data, and news and social media reports.
Precursor seismicity. In early July 2017 IGN enhanced their Volcanic Surveillance Network at La Palma to include four GPS antennas, five seismic stations, and four hydrochemical groundwater control points. A seismic swarm of 68 events located on the southern third of the island was recorded during 7-9 October 2017. It was the first of a series of seismic swarms recorded during 2017-2021 (table 1) located in the same general area. This first swarm was followed by a similar set of events a few days later during 13-14 October. The magnitudes of the events during October 2017 (given as MbLg, or the magnitude from the amplitude of the Lg phase, similar to the local Richter magnitude) ranged from less than 1.5 to 2.7, and they occurred over a depth range of 12-35 km. The next seismic swarm of similar characteristics occurred during February 2018, followed by a smaller swarm of seven microseismic events recorded in the same area one year later, on 12 February 2019.
Table 1. Precursor seismicity episodes at La Palma between October 2017 and late June 2021 were all located in the southern third of the island. Magnitude is reported by IGN as MbLg, or the magnitude from the amplitude of the Lg phase, similar to the local Richter magnitude. Data courtesy of IGN Noticias.
| Date |
Detected Events |
Located Events |
Magnitude Range (mbLg) |
Depth Range (km) |
| 07-09 Oct 2017 |
-- |
68 |
Less than 1.5-2.7 |
12-35 |
| 13-14 Oct 2017 |
352 |
44 |
Less than 1.5-2.1 |
15-22 |
| 10-14 Feb 2018 |
-- |
85 |
1.8-2.6 |
25-30 |
| 12 Feb 2019 |
-- |
7 |
0.7-1.1 |
15 |
| 24 Jul-02 Aug 2020 |
682 |
160 |
1.2-2.5 |
16-39 |
| 23-26 Dec 2020 |
602 |
126 |
1.3-2.3 |
30 |
| 31 Jan 2021 |
-- |
27 |
1.2-2.5 |
10-29 |
| 25 Jun 2021 |
80 |
12 |
Less than 2.2 |
18-34 |
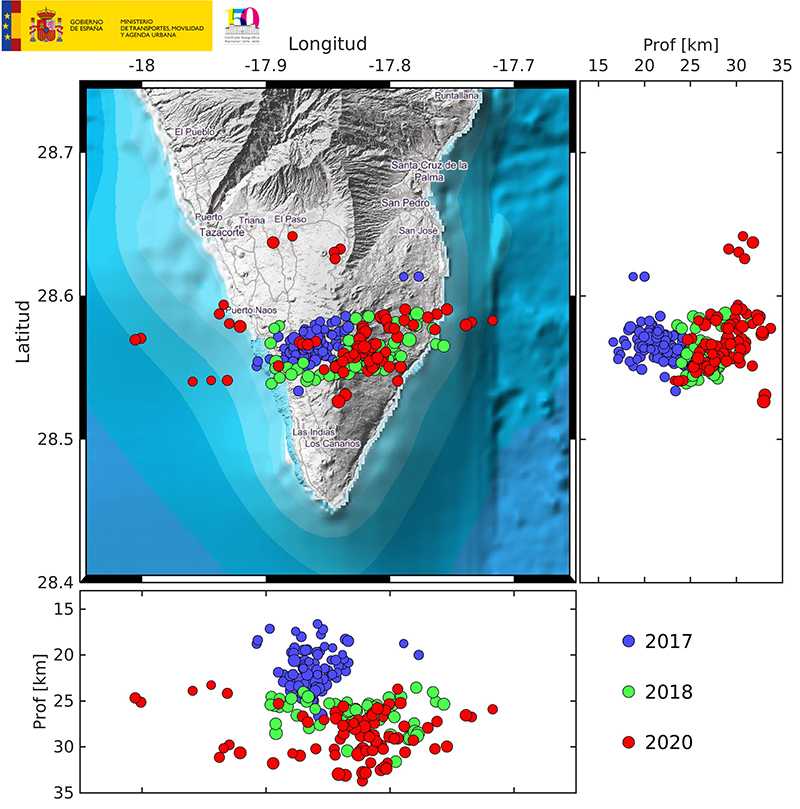
By the time the next seismic swarm began in July 2020, IGN had a network of 13 seismic stations installed around the island. There were 160 located events that occurred during 24 July-2 August 2020 with magnitudes of 1.2-2.5 and depths of 16-39 km. Reprocessing of the previous data indicated a distribution of seismicity for the three series (October 2017, February 2018, and July 2020) in a wide strip in an east-west direction, although the October 2017 series occurred at a shallower depth and with the epicenters more concentrated. IGN noted similarities between the February 2018 and July-August 2020 events in terms of location and magnitude (figure 3). Another very similar swarm of 602 detected events was recorded during 23-26 December 2020, with most events located on the western slope of Cumbre Vieja. Two swarms on 21 January and 25 June 2021 had fewer events but similar depths and magnitudes to the earlier events.
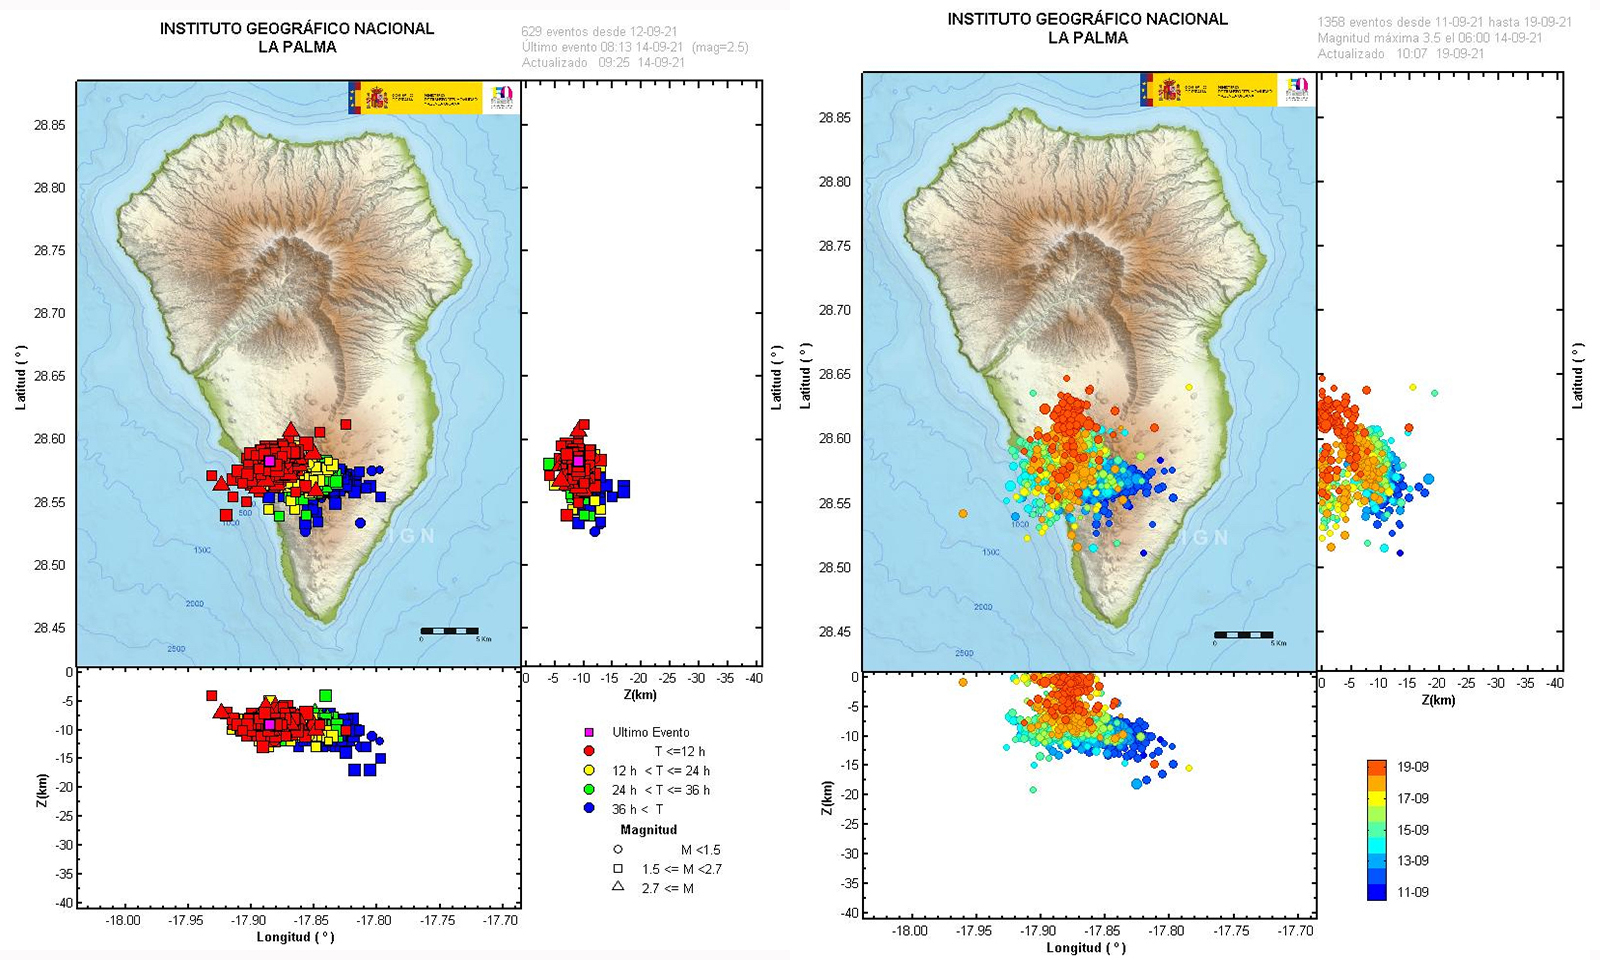
Renewed seismicity began on 11 September 2021. The number, frequency, and magnitude of the events all increased over the next several days, while the depth of the events grew shallower. On 13 September a multi-agency scientific committee raised the Alert Level to Yellow (the second lowest level on a four-color scale) for the municipalities of El Paso, Los Llanos de Aridane, Mazo, and Fuencaliente de la Palma. IGN noted a migration of the seismicity toward the W side of the island on 14 September (figure 4). The accumulated surface deformation between 12 and 14 September measured 1.5 cm from the island GNSS network. Seismic activity on 15 September continued to migrate slightly NW at depths of around 7-9 km; in addition, 20 shallow earthquakes of 1-3 km depth were recorded. The accumulated deformation had reached 6 cm by 15 September. As of 0930 on 16 September 50 shallow earthquakes between 1-5 km depth had been located and the maximum vertical deformation was around 10 cm in the area of the seismicity. During 16-18 September seismic activity decreased, but a 3.2 magnitude earthquake located at 100 m depth was felt by the local population. Intense surface seismicity (between 0-6 km) increased in the early hours of 19 September and numerous earthquakes were felt by the local population (figure 4). The maximum accumulated deformation increased to 15 cm in the area close to the seismicity by 1100 on 19 September, and the eruption began about five hours later.
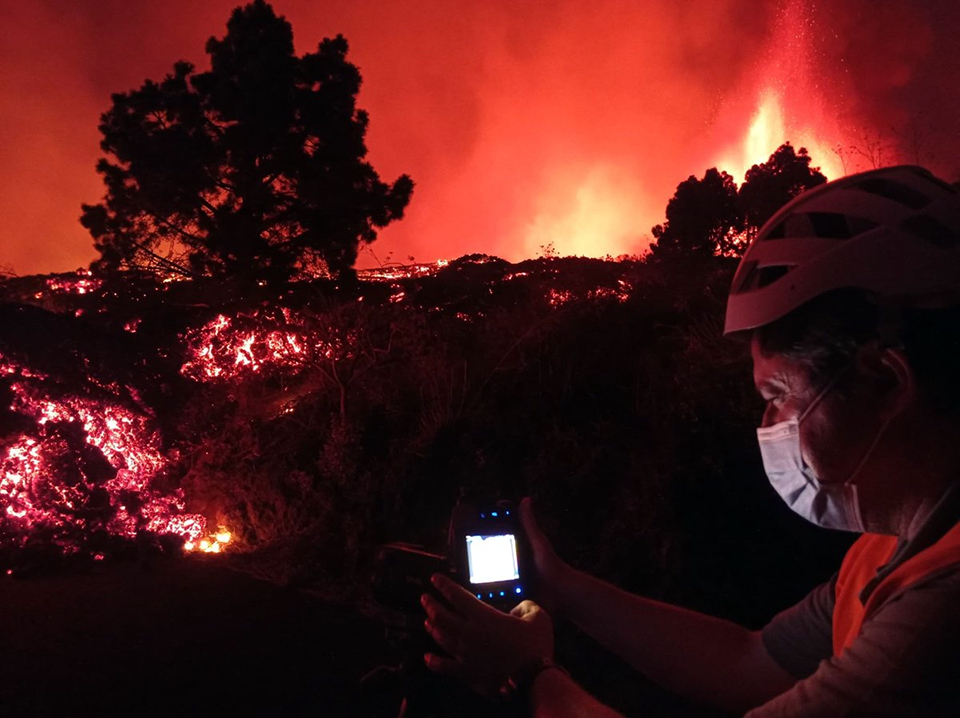
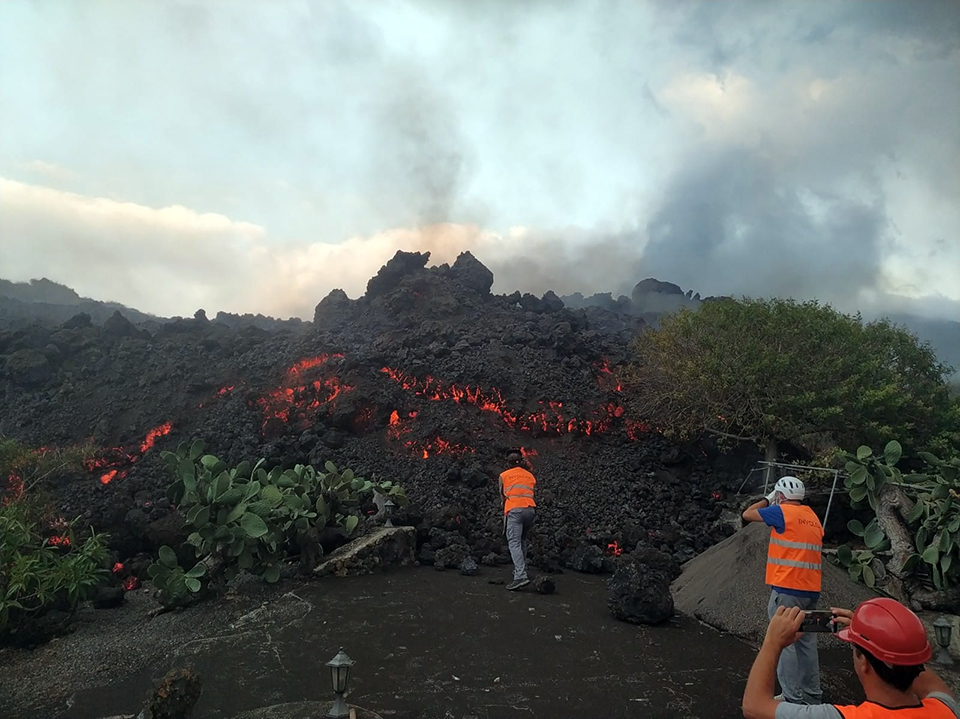
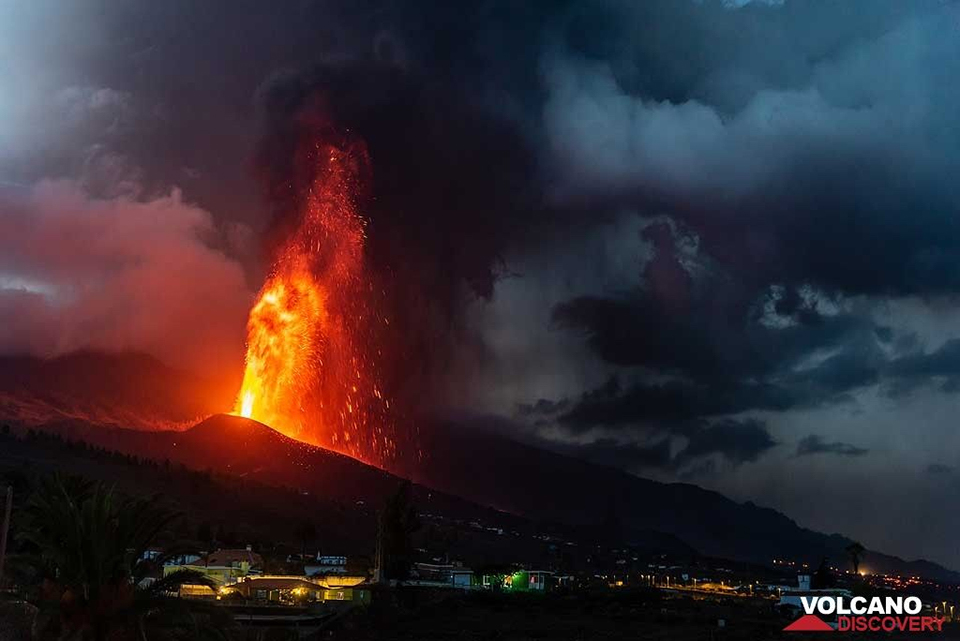
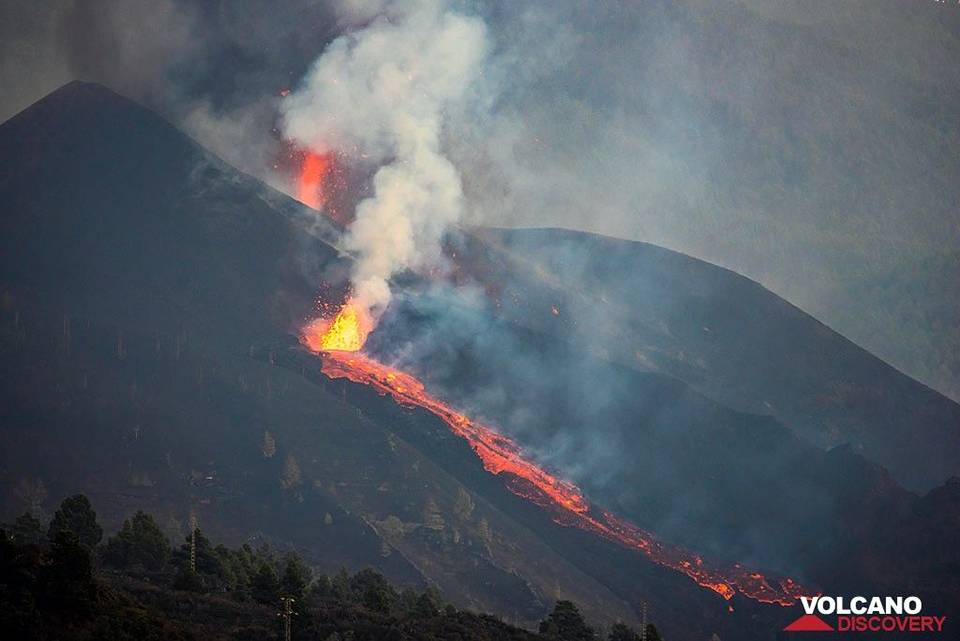
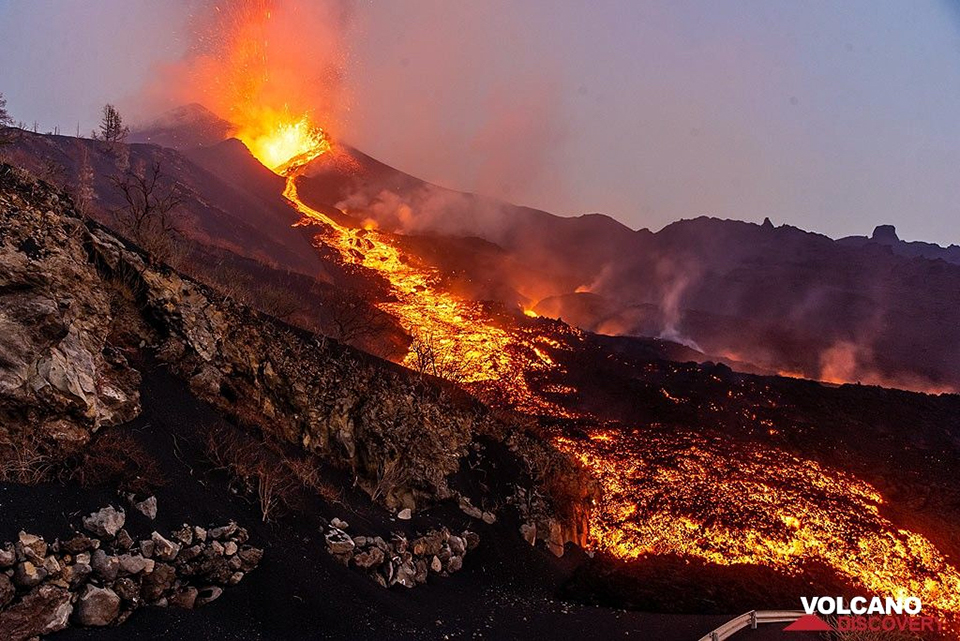
Eruption begins 19 September 2021. A fissure eruption began at 1510 local time (1410 UTC) on 19 September after the intense seismic and deformation activity that began on 11 September. Observers near the eruption site in the area of Cabeza de Vaca, in the municipality of El Paso, witnessed a large explosion with ejecta that produced a gas-and-ash plume. Strombolian activity was accompanied by phreatomagmatic pulses along two 100-m-long N-S fissures about 200 m apart. INVOLCAN scientists observed seven vents along the fissures during the initial stage of the eruption (figure 5). Multiple tall lava fountains fed flows downslope to the W, igniting fires. The PEVOLCA steering committee briefly raised the Alert Level to Orange, and then to Red by 1700 for high-risk municipalities directly affected by the eruption. About 5,500 people evacuated with no injuries reported, and authorities recommended that residents stay at least 2 km from the vents. INVOLCAN scientists determined an average flow rate of 700 m/hour and lava temperatures of around 1,075°C at the start of the eruption (figure 6).
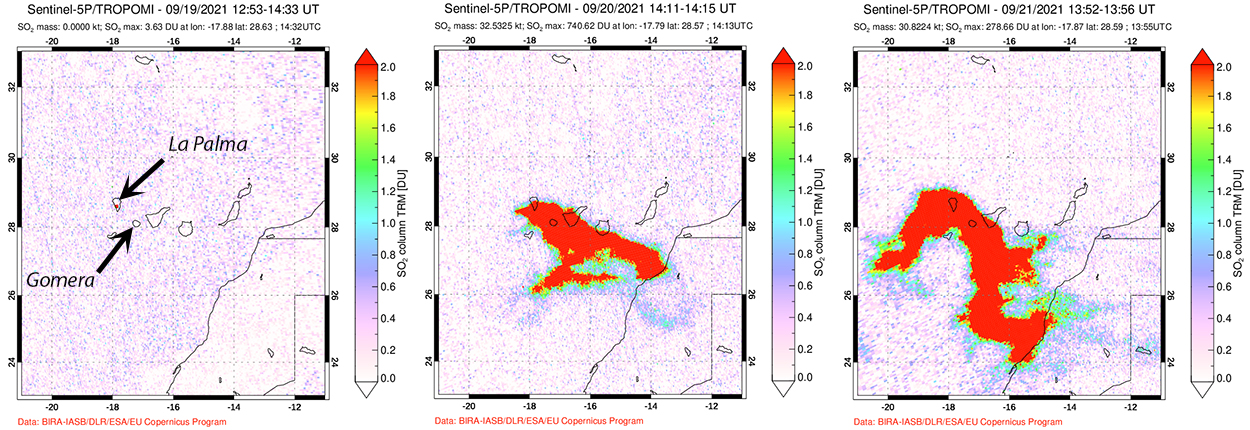
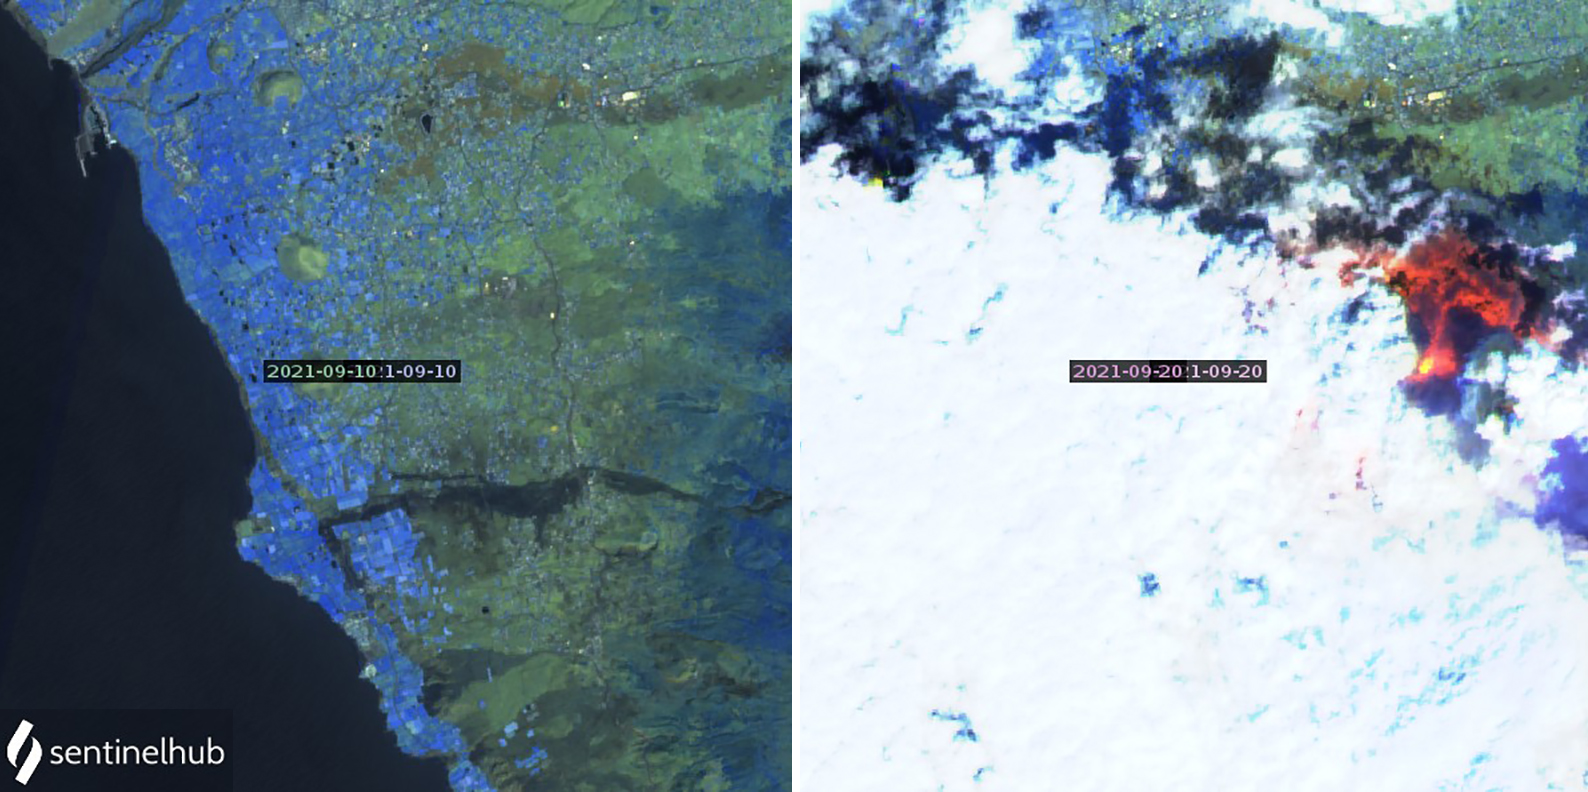
The Toulouse VAAC issued the first ash advisory for the La Palma eruption about 90 minutes after it began. They reported ongoing lava fountains and an ash plume to about 1 km altitude. The plume drifted SW at less than 1.5 km altitude, while SO2 emissions were reported drifting ESE at 3 km altitude. Later that day, they noted continuing intense lava fountains and ashfall in the vicinity of the volcano. The next day ash emissions drifted S at 2.4 km altitude. Sulfur dioxide emissions were measured by satellite instruments beginning on 19 September; they increased dramatically and drifted hundreds of kilometers E and SE toward the NE coast of Africa over the next few days (figure 7). Ongoing ash emissions rose to 4.6 km altitude later on 20 September. The first Sentinel-2 satellite images of the eruption appeared on 20 September showing a strong point source thermal anomaly partly covered by meteoric clouds (figure 8).
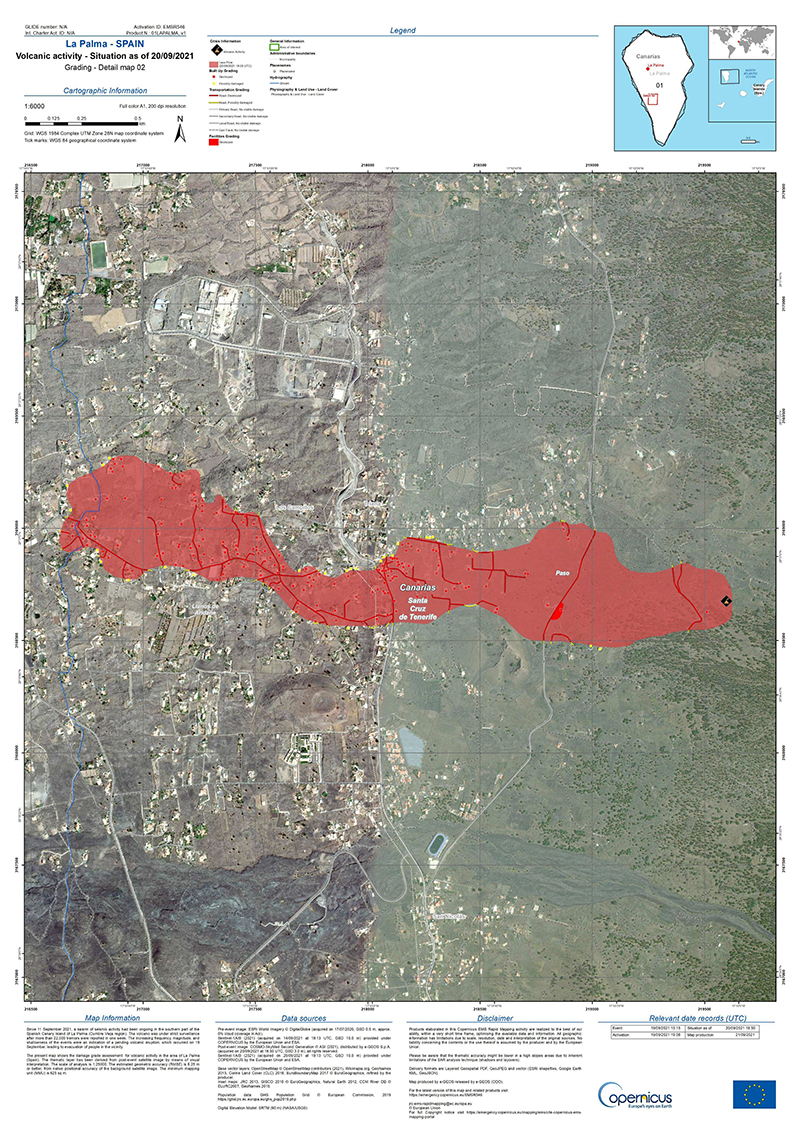
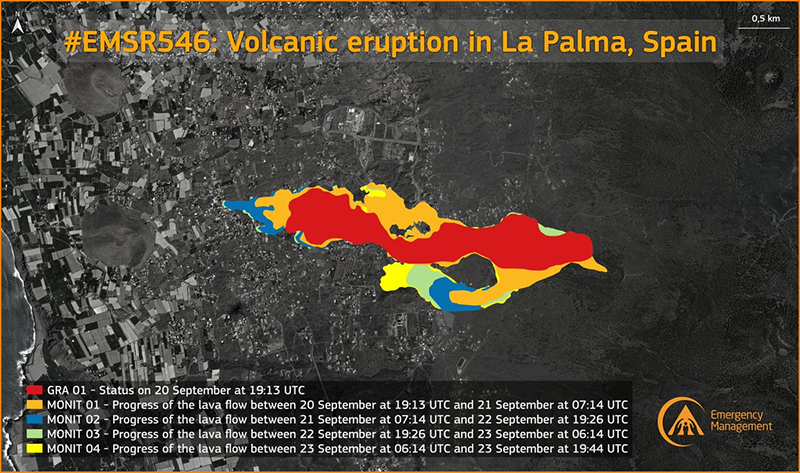
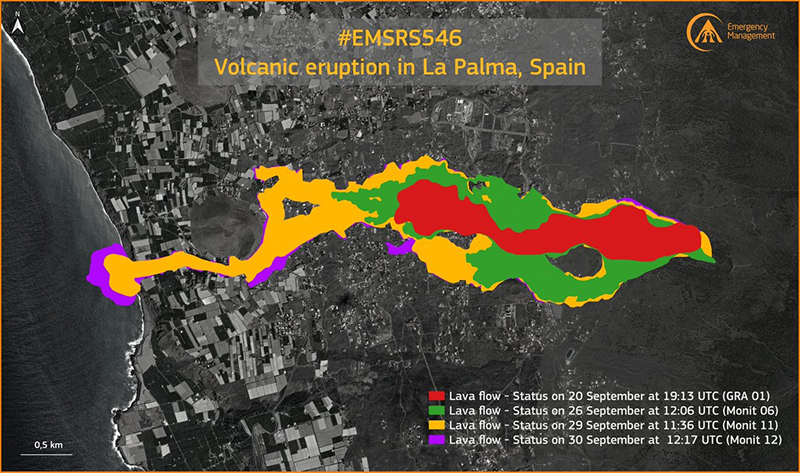
The first map of the new flow on 20 September produced by IGN in partnership with Copernicus Emergency Management Service (EMS) showed that the main channel of the lava flow had traveled more than 3 km W. The flows had covered about 1 km2 and destroyed an estimated 166 buildings (figure 9). A report of the PEVOLCA Scientific Committee indicated that activity on 20 and 21 September was concentrated at four main vents that produced parallel flows with an average flow rate of 200 m/hour; the maximum flow thickness was 10-12 m (figure 10). Strong lava fountaining continued both days and ash fell in the vicinity of the vents. By 0814 on 21 September an updated Copernicus EMS map showed that 350 homes had been covered by lava and the flow field had expanded to 1.54 km2. A few hundred more residents evacuated as lava advanced towards Tacande; bringing the number of evacuees to about 5,700. One lava flow branch was advancing slowly S at a rate of 2 m/hour. An ash cloud was observed later that day on the W flank of the volcano slowly drifting SW at 2.4 km altitude. Sulfur dioxide emissions were present over the SE part of the island and were visible at Gomera Island, 80 km SE. Late in the day, ash was observed in satellite imagery about 50 km W of the volcano, while intense lava fountaining continued at the source vent (figure 11).
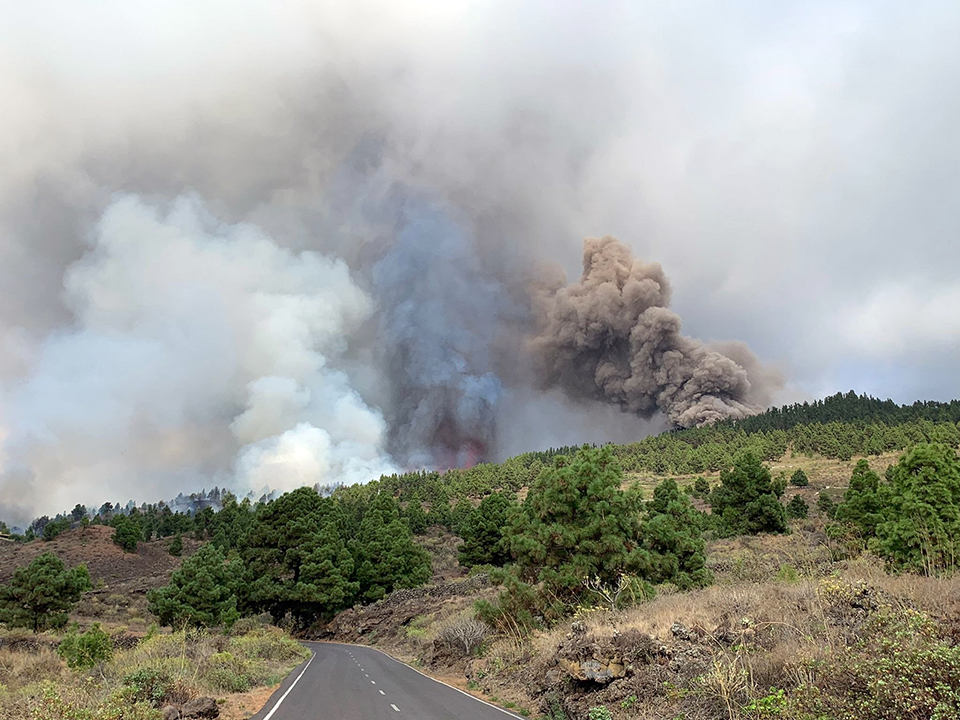
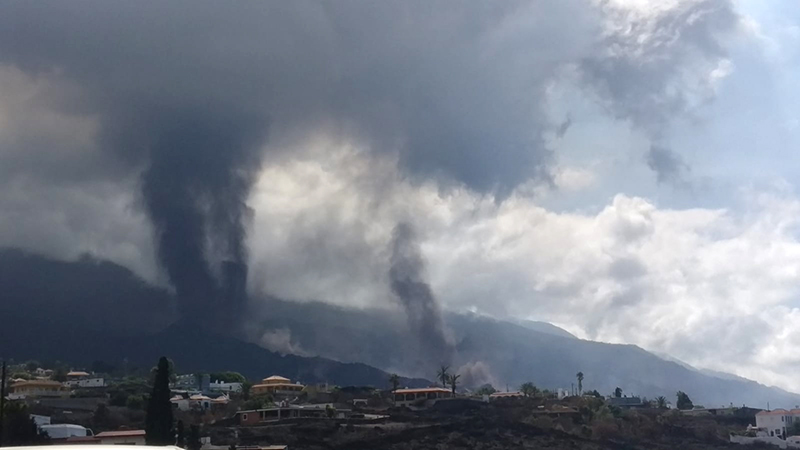
Activity during 22-25 September 2021. Ash emissions during 22 and 23 September drifted SW and S from 0-3 km altitude, and NE and E from 3-5 km altitude (figure 12); ashfall up to 3 cm thick was reported downwind. An SO2 plume was also noted drifting NE in satellite imagery. PEVOLCA reported on 23 September that two relatively slow-moving lava flows continued to advance downslope from the vent (figure 13). The northernmost flow was moving at 1 m/hour and was 12 m high and 500 m wide in some places. The southern flow, which surrounded Montaña Rajada, was moving at 4-5 m/hour and about 10 m high. The overall flow was 3.8 km long and 2.1 km from the coast (figure 14). By late on 23 September reports indicated 420 structures had been destroyed and the flow covered just under 2 km2.
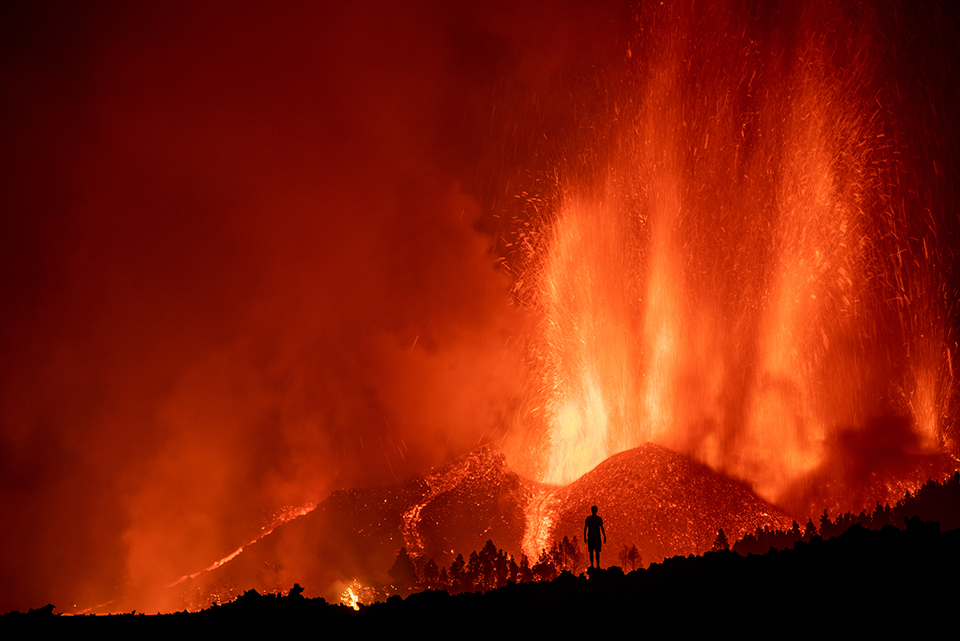
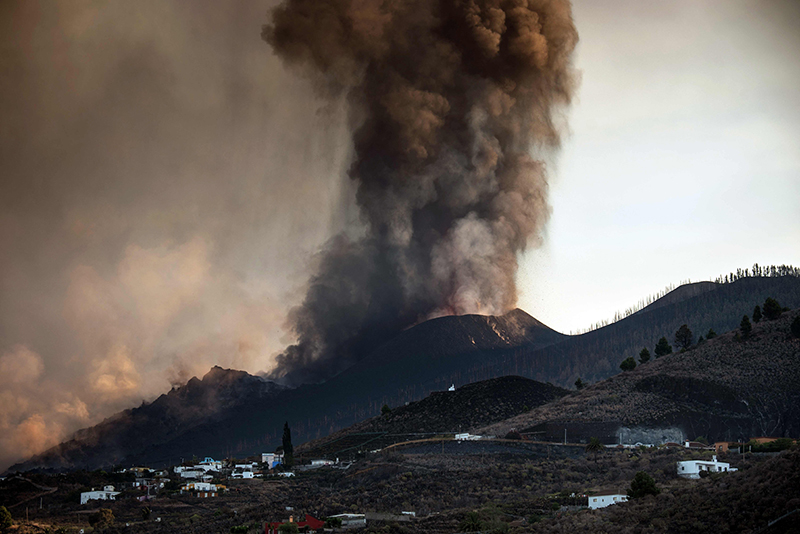
Lava fountains rose hundreds of meters above the summit crater of the new cone early on 24 September 2021 (figure 15). IGN reported an increase in explosive activity on 24 September that was accompanied by a sharp increase in tremor amplitude. This was followed a short while later by the opening of two new vents on the NW flank of the cone; the fast-moving flows merged into one and produced a new flow over top of the earlier flows. Part of the upper section of the S flank of the cone collapsed on 24 September and briefly caused flow speeds to increase to 250-300 m/hour overnight before slowing to an average speed of 40 m/hour. Due to the fast-moving flow, an evacuation order was issued in the early afternoon for Tajuya, Tacande de Abajo, and part of Tacande de Arriba, affecting 300-400 people. Three airlines also suspended flights to La Palma. The Toulouse VAAC reported ash plumes throughout the day. Ash plumes drifted SW below 3 km altitude and E and SE at 3-5.2 km altitude and resulted in significant ashfall in numerous locations by the next morning (figure 16). Pilots also reported ash near Tenerife and over La Gomera.
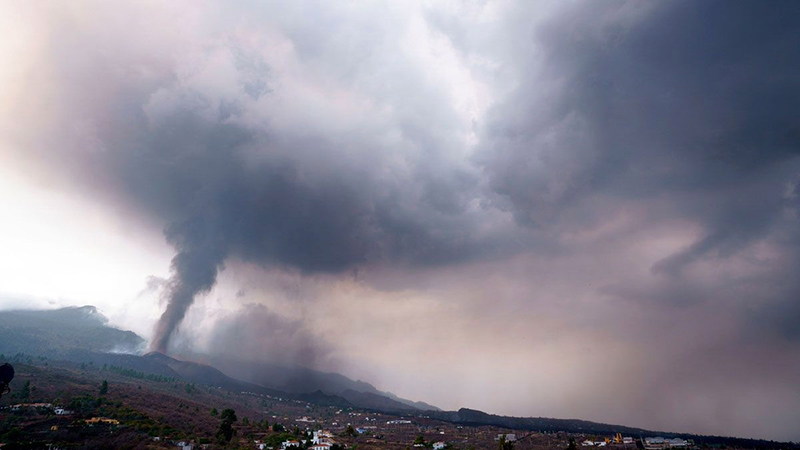
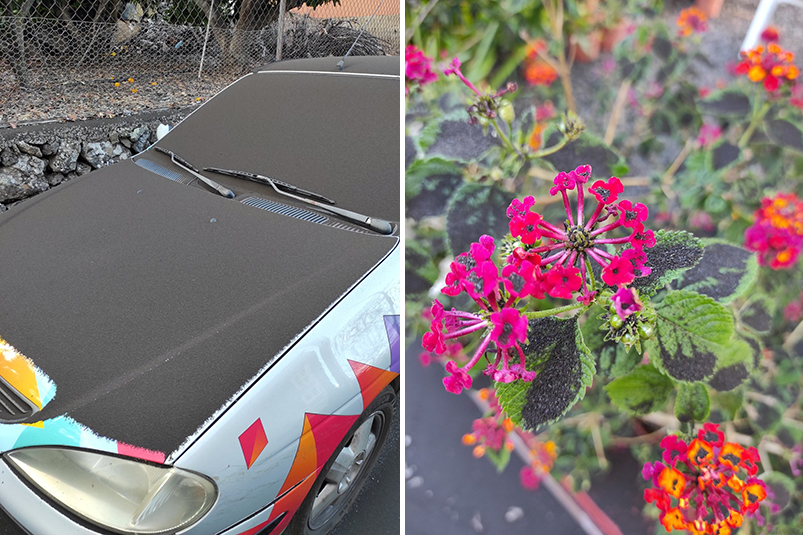
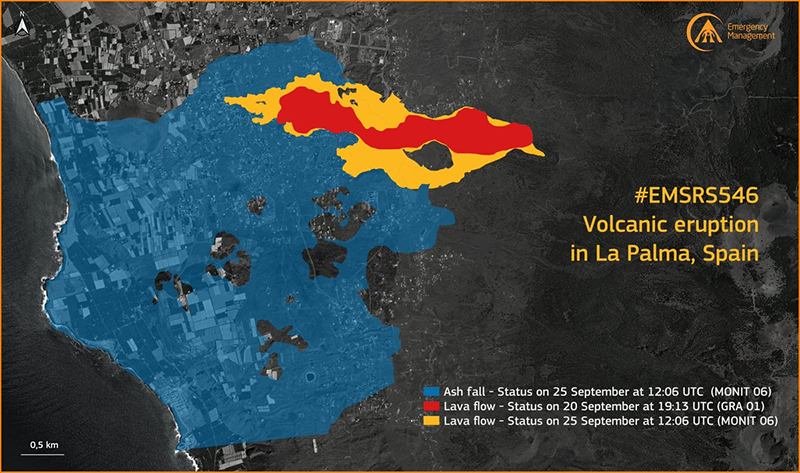
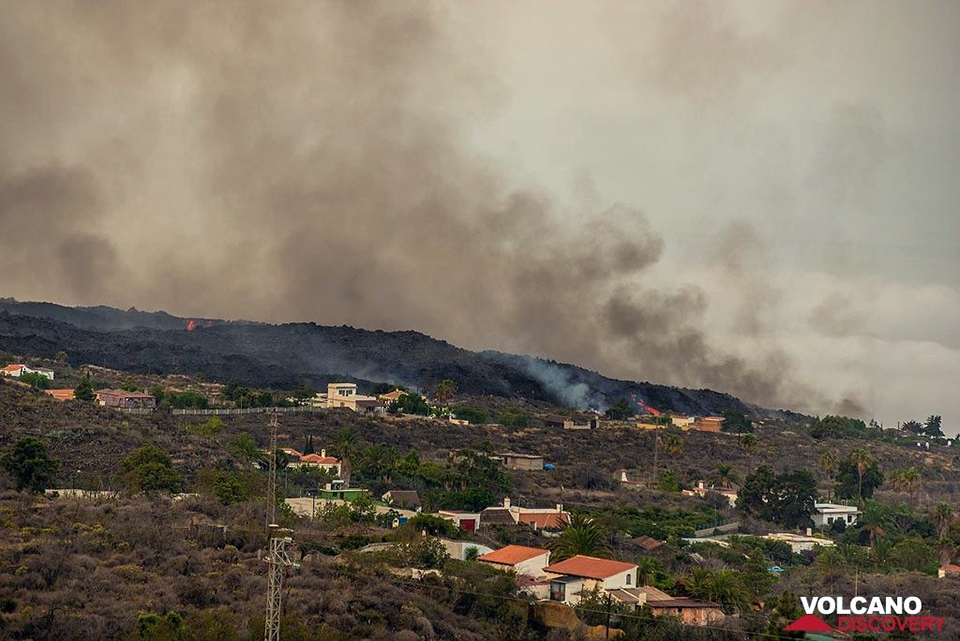
By 25 September there were three active vents in the crater and one on the flank of the cone (figure 17), and two active lava flows. On 25 and 26 September dense ash emissions (figure 18) closed the airport and produced ashfall not only in the municipalities near the eruption, but also on the eastern slope of the island; it was reported in Villa de Mazo, Breña Alta and Breña Baja, and Santa Cruz de La Palma or Puntallana. Plumes were drifting SW at altitudes below 1.5 km and NE between 1.5 and 3.9 km altitude over a large area. Mapping by Copernicus EMS indicated that the ashfall covered an area of 13 km2 (figure 19).
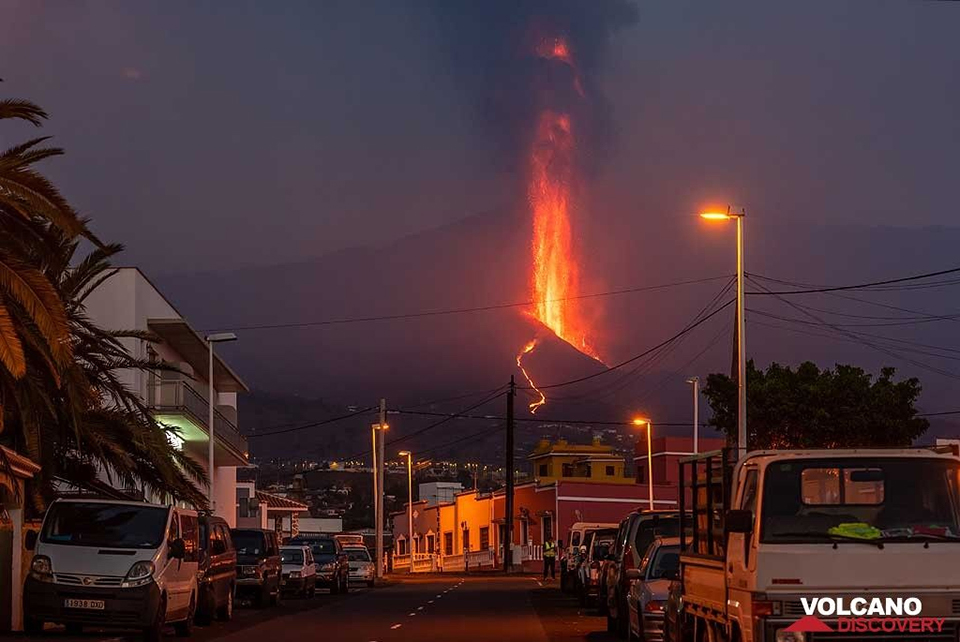
Activity during 26-28 September 2021. During the evening of 26 September jets of lava up to 1 km high were visible from La Laguna and some explosions were strong enough to be felt within 5 km of the vent (figure 20). The main, more northerly lava flow overtook the center of Todoque, in the municipality of Los llanos de Aridane, which had been evacuated several days earlier. It crossed the highway (LP-213) in the center of town and continued 150 m W. It was initially moving at about 100 m/hour, was 4-6 m high, and the front was about 600 m wide, but it slowed significantly after crossing through Todoque, and the height grew to 15 m; it was located about 1,600 m from the coast. The more southerly flow continued moving at about 30 m/hour and was about 2.5 km long.
The PEVOLCA Scientific Committee determined that the volume of erupted material from the beginning of the eruption on 19 September until 27 September was about 46.3 m3. By early on 27 September the front of the flow was close to the W side of Todoque Mountain (figure 21), and reports indicated that 589 buildings and 21 km of roads had been destroyed by the 2.5 km2 of lava. A seismic swarm on the morning of 27 September was located at about 10 km depth in the same area of the previous seismicity below the vent. In addition, pulses of tremor coincided with pulses of ash emissions. A new flow appeared on the N flank of the cone during the afternoon and partly covered previous flows through the center of Todoque, reaching about 2 km from the coast (figure 22). Ash emissions were more intermittent on 27 and 28 September, drifting SW to 1.5 km altitude and NE to 4.3 km altitude in sporadic pulses associated with lava fountains.
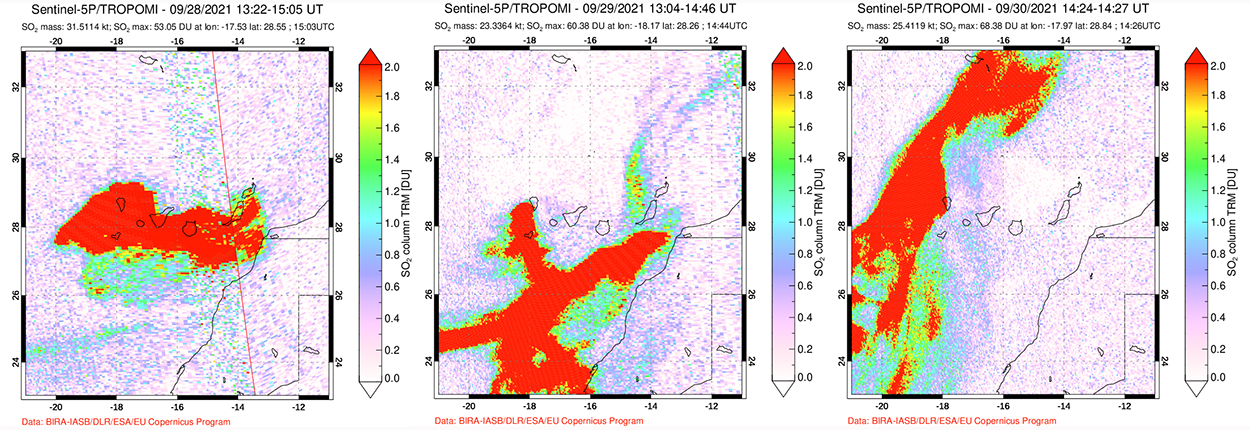
The new flow moved through the upper outskirts of Todoque and had reached the road to El Pampillo on the border of the municipalities of Los Llanos and Tazacorte, about 1 km from the coast, early on 28 September (figure 23). A plume with moderate to high ash concentration rose to 5.2 km altitude and extended up to 25 km W. The altitude of the plume increased to 6.1 km drifting E later in the day. A significant SO2 cloud was clearly identifiable in satellite imagery in a 75 km radius around the island. In addition, satellite instruments measured very large plumes of SO2 drifting hundreds of kilometers E, S, and N over the next several days (figure 24).
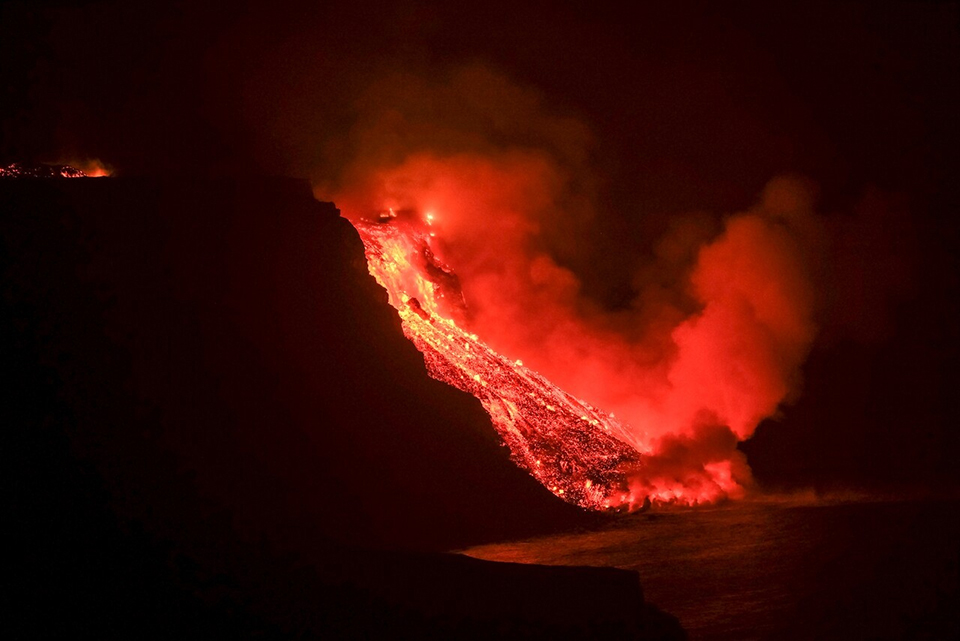
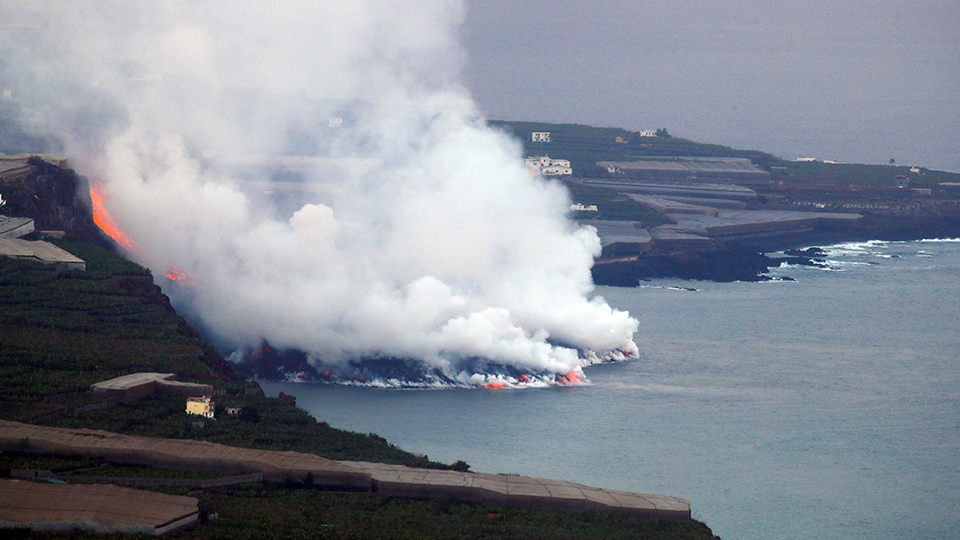
Activity during 28-30 September 2021. Effusive activity continued with a sharp decrease in tremor during the day on 28 September. By evening, sustained fountaining was continuing at the N flank vent, while pulsating jets from three vents within the main crater produced strong effusion into both lava flows. The volume of the cone that had formed at the vent was estimated by PEVOLCA to be 10 million m3. Around 2300 local time on 28 September the main lava flow passed on the S side of Todoque Mountain and entered the sea in the area of Playa de Los Guirres in Tazacorte. A continuous cascading flow of lava fell over the cliff (figure 25) and began to form a lava delta. By dawn on 29 September the delta was growing out from the cliff, producing dense steam explosions where the lava entered the sea (figure 26).
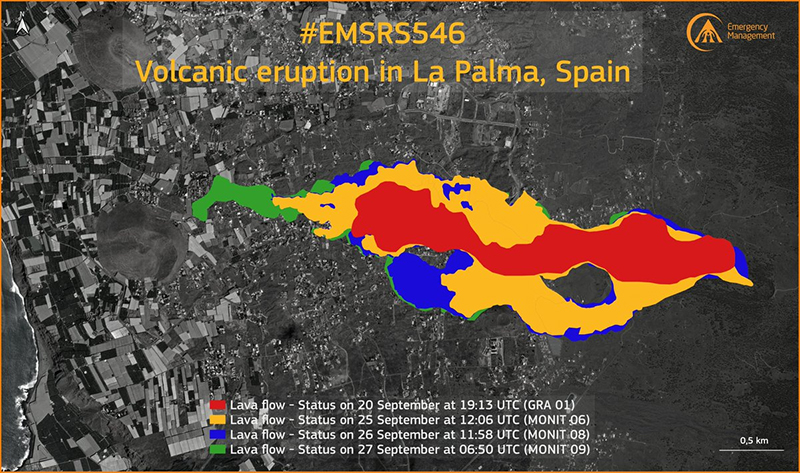
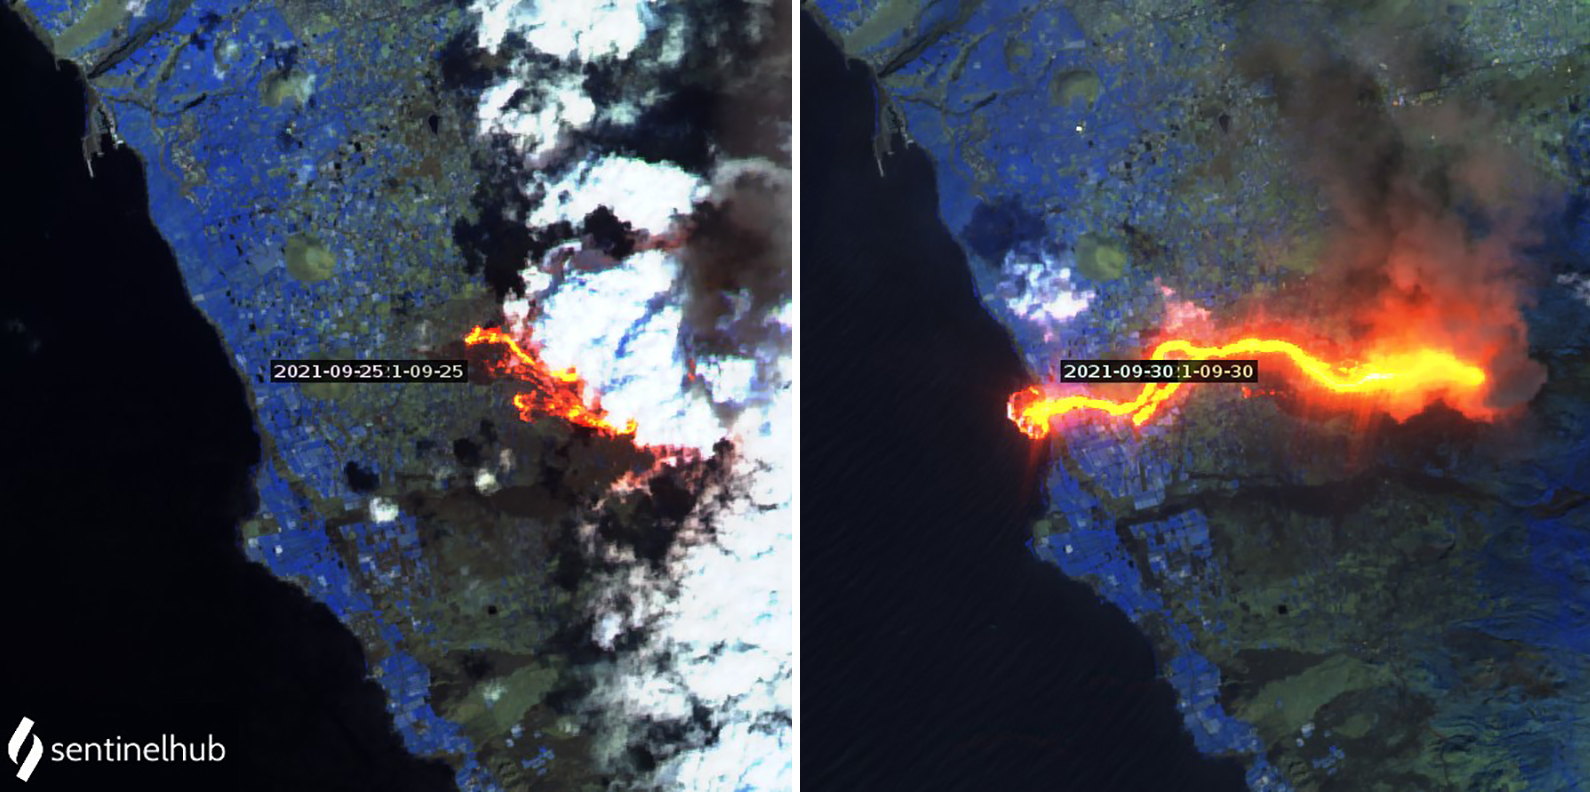
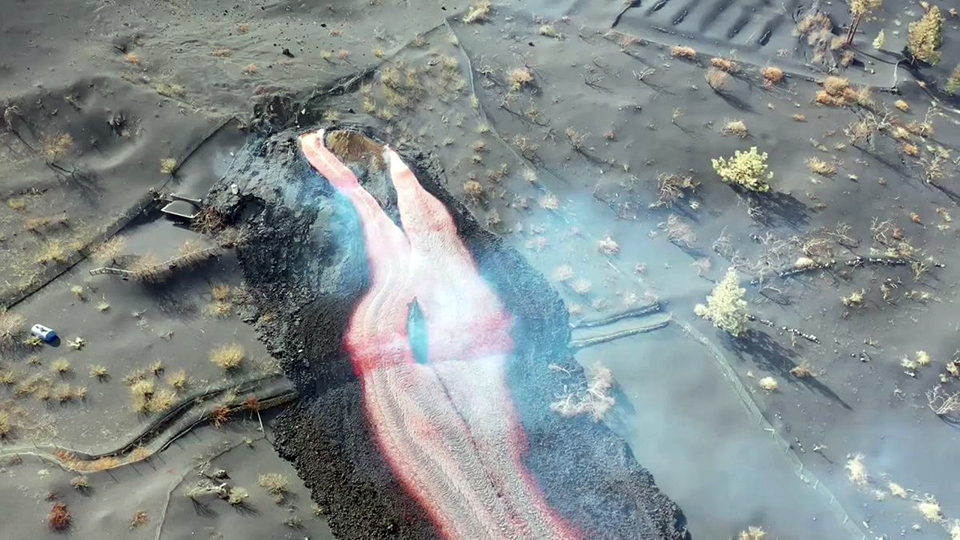
By nightfall on 29 September vigorous Strombolian activity was continuing at the pyroclastic cone, and the main lava flow was active all the way to the sea, with a growing delta into the ocean. Ash emissions continued on 29 and 30 September, rising in pulses to 5.2 km altitude and drifting SE, changing to S, SW, and finally NW. Sentinel-2 satellite imagery comparing 25 and 30 September showed the growth of the lava flow during that interval (figure 27). Strombolian and flow activity continued at the fissure vent on 30 September with new surges of activity sending fresh pulses of lava over existing flows (figure 28). The ocean delta continued to grow and reached a thickness of 24 m by the end of 30 September. Mapping of the flow indicated that 870 buildings had been destroyed and the flow covered 3.5 km2 by midday on 30 September (figure 29).
Late on 30 September 2021 two new vents emerged about 600 m NW of the base of the main cone. They created a new flow about 450 m away from, and parallel to, the main flow that crossed a local highway by the next morning and continued moving W (figure 30). Multiple vents also remained active within and on the flank of the main cone. As of 1 October, the front of the delta was 475 m out from the coastline and 30 m deep. IGN concluded that the volume of material erupted through the end of September was approximately 80 million m3.
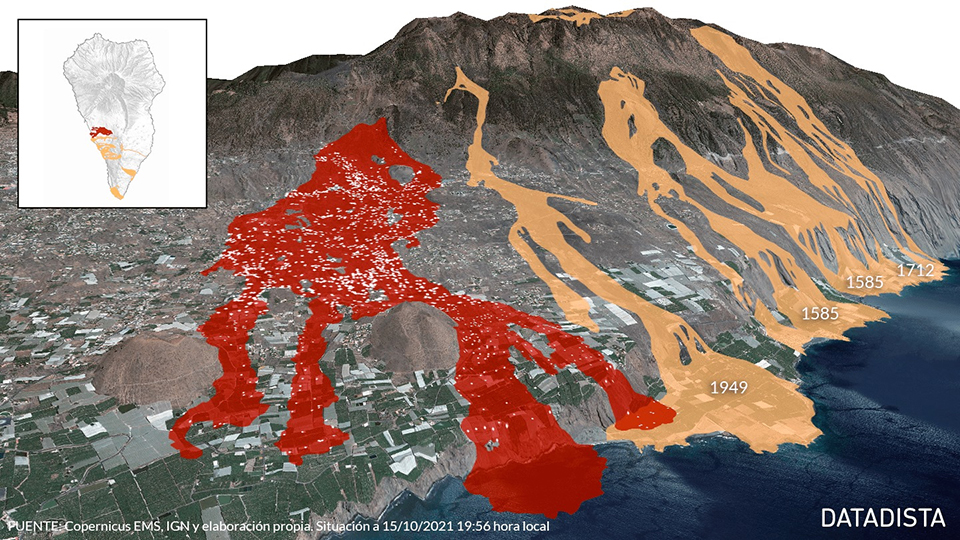
Geological Summary. The 47-km-long wedge-shaped island of La Palma, the NW-most of the Canary Islands, is composed of two large volcanic centers. The older northern one is cut by the steep-walled Caldera Taburiente, one of several massive collapse scarps produced by edifice failure to the SW. On the south, the younger Cumbre Vieja volcano is one of the most active in the Canaries. The elongated volcano dates back to about 125,000 years ago and is oriented N-S. Eruptions during the past 7,000 years have formed abundant cinder cones and craters along the axis, producing fissure-fed lava flows that descend steeply to the sea. Eruptions recorded since the 15th century have produced mild explosive activity and lava flows that damaged populated areas. The southern tip of the island is mantled by a broad lava field emplaced during the 1677-1678 eruption. Lava flows also reached the sea in 1585, 1646, 1712, 1949, 1971, and 2021.
Information Contacts: Instituto Geographico Nacional (IGN), C/ General Ibáñez de Íbero 3, 28003 Madrid – España, (URL: https://www.ign.es/web/ign/portal, https://www.ign.es/web/resources/volcanologia/html/CA_noticias.html); Instituto Volcanologico de Canarias (INVOLCAN) (URL: https://www.involcan.org/, https://www.facebook.com/INVOLCAN, Twitter: INVOLCAN, @involcan); Steering Committee of the Special Plan for Civil Protection and Attention to Emergencies due to Volcanic Risk (PEVOLCA), (URL: https://www3.gobiernodecanarias.org/noticias/los-planes-de-evacuacion-del-pevolca-evitan-danos-personales-en-la-erupcion-volcanica-de-la-palma/); NASA Global Sulfur Dioxide Monitoring Page, Atmospheric Chemistry and Dynamics Laboratory, NASA Goddard Space Flight Center (NASA/GSFC), 8800 Greenbelt Road, Goddard, Maryland, USA (URL: https://so2.gsfc.nasa.gov/); Copernicus EMS (URL: https://emergency.copernicus.eu/, https://twitter.com/CopernicusEMS ); Sentinel Hub Playground (URL: https://www.sentinel-hub.com/explore/sentinel-playground); Cabildo La Palma (URL: https://www.cabildodelapalma.es/es/algunas-de-las-imagenes-de-la-erupcion-volcanica-en-la-palma); El Periodico de Cataluny, S.L.U. (URL: https://www.elperiodico.com/es/fotos/sociedad/erupcion-palma-imagenes-12093812/12103264).Corporación de Radio y Televisión Española (RTVE) (URL: https://rtve.es, https://img2.rtve.es/imagenes/casas-todoque-alcanzadas-lava-este-miercoles-22-septiembre/1632308929494.jpg); Tom Pfeiffer, Volcano Discovery (URL: http://www.volcanodiscovery.com/); Volcanes de Canarias (URL:https://twitter.com/VolcansCanarias/status/1441711738983002114); Agence France-Presse (AFP) (URL: http://www.afp.com/ ); Bristol Flight Lab, University of Bristol, England (URL: www.https://flight-lab.bristol.ac.uk, https://twitter.com/UOBFlightLab).