Report on Grimsvotn (Iceland) — March 2022
Bulletin of the Global Volcanism Network, vol. 47, no. 3 (March 2022)
Managing Editor: Edward Venzke.
Edited by A. Elizabeth Crafford.
Grimsvotn (Iceland) November-December 2021 jökulhlaup is not followed by Grímsvötn eruption
Please cite this report as:
Global Volcanism Program, 2022. Report on Grimsvotn (Iceland) (Crafford, A.E., and Venzke, E., eds.). Bulletin of the Global Volcanism Network, 47:3. Smithsonian Institution. https://doi.org/10.5479/si.GVP.BGVN202203-373010
Grimsvotn
Iceland
64.416°N, 17.316°W; summit elev. 1719 m
All times are local (unless otherwise noted)
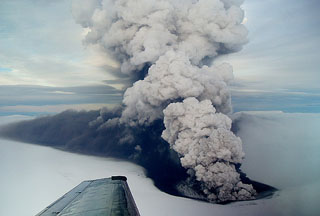
Grímsvötn is a volcano located under the Vatnajökull glacier in the southeastern quadrant of Iceland (figure 19). Its most recent eruption in 2011 included explosions with multiple 15-20 km altitude ash plumes that produced ashfall tens of kilometers away (BGVN 36:06). Periodic jökulhlaups (glacial outburst floods) from Vatnajökull have been recognized for centuries (Einarsson, 2009), and have occurred regularly since the end of the last ice age when a lake fed by glacial meltwater breaches its dam and drains. The best known jökulhlaups from Vatnajökull occur from three separate places: Grímsvötn volcano, the Skaftá cauldrons, and glacial lake Grænalón. The most dangerous jökulhlaups in Iceland have been associated with subglacial volcanic activity due to the greater volume of meltwater produced (Einarsson, 2009). This report summarizes past eruptions, jökulhlaups, and possible co-occurrences of the two with respect to Grímsvötn, and then describes in more detail events since the last eruption in 2011. Since then, jökulhlaups have been reported on the Skeiðarársandur outwash plain in 2014, 2015, 2016, and most recently during November-December 2021. Information is primarily from the Icelandic Met Office (IMO).
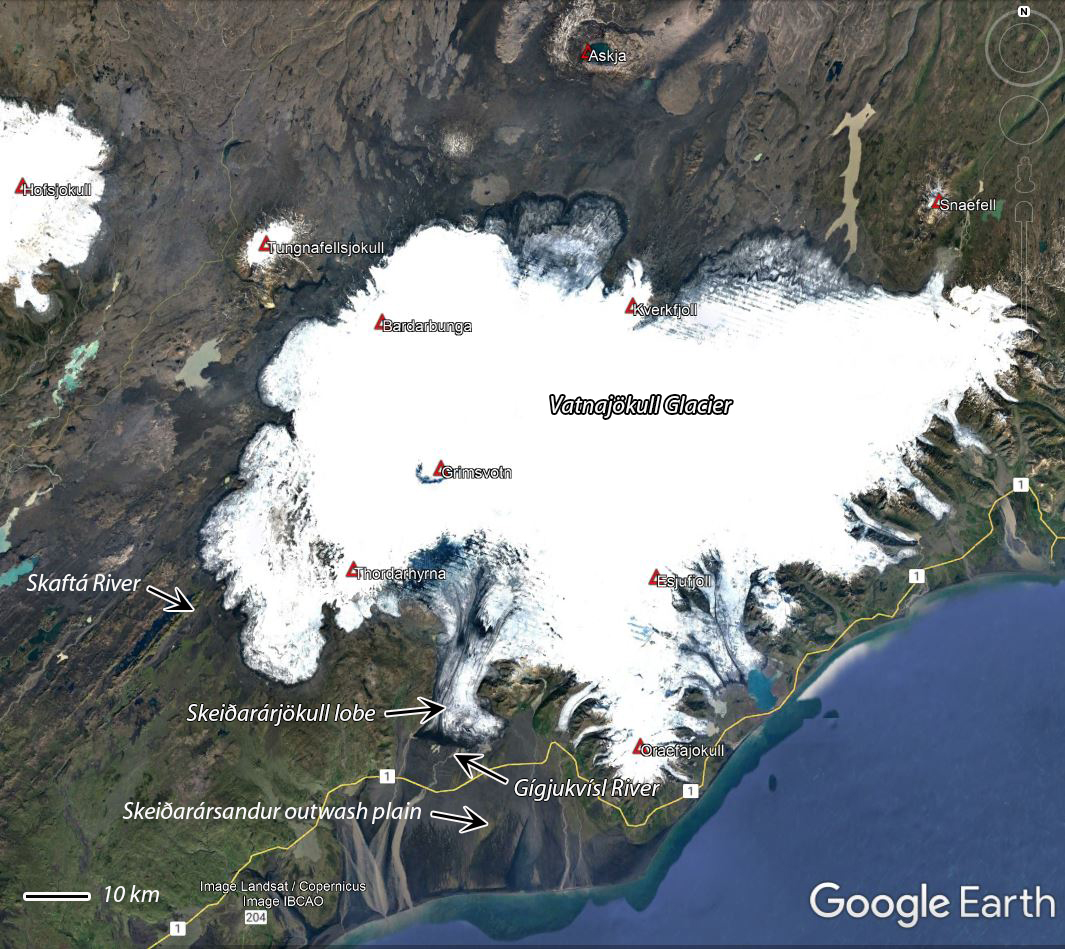 |
Figure 19. Grímsvötn volcano is located under the western half of the Vatnajökull glacier in southeastern Iceland. Jökulhlaups originating from the caldera lake travel 50 km S, emerge from the S tip of the Skeiðarárjökull lobe of the Vatnajökull glacier, enter the Gígjukvísl river, and travel S across the Skeiðarársandur outwash plain. The most recent jökulhlaup from Grímsvötn occurred during November-December 2021. Base map courtesy of Google Earth. |
Jökulhlaups from Grímsvötn have been known since at least the fourteenth century (Þórarinsson, 1939 and 1974, in Einarsson, 2009), but the relationship between eruptions and floods from the subglacial crater lake is not well understood. In 1953, Sigurður Þórarinsson suggested a correlation between jökulhlaups and Grímsvötn eruptions. He proposed that if a large volume of water was stored in the lake, that the pressure release following the sudden removal of water during a flood could facilitate magma movement and trigger an eruption. This type of scenario was proposed to explain coincident eruptions and jökulhlaups in 1922 and 1938. Records preserved since 1922 have indicated a few eruptions that were coincident with jökulhlaups, several eruptions with no evidence of jökulhlaups, and a larger number of jökulhlaups with no prior or subsequent documented eruption (table 2). The only recent confirmed event where a jökulhlaup was followed by an eruption took place in 2004.
Table 2. Jökulhlaups and eruptions at Grímsvötn from 1922-2021. For pre-1972 events, only those with possible co-occurring jökulhlaups and eruptions are listed. For 1972 and later both jökulhlaups and eruptions as reported by GVP or IMO are listed. Sources are listed in the table.
| Date | Eruption | Jökulhlaup | Total Discharge Estimate | Max Flux | Ice Subsidence | Source |
| 29 Sep-23 Oct 1922 | Eruption first observed 29 Sep, last observed 23 Oct | Skeiðará river jökulhlaup begins late Sep | -- | -- | -- | IMO, Þórarinsson (1939), Brandsdottir (1984) |
| May 1938 | Eruption 8 km north formed large ice cauldron, minor tephra | Jökulhlaups occurred at Skeiðará and Sula rivers | -- | -- | -- | BGVN 21:09 (Sep 1996), Gudmundsson and Björnsson (1991), BGVN 23:11 (Nov 1998) |
| 7-21 Jul 1954 | Eruption uncertain, possible steam explosions | Jökulhlaup on the Skeiðará river | -- | -- | -- | Þórarinsson S (1974), IMO |
| 15-30 Mar 1972 | No clear eruption evidence | Grímsvötn jökulhlaup | 3.2 km3 | -- | -- | CSLP 20-72 (Mar 1972), SEAN 07:02 (Feb 1982) |
| Sep 1976 | No eruption | Grímsvötn jökulhlaup | 2.4 km3 | -- | -- | SEAN 07:02 (Feb 1982) |
| 28 Jan-11 Feb 1982 | No eruption | Grímsvötn jökulhlaup | 1.3 km3 | 2,000 m3/s | 50 m | SEAN 07:02 (Feb 1982) |
| 28 May-2 Jun 1983 | Eruption within Grímsvötn caldera | No jökulhlaup | -- | -- | Ice cap melted | SEAN 08:05 (May 1983), BGVN 23:11 (Nov 1998) |
| 30 Sep-13 Oct, 4-7 Nov 1996 | Fissure eruption between Bardarbunga and Grímsvötn (Gjálp) fills Grímsvötn caldera with meltwater 30 Sep-13 Oct | Major flood reported five weeks after eruption started, 4-7 Nov, largest jökulhlaup recorded from Grímsvötn | 3.2 km3 | 5,000 m3/s | Subsidence over fissure 8-9 km long, 2 km wide | BGVN 21:09 (Sep 1996), BGVN 23:11 (Nov 1998), Gudmundsson and others (1997), Björnsson (2002) |
| 18-28 Dec 1998 | Eruption within Grímsvötn caldera | No jökulhlaup | -- | -- | -- | BGVN 23:11 (Nov 1998) |
| 26 Oct-5 Nov 2004 | Earthquake swarm and eruption began on 1 Nov at G. caldera following jökulhlaup, 26 Oct-4 Nov | Jökulhlaup water release began on 26 October, reached Skeiðará R on 29 Oct | 0.5 km3 | 3,000-4,000 m3/s | 10-20 m | BGVN 29:10 (Oct 2004) |
| 31 Oct-3 Nov 2010 | No eruption | Jökulhlaup emerged from glacier on 31 Oct and peaked on 3 Nov. Floodwater went W to river Gígjukvísl instead of into Skeiðará due to landform changes in 2009 | 0.45 km3 | 2,600 m3/s | -- | BGVN 36:06 (Jun 2011), IMO |
| 21-28 May 2011 | Eruption from Grímsvötn crater | No jökulhlaup | -- | -- | -- | BGVN 36:06 (Jun 2011) |
| 22 Nov 2012 | No eruption | Small jökulhlaup from subglacial lake Grímsvötn | 0.2-0.3 km3 | -- | -- | IMO (6 May 2015 report) |
| 27 Mar 2014 | No eruption | Small jökulhlaup from subglacial lake Grímsvötn | 0.2-0.3 km3 | ~1,000 m3/s | -- | SI/USGS Weekly (26 Mar-1 Apr 2014), IMO (6 May 2015 report) |
| 6-9 May 2015 | No eruption | Small jökulhlaup from subglacial lake Grímsvötn | 0.2-0.3 km3 | less than 700 m3/s | -- | SI/USGS Weekly (6-12 May 2015), IMO (6 May 2015 report) |
| 18-23 Aug 2016 | No eruption | Small jökulhlaup from subglacial lake Grímsvötn | 0.1-0.15 km3 | -- | 5 m | IMO |
| 24 Nov-6 Dec 2021 | No eruption | Large Jökulhlaup from subglacial lake Grímsvötn | -- | 2,800 m3/s | 77 m | IMO, SI/USGS Weekly (24-30 Nov 2021) |
Until 2009, jökulhlaups from Grímsvötn had emerged from under the S side of the Vatnajökull glacier on the S and E margins of the Skeiðarárjökull lobe of the glacier, draining into the Skeiðará river (figure 20). The Skeiðará river had previously deposited large amounts of sediment on the eastern part of the Skeiðarársandur plains over the centuries. In addition, the glacier had carved a trench during times of advance. In the summer of 2009, water ceased to enter the channel of the Skeiðará; the retreat of the glacier over the previous 15 years led to a shift in the direction of meltwater flow. Beginning in 2010, floodwater that emerged from beneath the eastern part of the Skeiðarárjökull glacier went westwards along the margin and then entered the Gígjukvísl river (figure 21).
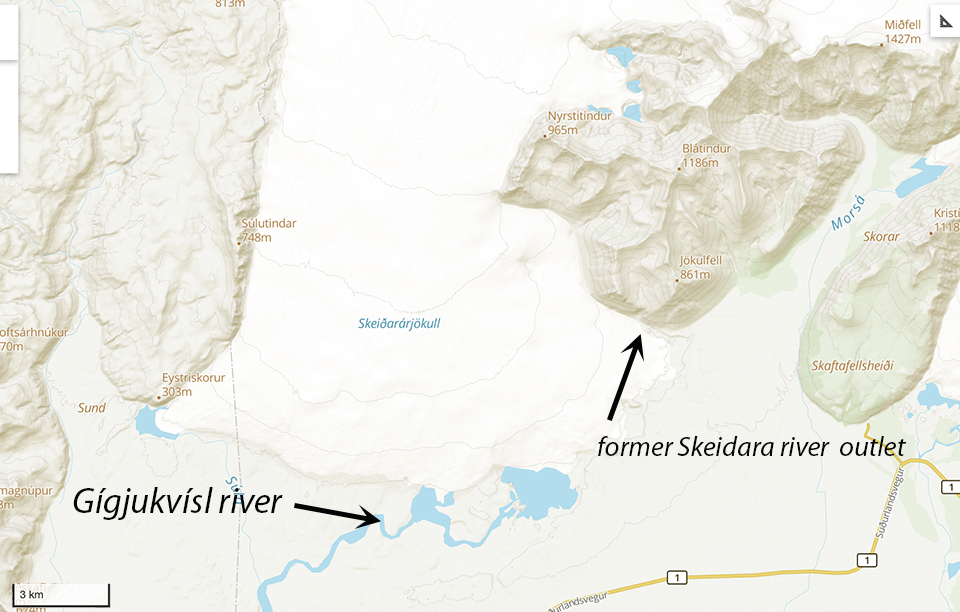 |
Figure 20. Jökulhlaups from Grímsvötn currently emerge from the S margin of the Skeiðarárjökull lobe of Vatnajökull glacier and drain into the Gígjukvísl River. Until 2009 they drained into the Skeiðará river. Courtesy of IMO. |
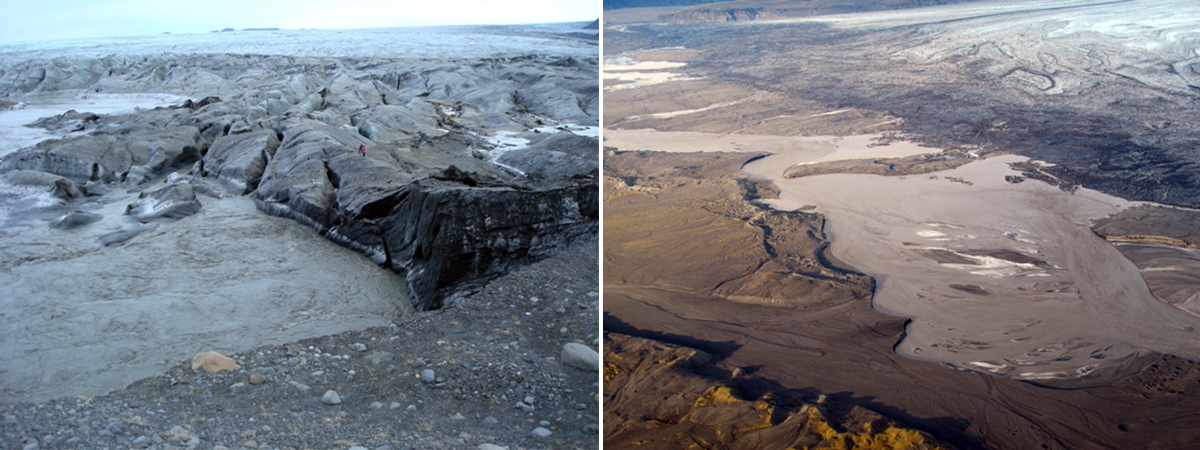 |
Figure 21. Floodwater flows along the terminus of Skeiðarárjökull glacier on 3 November 2010. IMO scientists are measuring water flow and chemistry from the glacier edge (left). The flow traveled west along the margin of the lobe into the Gígjukvísl river (right). Photos taken during scientific flight with the Icelandic Coast Guard (TF-SIF) by Matthew J. Roberts and Egill Axelsson, courtesy of Icelandic Met Office. |
Two subglacial geothermal areas 10-15 km NW of Grímsvötn cause surface depressions to form due to melting of the glacier at its base; they are known as the Eastern and Western Skaftá cauldrons (figure 22), named for the river where the floods discharge. The eastern cauldron is a little less than 3 km in diameter while the western one is about 2 km in diameter. The lows in the glacier surface lead to local minima in the fluid potential at the base of the glacier and therefore lakes are formed under both cauldrons, sealed by the ice overburden pressure at the rim (Björnsson, 2002). For the western cauldron, analyses suggest that the water formed by geothermal melting of ice is the largest (71%) component of inflow to the lake, followed by geothermal fluid (19%) and surface meltwater (10%). Jökulhlaups from underneath the Skaftá cauldrons occur almost every year and 45 jökulhlaups were recorded in the Skaftá river between 1955 and 2009 (Einarsson, 2009). Although the Skaftá cauldrons are located less than 20 km from Grímsvötn, the rivers where their respective jökulhlaups occur are located about 100 km apart; the Skaftá river is off the SW edge of the Vatnajökull glacier, while the Grímsvötn jökulhlaups have only been observed on the Skeidarársandur outwash plain located 50 km S of the volcano. There has not been any coincidence of activity recorded between these areas.
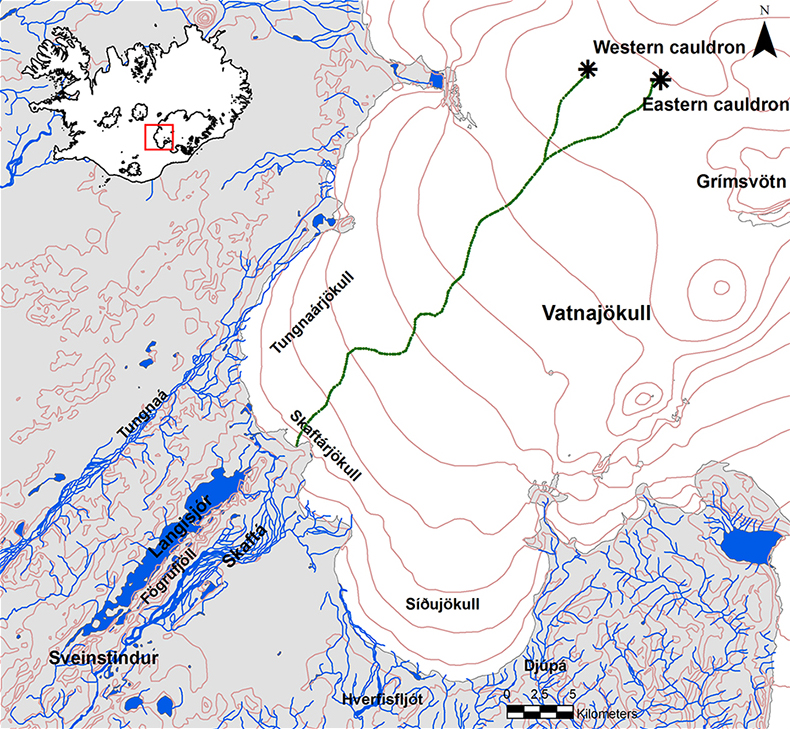 |
Figure 22. The Eastern and Western Skaftá cauldrons discharge water as jökulhlaups almost yearly; the water travels 40 km subglacially and emerges at the SW edge of the Vatnajökull glacier into the Skaftá river. There is no documented connection with Grímsvötn caldera and its associated jökulhlaups which discharge 50 km S of the volcano at the S edge of the Skeiðarárjökull lobe of the Vatnajökull glacier (bottom right of figure) into the Gígjukvísl river. Until 2009 Grímsvötn jökulhlaups drained into the Skeiðará river located farther E. Figure from Einarsson (2009). |
Jökulhlaups and eruptions during 1922-2011. A Skeiðará river jökulhlaup began in late September 1922 and an eruption at Grímsvötn was first reported on 29 September and last observed on 23 October of that year. There were no reports of jökulhlaups during eruptions in 1933 and 1934. Jökulhlaups that occurred on the Skeiðará and Sula rivers in May 1938 have been associated with an eruption that occurred a few kilometers N of Grímsvötn, though very little eruptive activity above the glacier was recorded. Jökulhlaups from Grímsvötn were reported in June 1939, April and May 1941, September 1945, and February 1948, but there were no confirmed reports of eruptions around those times. A Skeiðará river jökulhlaup during 7-21 July 1954 was attributed to a subglacial eruption, but this is uncertain. Jökulhlaups reported in March 1972 (CSLP 20-72), September 1976, and January-February 1982 (SEAN 07:02) had no accompanying reports of eruptions. The May-June 1983 eruption of Grímsvötn (SEAN 08:05) melted the overlying ice and revealed an oval-shaped lake, 300 m in diameter, initially covered by raft ice. Multiple explosions were observed from the lake; no jökulhlaups were reported in the Skeiðará river.
The 30 September-13 October 1996 Gjálp eruption was located on a N-trending fissure between Bardarbunga and Grímsvötn (BGVN 21:09; Björnsson, 2002) about 8 km NW of Grímsvötn. For five weeks the meltwater generated by the eruption went into the Grímsvötn caldera, raising the lake level to the highest ever recorded (Gudmundsson and others, 1997). By 4 November 1996 the lake had risen to 1,510 m, the level needed to float the ice dam, and ice-quakes marked the onset of drainage. About 10.5 hours later water emerged from the margin of Skeiðarárjökull as a flood wave, in the most rapid jökulhlaup ever recorded from Grímsvötn (Björnsson, 2002).
The December 1998 eruptive vents at Grímsvötn were at the foot of Mt. Grímsfjall, which rises about 300 m above the flat ice shelf over the subglacial lake (BGVN 23:11). No major flood occurred in conjunction with this event; only a small amount of the ice shelf near the eruption site melted.
High-frequency tremor on 26 October 2004 indicated the beginning of a flood from the subglacial caldera lake. An eruption began on 1 November 2004, melting through 150-200 m of ice to the surface in about an hour. Observations on 2 November revealed that the eruption was occurring from a circular vent about 1 km in diameter in the SE part of the crater where a surface ice cauldron had been mapped a year earlier (figure 5, BGVN 29:10). The jökulhlaup from the draining caldera reached a maximum discharge rate of 3,000-4,000 m3/s on the afternoon of 2 November in the affected rivers on the coastal plain. Discharge declined quickly after the peak with no damage reported to roads or bridges. The total volume of the jökulhlaup was about 0.5 km3. On 3 November pulses of activity produced ash plumes rising from 8-14 km above the volcano.
On 31 October 2010, a jökulhlaup originating at subglacial lake Grímsvötn emerged from beneath the Skeiðarárjökull glacier, according to IMO. Observations on the bridge over the Gígjukvísl river confirmed a steady water level increase that indicated the onset of a jökulhlaup, with initial discharge rates of about 145 m3/s. Flow reached a maximum of 2,600 m3/s on the Gígja river on 3 November before declining. Seismicity recorded during the event was all attributed to the jökulhlaup, and no evidence was detected either seismically or visually of an eruption (figure 23).
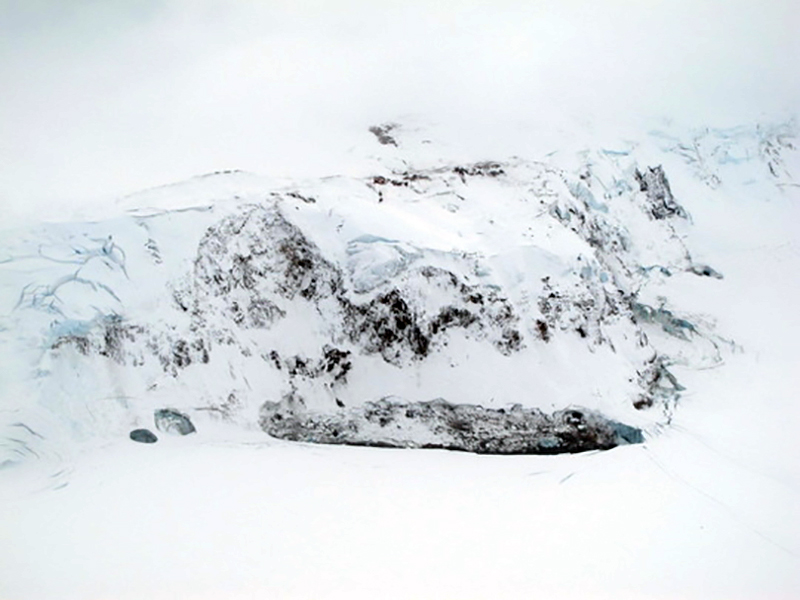 |
Figure 23. An aerial view of the eastern edge of Mt. Grímsfjall on 3 November 2010 revealed fresh crevasses at its base in the ice-cover over the adjacent subglacial lake Grímsvötn. The elongated trench in the ice gives an indication of the lake surface and the extent of the subsidence after the jökulhlaup. Water presumably drained from this region around the eastern edge of Grímsfjall. Photo taken during scientific flight with the Icelandic Coast Guard (TF-SIF) by Matthew J. Roberts and Egill Axelsson, courtesy of Icelandic Met Office (IMO). |
An eruption from Grímsvötn began on 21 May 2011 following about an hour of tremor (BGVN 36:06). Ash plumes from the eruption rose to 15-20 km altitude, disrupted airline traffic, and drifted toward northern Europe. Ashfall was reported from the Reykjavík area in the SW to Tröllaskagi Peninsula in the N. Explosions lasted for approximately a week; on 28 May tremor rapidly decreased then disappeared. No changes in the water levels were recorded in either the Gígja (Gígjukvísl) or Núpsvötn rivers. IMO noted that the eruption occurred from the same site in the SW part of the Grímsvötn caldera as the 2004 eruption, and ice-melt was not expected to be great. Visual observation on 26 May indicated that little ice had melted during the eruption, and no jökulhlaup occurred.
Jökulhlaups during 2012-2021. The water level rose slightly in the Gígjukvísl river on 22 November 2012 and was attributed by IMO to a small flood releasing from Grímsvötn's subglacial lake; no eruption was reported. Another small jökulhlaup with a maximum discharge rate of about 1,000 m3/s was reported on 27 March 2014, causing a rise in the water level in the Gígjukvísl River (figure 24). Electrical conductivity measurements indicated a considerable increase of a geothermal contribution to the river water, confirming its source at Grímsvötn's subglacial lake. Seismic tremor had increased due to the flood and not volcanic activity.
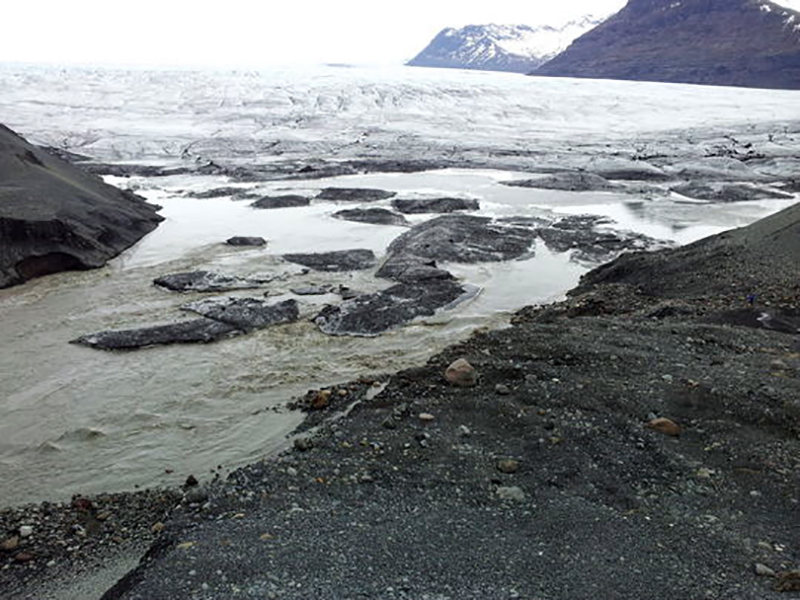 |
Figure 24. Water at the Skeiðará river outlet at the Skeiðarárjökull ice margin on 27 March 2014 indicated a small jökulhlaup from Grímsvötn's subglacial lake. The photo is taken at the E margin of Skeiðarárjökull and the mountains in the background are Krossgilstindur (near) and Færnes (distant). Photo copyright by Njáll Fannar Reynisson, courtesy of IMO. |
A small jökulhlaup from Grímsvötn's subglacial lake occurred on 6 May 2015, increasing the water level in the Gígjukvísl River. Electrical conductivity measurements indicated a considerable increase of a geothermal contribution to the river water. Based on information from the Institute of Earth Sciences, the water available for drainage was estimated at 0.2-0.3 km3, similar to floods in November 2012 and March 2014. Seismic tremor had increased due to the flood and not volcanic activity, and no eruption was reported. The IMO reported another small jökulhlaup originating from Grímsvötn in the Gígjukvísl river on the Skeiðarársandur outwash plain on 23 August 2016. Seismicity had been first observed at Mt. Grímsfjall on 19 August and lasted for about 24 hours (figure 25). On 22 August, data indicated that the ice shelf over the subglacial lake had subsided by about 5 m since 18 August. It was estimated that only 0.1-0.15 km3 of water was present in the lake. No eruption occurred.
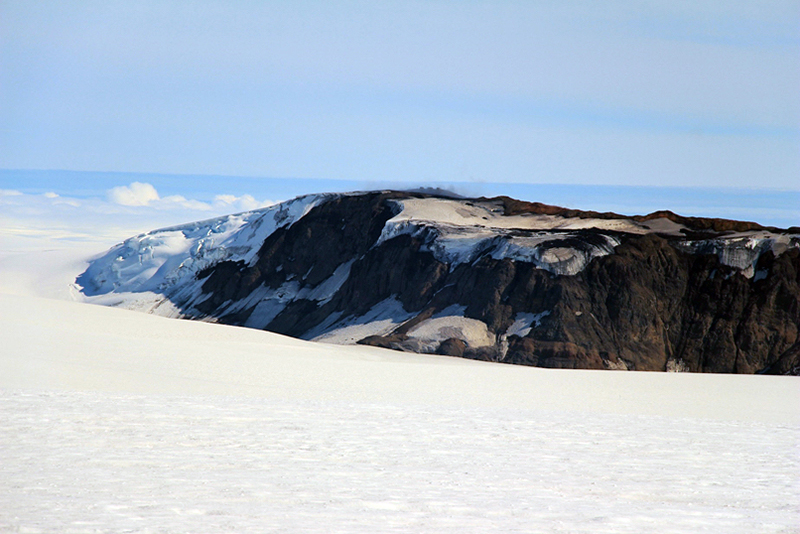 |
Figure 25. Mt. Grímsfjall was visible from the Grímsvötn's ice shelf during an IMO expedition 5-7 August 2016. The ice shelf subsided by about 5 m during the August 2016 jökulhlaup. The buildings of the Glacier Research Society at Eystri Svíahnúk are visible as two small dots within the snowfield along the top of Grímsfjall. Courtesy of IMO. |
Between previous eruptions of Grímsvötn, deformation data was interpreted by IMO as indicating gradual accumulation of new magma at depth. In early June 2020 IMO scientists measured high levels of SO2 in the SW part of the caldera, close to the 2004 and 2011 eruption sites (figure 26); they interpreted this as magma degassing at a shallow level. In addition, the area where geothermal activity could be detected at the surface had notably increased. Although seismic activity had been increasing for the previous year, it was still below levels reached prior to the eruptions of 2004 and 2011.
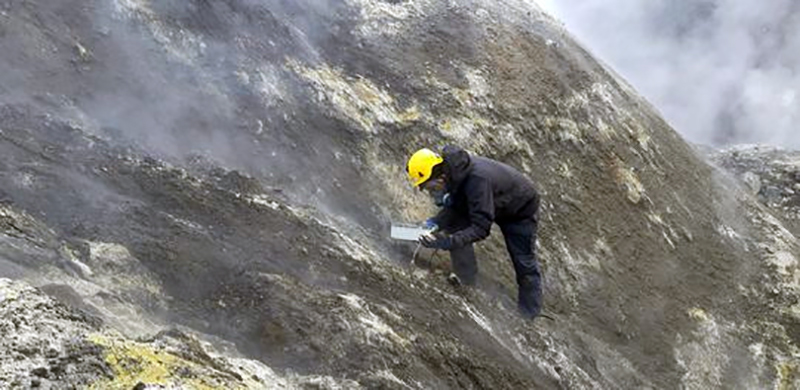 |
Figure 26. A specialist from the Icelandic Meteorological Office performed gas measurements at Grímsvötn during the first half of June 2020, as increasing SO2 levels suggested magma degassing. The location of the photo is near the site of the 2011 eruption. Photograph by Melissa Anne Pfeffer, courtesy of IMO. |
Elevation measurements of the ice shelf over Grímsvötn made by IES showed that it rose 10 m during the first half of 2020 to a level it had not exceeded since October 2010. In response to the increased possibility for a flood or an eruption, IMO installed a continuous GPS measurement station on the ice cap in early June 2020. Webcams were also installed at Hamarinn and Skeiðarársandur looking towards Grímsvötn.
In August 2020 IMO added a webcam to Mt. Grímsfjall, overlooking the Grímsvötn ice field above the lake. The GPS devices showed a potential drop in the ice sheet in early August, but the electrical conductivity and water level in the Gígjukvísl river were both normal. IMO discovered that the instruments on the ice shelf had tilted (figure 27) as a result of high rates of melting of the ice sheet from unusually hot weather. The IMO raised the Aviation Color Code to Yellow on 30 September 2020, noting that seismicity had increased over the past month, ice cauldrons had deepened in several places over the caldera signifying increased geothermal activity, surface deformation surpassed the level prior to the 2011 eruption, and magmatic gases were present in emissions over the summer. Additionally, water levels in the subglacial lake were comparable to levels prior to floods in 2004 and 2010.
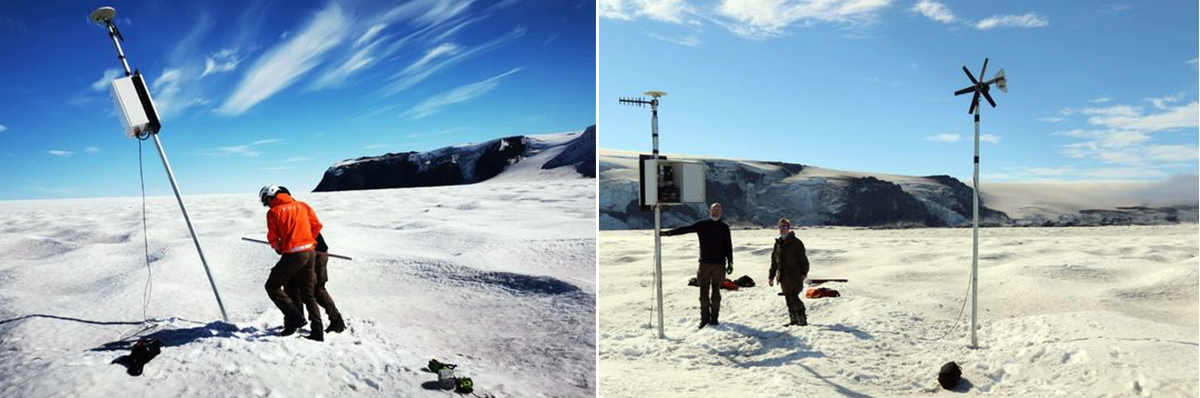 |
Figure 27. IMO scientists repaired tilted GPS monitoring equipment on the Grímsvötn ice sheet over the subglacial lake in mid-August 2020 after unusually hot weather increased the melting rate at the surface and disrupted the equipment. The GPS meter is on the left, and on the right is a wind turbine that powers the measuring device (right). Photograph by Björn Ólafsson, courtesy of IMO. |
On 24 November 2021 IMO reported that the ice sheet over Grímsvötn's caldera had subsided 60 cm in the previous few days and the rate of subsidence had accelerated during the previous 24 hours. These measurements indicated that it was likely that water had started to leave the lake. The flow rate in the river on 29 November was measured at 240 m3/s; water levels in the Gígjukvísl drainage rose overnight during 30 November-1 December (figure 28) and by 2 December the flow rate had reached 930 m3/s, ten times the normal seasonal rate. Water from the lake drained from the E side of Skeiðarárjökull lobe and from a channel in the middle of the lobe into the Gígjukvísl River. Daily measurements showed that the flow rate continued to rise; it peaked at about 2,800 m3/s during the morning of 5 December, and then declined rapidly. While the water was draining from Grímsvötn lake, subsidence of the overlying ice sheet continued; by 2 December it had reached 17 m and continued to fall rapidly. The maximum subsidence of 77 m was measured by IMO during 5-6 December.
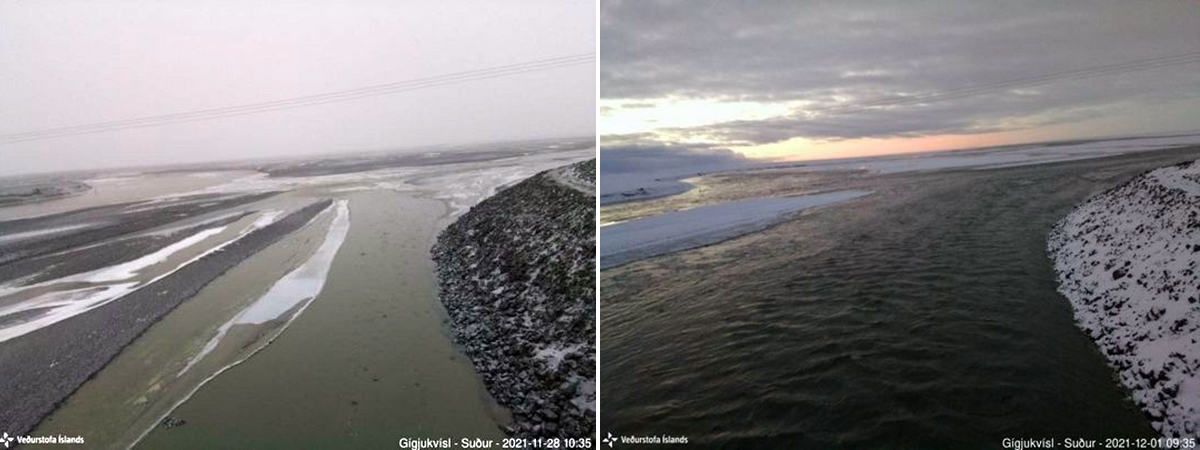 |
Figure 28. The water level rose substantially in the Gígjukvísl river between 28 November (left) and 1 December 2021 (right) from the jökulhlaup that began on 24 November draining the subglacial lake at Grímsvötn. View is to the S from the IMO webcam. Courtesy of IMO. |
Early on 6 December 2021 two earthquakes, M 2.3 and 3.6 were recorded, followed by several M 1 aftershocks. This resulted in the IMO briefly raising the Aviation Color Code to Orange, based on concerns of a possible relationship between the draining lake and increased eruption probability. With no further significant seismic activity, the alert level was lowered to Yellow the next day. IMO lowered the Aviation Color Code further to Green on 12 January 2022, noting that seismicity had returned to normal levels with a few earthquakes detected over the previous few weeks.
References: Björnsson H, 2002, Subglacial lakes and jökulhlaups in Iceland. Global and Planetary Change, 35: 255-271.
Brandsdottir B, 1984, Seismic activity in Vatnajökull in 1900-1982 with special reference to Skeidararhlaups, Skaftarhlaups and Vatnajökull eruptions. Jokull, 34: 141-150.
Einarsson B, 2009, Jökulhlaups in Skaftá: A study of jökulhlaup from the Western Skaftá cauldron in the Vatnajökull ice cap. Iceland, Icelandic Meteorological Office, VÍ 2009-006, ISSN 1670-8261.
Gudmundsson M T, Bjornsson H, 1991, Eruptions in Grímsvötn, Vatnajökull, Iceland, 1934-1991, Jokull, 41: 21-45.
Gudmundsson M T, Sigmundsson F, Björnsson H, 1997, Ice-volcano interaction of the 1996 Gjálp subglacial eruption, Vatnajökull, Iceland. Nature, 389:6654, 954-957. DOI: 10.1038/40122.
Þórarinsson S, 1939, The ice dammed lakes of Iceland with particular reference to their values as indicators of glacier oscillations. Geografiska Annaler, 21 (3-4), 216-242.
Þórarinsson S, 1953, The crater groups in Iceland. Bulletin of Volcanology, 14: 3-44. https://doi.org/10.1007/BF02596003
Þórarinsson S, 1974. Vötnin stríð. Saga Skeiðarárhlaupa og Grímsvatnagosa. Bókaútgáfa, Menningarsjóðs. Reykjavík. [In Icelandic].
Geological Summary. Grímsvötn, Iceland's most frequently active volcano in recent history, lies largely beneath the vast Vatnajökull icecap. The caldera lake is covered by a 200-m-thick ice shelf, and only the southern rim of the 6 x 8 km caldera is exposed. The geothermal area in the caldera causes frequent jökulhlaups (glacier outburst floods) when melting raises the water level high enough to lift its ice dam. Long NE-SW-trending fissure systems extend from the central volcano. The most prominent of these is the noted Laki (Skaftar) fissure, which extends to the SW and produced the world's largest known historical lava flow in 1783. The 15 km3 basaltic Laki lavas were erupted over 7 months from a 27-km-long fissure system. Extensive crop damage and livestock losses caused a severe famine that resulted in the loss of one-fifth of the population of Iceland.
Information Contacts: Icelandic Met Office (IMO), Reykjavík, Iceland (URL: http://en.vedur.is/); Google Earth (URL: https://www.google.com/earth/).