Report on Etna (Italy) — April 1983
Scientific Event Alert Network Bulletin, vol. 8, no. 4 (April 1983)
Managing Editor: Lindsay McClelland.
Etna (Italy) Lava effusion continues; central crater explosions; deformation, temperature and self-potential data
Please cite this report as:
Global Volcanism Program, 1983. Report on Etna (Italy) (McClelland, L., ed.). Scientific Event Alert Network Bulletin, 8:4. Smithsonian Institution. https://doi.org/10.5479/si.GVP.SEAN198304-211060
Etna
Italy
37.748°N, 14.999°E; summit elev. 3357 m
All times are local (unless otherwise noted)
The eruption was continuing as of 6 May. J. C. Tanguy noted that temperature station cables in the S part of the summit zone broke on 27 March between 0530 and 0946, probably because of the opening of the eruption fracture. Fissures extended S from 2,700 m (where two explosion vents formed on 31 March) to 2,450 m, then turned SSW along the trend of the 1910 eruption. Small hornitos and spatter cones formed between 2,450 and 2,350 m. The main effusive vent was at 2,280 m altitude. On 31 March, the temperature of lava at this vent was 1,067°C at 60 cm depth, and the same value was measured in the main flow 30-40 m downslope on 4 April. F. Mousnier-Lompre and G. Scarpinati recorded a lava temperature of 1,078°C on 1 May. J.B. Murray and A. Pullen reported that lava flow surface velocities measured 17-30 April were in the 1.17-3.41 m/s range. Using surface velocities, Murray and Pullen calculated an average effusion rate of 22 m3/s if flow thickness was 3 m and 44 m3/s if the thickness was 5 m.
Romolo Romano reported that lava flowed S and SW, forming a wide, complex field as much as 1 km across and 40 m thick. On the E side of the field, the fronts of the longest flows were about 6 km from the vent and reached 1,150 m altitude before stopping. On 23 April, the principal flow shifted to the W side of the field, and advanced to about 6.5 km from the vent, stopping at 1,100 m altitude only 30 m from a road. On 4 May the primary flow was again moving down the E side of the lava field and had reached 1,450 m altitude as of early 6 May. Lava flowed from the vent at about 2 m/s, a rate of about 10 m3/s, and had a temperature of about 1,030°C [but note 1,067° and 1,078° above]. The rate of advance of the flow fronts was quite variable and dependent on the gradient; estimated velocities ranged from a very few meters per hour to ~60 m/hour. The area covered by the lava was about 4 km2 on 6 May and the volume of lava emitted was ~40 x 106 m3.
Earlier in the eruption, small hornitos and spatter cones had formed above the main effusive vent and small quantities of lava fragments were ejected. Vapor emission continued from this portion of the eruption fissure but no lava fragment ejection has been noted since 10 April. Two explosion vents [not one as originally reported] at 2,700 m altitude ejected ash during the morning of 1 April [not 28 March as originally reported; Tanguy and Patané (1984), Frazzetta and Romano (1984)], but only vapor emission has been observed at this vent since then.
Throughout the eruption, ash was ejected at varying intensity from Bocca Nuova. More vigorous ash ejection 2-5 May sent plumes to 2 km above the crater and caused ashfalls on the mainland (Calabria coast) at least 60 km from the volcano. On 4 May, a polar orbiting satellite image showed the beginning of an ash emission episode at 0453. By the next image at 0606, a narrow plume extended nearly 1,000 km SE from Etna at an altitude of about 7.5 km. Venting was continuing at 0945 but the plume was smaller; at 1603, it was 100-150 km long. Another image, at 0705 on 6 May, showed a plume ~100 km long. From the Chasm, weak emission of gas that sometimes contained reddish ash has been observed during the eruption. In the Northeast and Southeast craters, eruptive activity was limited to weak fumarolic emissions, but new concentrations of large fractures were seen in these craters as well as small internal collapses.
Murray and Pullen reported that vertical ground deformation during 1981-82 was characterized by summit deflation and S flank inflation. Reoccupation of a precise leveling network 20-22 April 1983 showed large changes on the upper S flank (near Piccolo Rifugio) since September 1982: 42 cm of uplift W of the eruption fissure, 12 cm of uplift E of the fissure, and a drop of 126 cm on the fissure itself. Large and complex movements had occurred elsewhere, including deflation of 76 cm above the eruption fissure at about 2,900 m altitude (near Torre del Filosofo). Horizontal measurements across the fissure showed an E-W extension of 1.3 to 2 m since August 1981, with contraction of 17 cm and 6 cm at 500 m and 1 km W of the fissure. A network of 25 dry-tilt stations occupied 24-29 April 1983 showed no general inflation or deflation of the edifice since 1982.
Ground temperature measurements at 6 m depth on the S flank at 1,900 m altitude showed a strong increase in November 1982 (figure 10). In the summit zone, ground self-potential increased at roughly the same time and again in mid-January. A very steep rise occurred in early April, after the start of the eruption (figure 11). Immediately before the eruption a geophone in the S summit zone registered strong seismic activity, up to 134 events/hour during the morning of 27 March.
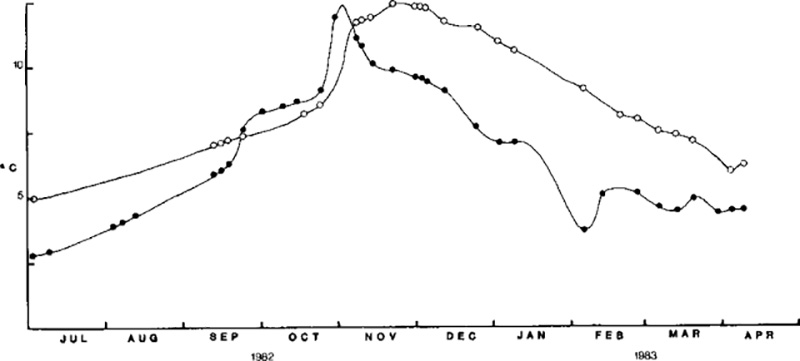 |
Figure 10. Ground temperatures measured July 1982-March 1983 at 6 m depth, Silvestri station (closed circles) and Calcarazzi station (open circles), Etna's south rift zone, 1,900 m altitude. |
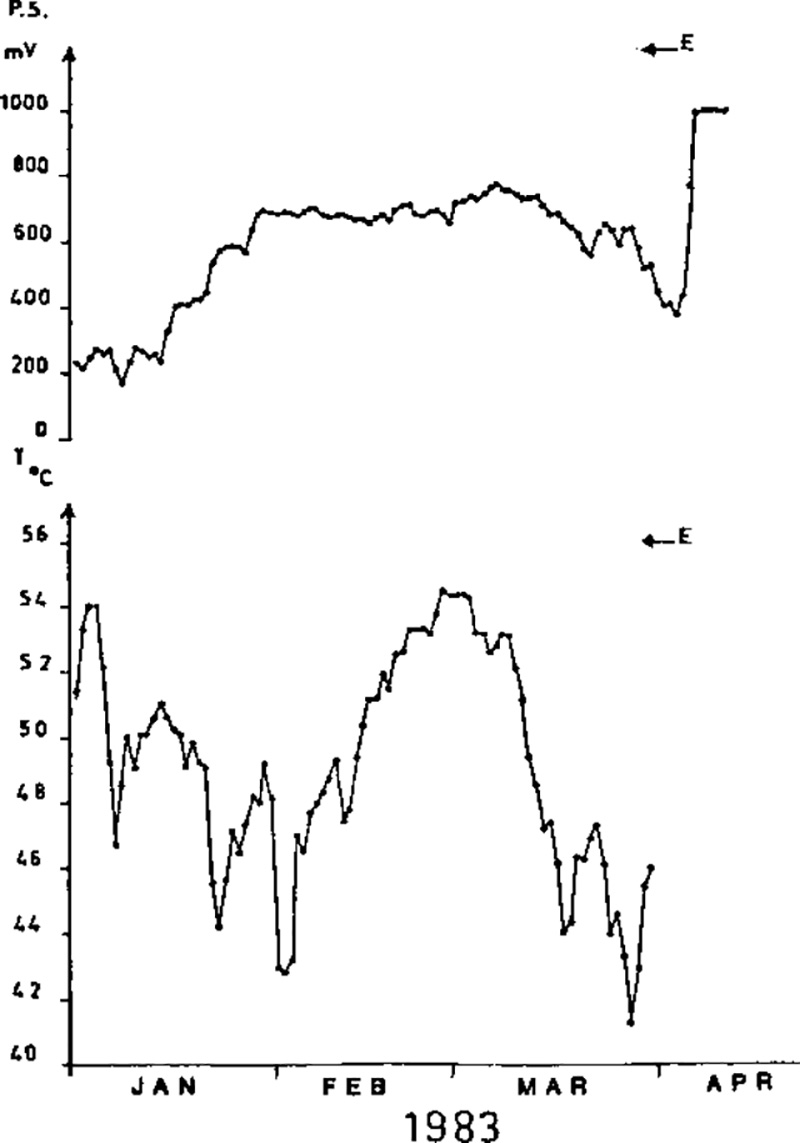 |
Figure 11. Ground self-potential (top), and temperature (bottom), at 120 cm depth, recorded at Vulcarolo station, south summit zone, 2,965 m altitude. Note that the very steep rise in self-potential occurred in early April, after the start of the eruption. Telemeasurements by ARGOS system. |
Further References. Frazzetta, G., and Romano, R., 1984, The 1983 Etna eruption: event chronology and morphological evolution of the lava flow: BV, v. 47, p. 1079-1096.
Tanguy, J., and Patané, G., 1984, Activity of Mount Etna, 1977-1983: volcanic phenomena and accompanying seismic tremor: BV, v. 47, p. 965-976. (both in Barberi and Villari, eds., 1984, cited after 8:07)
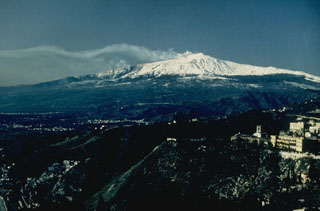
Geological Summary. Mount Etna, towering above Catania on the island of Sicily, has one of the world's longest documented records of volcanism, dating back to 1500 BCE. Historical lava flows of basaltic composition cover much of the surface of this massive volcano, whose edifice is the highest and most voluminous in Italy. The Mongibello stratovolcano, truncated by several small calderas, was constructed during the late Pleistocene and Holocene over an older shield volcano. The most prominent morphological feature of Etna is the Valle del Bove, a 5 x 10 km caldera open to the east. Two styles of eruptive activity typically occur, sometimes simultaneously. Persistent explosive eruptions, sometimes with minor lava emissions, take place from one or more summit craters. Flank vents, typically with higher effusion rates, are less frequently active and originate from fissures that open progressively downward from near the summit (usually accompanied by Strombolian eruptions at the upper end). Cinder cones are commonly constructed over the vents of lower-flank lava flows. Lava flows extend to the foot of the volcano on all sides and have reached the sea over a broad area on the SE flank.
Information Contacts: R. Romano, L. Villari, S. Gresta, and O. Consoli, IIV; J. Tanguy and J. Murray, PIRPSEV; A. Pullen, Imperial College; M. Matson, NOAA; C. Archambault and J. Stoschek, CNET, France; S. Scalia and G. Scarpinati, Acireale; J.Bartaire J. and N. Bartaire, St. Maur des Fossés; R. Cristofolini, M. Cosentino, G. Lombardo, G. Patanè, A. Viglianisi, and P. Villari, Ist. di Scienze della Terra, Catania; P. Mousnier-Lompré, Servizio Sismico Regionale.