Report on Fagradalsfjall (Iceland) — September 2023

Bulletin of the Global Volcanism Network, vol. 48, no. 9 (September 2023)
Managing Editor: Benjamin Andrews.
Edited by Kadie L. Bennis.
Fagradalsfjall (Iceland) New eruption consisted of lava flows and fountains during July-August 2023
Please cite this report as:
Global Volcanism Program, 2023. Report on Fagradalsfjall (Iceland) (Bennis, K.L., and Andrews, B., eds.). Bulletin of the Global Volcanism Network, 48:9. Smithsonian Institution.
Fagradalsfjall
Iceland
63.895°N, 22.258°W; summit elev. 250 m
All times are local (unless otherwise noted)
The Fagradalsfjall volcanic system on the Reykjanes Volcanic Zone in Iceland first erupted on 19 March 2021, following more than a year of earthquake activity and inflation/deflation periods. This was the first volcanic activity on the system after about 6,000 years of quiescence. Although the Fagradalsfjall fissure swarm has previously been considered a split or secondary swarm of the Krýsuvík-Trölladyngja volcanic system, as of September 2022 Icelandic volcanologists managing the Catalogue of Icelandic Volcanoes made the decision to identify Fagradalsfjall as a distinct and separate system.
The fissure eruption that started in August 2022 near the border of the previous lava flow field N of Fagradalsfjall in Meradalir was characterized by lava flows, fountains, and sulfur dioxide emissions (BGVN 47:09). This report covers a new eruption period that began on 10 July 2023 and ended in early August, characterized by similar activity. Information comes from Icelandic Meteorological Office (IMO), the Institute of Earth Sciences, and various satellite data.
Inflation began in early April in the western Reykjanes Peninsula, reaching a total of 3 cm, and at a rate of about 1 cm per month. Data indicated possible accumulation of magma at 15 km depth. In June, more than 1,000 earthquakes were recorded, more of which were located beneath Reykjanestá, NE of Fagradalsfjall and SW of Kleifarvatn. Seismicity intensified during 3-4 July. An earthquake swarm began at 1400 on 4 July and by 1150 on 5 July, more than 1,800 earthquakes were detected in the vicinity of the July 2022 dike intrusion (figure 37). The depth of the earthquakes became shallower within the first few hours of the swarm; by 5 July the depths were at 2-3 km. Seven of those earthquakes exceeded an M 4, and the largest was an M 4.8 event that was recorded at 0821 on 5 July. On 5 July at 1055 IMO raised the Aviation Color Code (ACC) to Orange (the third level on a four-color scale). By 1330 on 7 July, more than 7,000 earthquakes were detected in the swarm that began on 4 July. The epicenters were aligned NE-SW between Fagradalsfjall and the Keilir cone, NNE from the 2021 and 2022 eruptions, and mostly concentrated just N of the Litli Hrútur hill. Deformation data (GPS and radar interferometry) showed uplift in the same area, which IMO suggested was a magmatic dike intrusion that reached 1 km depth by early on 6 July. Seismicity decreased during 6-7 July and the rate of deformation slowed; an analysis showed that by 9-10 July the dike had propagated 1 km further NE. Small earthquakes were reported in Kleifarvatn, the largest of which was an M 4.6, and caused some rock falls in Kleifarvatn and Trolladyngja.
 |
Figure 37. Map showing the locations of the earthquakes (circles) at Fagradalsfjall from 30 July 2022 to 5 July 2023. The red circles represent earthquakes in 2023 and the blue circles represent the earthquake swarm that occurred during July-August 2022. The orange line represents the vertical projection of the dike intrusion that occurred in 2022 and the lighter orange color shows the extent of the lava flow field from 2022. The map also shows the magnitude for earthquakes greater than 1, and the size of the circles are proportional to the magnitude of the earthquakes. Courtesy of IMO. |
Tremor was detected at 1425 on 10 July and continued to intensify, leading to a new fissure eruption oriented NE-SW, beginning at 1640 (figure 38). Webcam images showed gas-and-steam emissions and incandescence, but no major ash emissions. The fissure was about 200-m-long, primarily located in a depression, and was characterized by lava fountains (figure 39) and lava flows originating from three short fissures on the E and NE flanks of Litli-Hrútur and moving NE and S. Gas-and-steam emissions drifted NW. As a result, IMO raised the ACC to Red (the highest level on a four-color scale) at 1707. At 1724 the ACC was lowered back to Orange. According to estimate from the Institute of Earth Sciences, the fissure quickly reached about 900-m-long, based on drone footage.
 |
Figure 38. Photo of the start of the new fissure eruption at Litli-Hrútur, part of the Fagradalsfjall volcanic system taken on 10 July 2023. Gas-and-steam emissions accompanied the lava flow. Courtesy of Elísabet Pálmadóttir, IMO. |
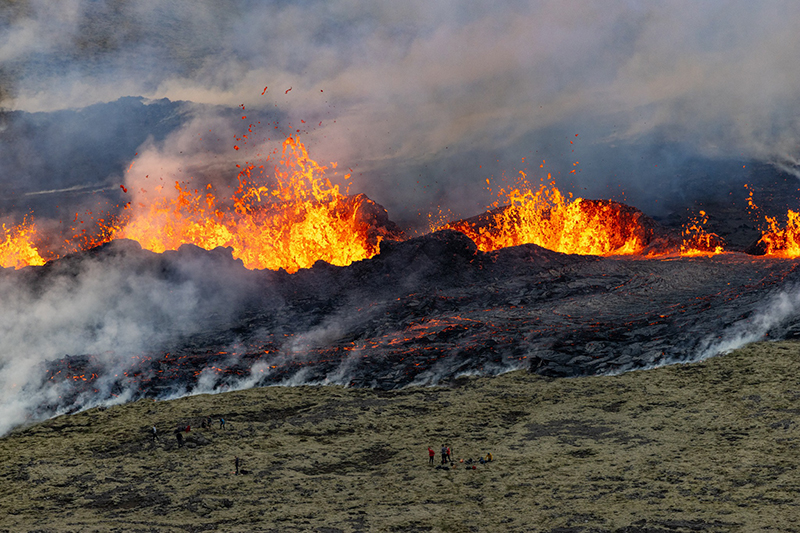 |
Figure 39. Photo of the lava fountains emanating from Litli-Hrútur, part of the Fagradalsfjall volcanic system taken the night of 10 July 2023. People are visible at the bottom middle of this photo for scale. Courtesy of Vilhelm Gunnarsson via Almannavarnadeildar ríkislögreglustjóra. |
Tremor levels peaked between 2100 on 10 July and 0000 on 11 July, and steadily declined through 1100. The intensity of the eruption notably decreased with fewer active lava fountains by 1250 on 11 July. Only one vent with an elongated crater and multiple lava fountains were active by 1635. Gas-and-steam plumes rose as high as 4 km above the vent. Lava flows mostly traveled SE and flowed into a shallow valley S of Litli-Hrútur. On 11 July IMO measured the amount of sulfur dioxide with a remote sensing device, DOAS (Differential Optical Absorption Spectroscopy). The amount of sulfur dioxide ranged around 66-80 kg/s.
On 14 July the advancing edge of the lava flow connected with the 2021 lava field in the NE part of Meradalir. The main vent was elongated and measured roughly 22-m-tall on 15 July. During 13-17 July the lava flow rate was an estimated 12.7 m3/sec, and by 18 July the total erupted volume was about 8.4 million m3. The flow advanced an average of 300-400 m per day. Flow thicknesses averaged 10 m; some areas reached 20 m. Lava filled the main cone and occasionally spilled over onto the flanks at around 2330 on 18 July. Around 0251 on 19 July, a breach was reported high on the NE rim, followed by lava that flowed down the flank. Spatter was ejected past the crater rim. Lava fountaining increased around 0259 and lava flowed short distances E. Around 0412 sections of the NW wall of the cone collapsed, which drained the crater and sent lava flows to the N and W. Around the same time, there was a significant decrease in the rate at the S-moving lava flow and by 0530 it was fully crusted over.
Lava from the main vent had grown to about 90 x 40 m during 19-26 July and continued to advance SSW, according to a VONA (figure 40). Sulfur dioxide plumes rose 1-2 km above the crater rim. Seismicity decreased since the eruption began and was mainly concentrated at the N end of the dike and to the E of Keilir. The effusion rate averaged 8 m3/sec during 18-23 July and the total erupted volume was about 12.4 million m3, based on calculations from the University of Iceland, the Icelandic Institute of Natural History, and the National Land Survey of Iceland (figure 41). The lava flow field covered an area of about 1.2 km2 (figure 42). According to a news article, part of the N crater rim collapsed just before 1200 on 24 July, which directed lava flows down a new channel, mainly to the S, but also moving E.
 |
Figure 40. A hazard map of Litli-Hrútur, part of the Fagradalsfjall volcanic system, updated on 20 July 2023 that shows the hazard area (light pink), the lava flow extent as of 18 July 2023 (dark pink), and earlier lava flow fields from 2021 and 2022 (orange). The location of the vent is marked with a red dot, and the dike propagation is highlighted by the dark blue dotted line, extending from Keilir to Meradalahnúkar. Courtesy of IMO. |
 |
Figure 41. Graphs showing the evolution of the inundated area (top), volume (middle), and effusion rate (bottom) of the lava flow from 18-23 July 2023 at Litli-Hrútur, part of the Fagradalsfjall volcanic system. By 23 July lava covered an area of 1.15 km2, had an erupted volume of 12.4 million m3, and had an effusion rate of 8 m3/s. Courtesy of IES. |
 |
Figure 42. Map showing the extent of the lava flow field for the eruption at Litli-Hrútur, part of the Fagradalsfjall volcanic system on 23 July 2023 (red) compared to the previous eruptions in 2021 (green) and 2022 (orange). The S part of the 2023 flow intersects with the previous 2022 lava flow field. Courtesy of IES. |
During 23-31 July the lava effusion rate decreased to 5 m3/sec and the total erupted volume was about 15.9 million m3. The flow field covered an area of 1.5 km2 by 31 July. During 26 July through 2 August about 150 earthquakes were recorded in the eruptive area, many of which occurred around Keilir. At 1706 on 5 August IMO lowered the ACC to Yellow (the second level on a four-color scale), noting that activity had declined during the previous few days and very minor crater activity was visible in webcam images. Tremor decreased during the previous 36 hours and reached background levels by 1500 on 5 August. Gas-and-steam plumes generally rose 1-2 km above the vent, except on 1 August, where plumes rose more than 2.5 km above the vent. According to news articles, a notable amount of gas-and-steam emissions rose from the vent on 4 August. Activity was last seen on 5 August and a thermal anomaly in the crater was last identified in satellite images on 6 August.
Satellite data. Data from the TROPOMI instrument on the Sentinel-5P satellite, available on maps from the NASA Global Sulfur Dioxide page, showed two sulfur dioxide plumes exceeding 2 DU (Dobson Units) on 11 and 23 July 2023 and drifted W and SE, respectively (figure 43). Strong thermal activity was detected in MODIS data shown on the MIROVA (Middle InfraRed Observation of Volcanic Activity) graphs showing the beginning of the eruption in early July due to lava effusion (figure 44). In late July, the power of the thermal anomalies gradually declined as activity slowed; residual heat remained low through September. Infrared satellite images also showed the start of the fissure eruption and thermal activity expanding NE and SW through July (figure 45). By early August, the lava flows began to cool.
 |
Figure 43. Two strong sulfur dioxide plumes that exceeded 2 DUs (Dobson Units) were detected above Fagradalsfjall on 11 and 23 July 2023 and drifted W and SE, respectively (left and right, respectively), based on data from the TROPOMI instrument on the Sentinel-5P satellite. Courtesy of the NASA Global Sulfur Dioxide Monitoring Page. |
 |
Figure 44. Strong thermal activity began at Fagradalsfjall in early July 2023, according to the MIROVA graph (Log Radiative Power) and continued through early August due to a new eruption characterized by lava flows and fountains. Lower, possibly residual thermal activity persisted through September. Courtesy of MIROVA. |
 |
Figure 45. Infrared (bands B12, B11, B4) satellite imagery showed the onset of a new fissure eruption at Litli-Hrútur, part of the Fagradalsfjall volcanic system on 11 (top left), 13 (top right), and 18 (bottom left) July 2023 and 2 August 2023 (bottom right). The bright yellow-orange color represents the lava flows and fountains as it expanded NE and SW throughout July. By early August, thermal activity declined and began to cool. Courtesy of Copernicus Browser. |
Geological Summary. Although the Fagradalsfjall fissure swarm has previously been considered a split or secondary swarm of the Krýsuvík–Trölladyngja volcanic system, as of September 2022 Icelandic volcanologists managing the Catalogue of Icelandic Volcanoes made the decision to identify it as a distinct separate system. The recent eruptions and related reports have been reassigned here, and other content will be prepared and adjusted as appropriate.
Information Contacts: Icelandic Meteorological Office (IMO), Bústaðavegur 7-9 105 Reykjavík, Iceland (URL: http://en.vedur.is/); Institute of Earth Sciences, Sturlugata 7 101 Reykjavík, Iceland (URL: http://www.earthice.hi.is/); Almannavarnadeildar ríkislögreglustjóra, Skúlagata 21, Reykjavík, Iceland (URL: https://www.almannavarnir.is/); Icelandic National Broadcasting Service (RUV), Efstaleiti 1 150 Rekyjavík, Iceland (URL: http://www.ruv.is/); MIROVA (Middle InfraRed Observation of Volcanic Activity), a collaborative project between the Universities of Turin and Florence (Italy) supported by the Centre for Volcanic Risk of the Italian Civil Protection Department (URL: http://www.mirovaweb.it/); NASA Global Sulfur Dioxide Monitoring Page, Atmospheric Chemistry and Dynamics Laboratory, NASA Goddard Space Flight Center (NASA/GSFC), 8800 Greenbelt Road, Goddard MD 20771, USA (URL: https://so2.gsfc.nasa.gov/); Copernicus Browser, Copernicus Data Space Ecosystem, European Space Agency (URL: https://dataspace.copernicus.eu/browser/).