Report on Rabaul (Papua New Guinea) — October 1994
Bulletin of the Global Volcanism Network, vol. 19, no. 10 (October 1994)
Managing Editor: Richard Wunderman.
Rabaul (Papua New Guinea) Tavurvur activity decreasing; its lava flow stops; minor subsidence
Please cite this report as:
Global Volcanism Program, 1994. Report on Rabaul (Papua New Guinea) (Wunderman, R., ed.). Bulletin of the Global Volcanism Network, 19:10. Smithsonian Institution. https://doi.org/10.5479/si.GVP.BGVN199410-252140
Rabaul
Papua New Guinea
4.2459°S, 152.1937°E; summit elev. 688 m
All times are local (unless otherwise noted)
"The eruption . . . continued throughout October. However, only one of the two centres initially active, Tavurvur, on the NE part of the caldera, remained in eruption. It displayed moderate Vulcanian-type activity, accompanied by the production of a lava flow. Eruptive activity at the other intra-caldera cone, Vulcan, on the W side of the bay, ended on 2 October. Thereafter, its activity was reduced to weak fumaroles and bubbling pools of water at the bottom of its new NE crater.
"Overall, the level of activity at Tavurvur progressively decreased, in spite of variations in the strength, frequency, ash content, and height of its Vulcanian explosions. Only one crater was active on the E side of the cone; up to four were active in the first few weeks of the eruption. During the first few days of October, explosive phases occurred at intervals of 30-120 seconds. They produced billowing columns rising dynamically, with large ballistic fragments, up to 400-800 m above the crater. In between, ash emission was usually continuous though less forceful. Occasionally, the vent remained free of emissions for a few minutes. A second vent on the W side of the same crater occasionally produced a darker but weaker emission, with apparently unrelated frequency. Depending on wind strength, the emission plume levelled off between 1 and 2 km height, and spread W over the town of Rabaul, the pale yellow to brown mass remaining visible for 20 km.
"Through October, the interval between explosive phases increased, though irregularly, to 1-4 minutes. Explosions were irregular in strength but rose less and less frequently to >600 m, and the ash content of the plume decreased. The visible extension of the plume also decreased to ~15 km. Longer periods of weak activity were commonly followed by larger (and louder) explosions that ejected ballistic material as far as 1.5 km from Tavurvur's summit, onto the lower slopes of the cone or into Greet Harbour. During periods of lesser ash content in the emission, these projections caused incandescent night displays (22-27 October). At times of dense ash emission, lightning occurred under and around the plume. Sound effects of the eruption were variable. Rumbling sounds were the most common and apparently louder during periods of lesser ash content in the emission. At other times, Tavurvur could be silent for a couple of hours, or even days, without noticeable change in activity. The largest explosions (like at 0640 on 14 October or 2125 on the 16th) were heard as impressive, sharp detonations up to 20 km away and their air-waves were felt up to 10 km away.
"Backfall of material around the vent progressively built a cone ~30 m high with a radius of ~80 m. Light ashfall on the town of Rabaul and beyond it on the N coast continued throughout October. The first torrential rainfalls of the pending rainy season contributed to the major destruction within the town area. Most buildings in the S and central parts of Rabaul township collapsed under the weight of 0.3-1.2 m of ash/mud. Subsequent rainfalls also caused large flash-floods of mud that temporarily cut off access roads and flooded several buildings and villages. Earthmoving equipment was used to construct drains and barriers in an attempt to alleviate destruction in the remaining parts of town from expected mudflows at the start of the rainy season in December.
"A viscous lava flow, aa to blocky in texture, began on 30 September from a source SW of the main active vent of Tavurvur. Its flow rate was extremely low and its progression slow. On 5 October, as this lobe was still moving within the lower W part of the crater, a new lobe formed and started to override it. On the 8th, an outbreak of apparently more fluid, darker lava started on the W side of the original lobe source. The two initial lobes merged together on 12 October as they started to spill over the lower side of the crater rim onto the W flank of Tavurvur cone. On the 14th, a new lobe started to form from an outbreak through the flow, near the initial source. This became the main feeder to the combined flow system, although it progressed slower and slower until 25-27 October when the flow-front stopped ~100 m below the rim of the cone, 2/3 of the way to the coast.
"The extensive pumice raft, formed as a result of the early Plinian phases and pyroclastic surges, kept drifting across the bay in response to wind shifts. At times of strong SE winds it occupied the N half of the bay, packing to thicknesses of up to 1.7 m (G. Halls, Hydrographic Surveys, Pty Ltd, pers. communication). A few hours of lull or a reversal in the trade wind, and it decompressed and spread over the SE part of the bay, only to drift back a few hours later.
"Ten of the 14 stations of the RVO seismic network were progressively disabled by volcanic products, lightning, interruption of power supply, or vandalism, within the first week of the eruption. By early October, however, in a prompt response to an RVO and PNG Government invitation, a team from the USGS Volcano Disaster Assistance Program was on-site deploying a network of 10 digitized stations with P-picker, Tom Murray's RSAM, and Willie Lee's data management systems on personal computers.
"Following the end of eruptive activity on the Vulcan side, seismicity was scattered under the whole caldera, including outside the usual annular seismic zone. A high concentration of events at Tavurvur corresponded to explosion earthquakes. The level of seismicity indicated by RSAM and the number of detected events showed a general decline, with some fluctuations, throughout the month (figure 20). Most detected events consisted of low-frequency and explosion earthquakes with delayed air-phases distinctive throughout the network.
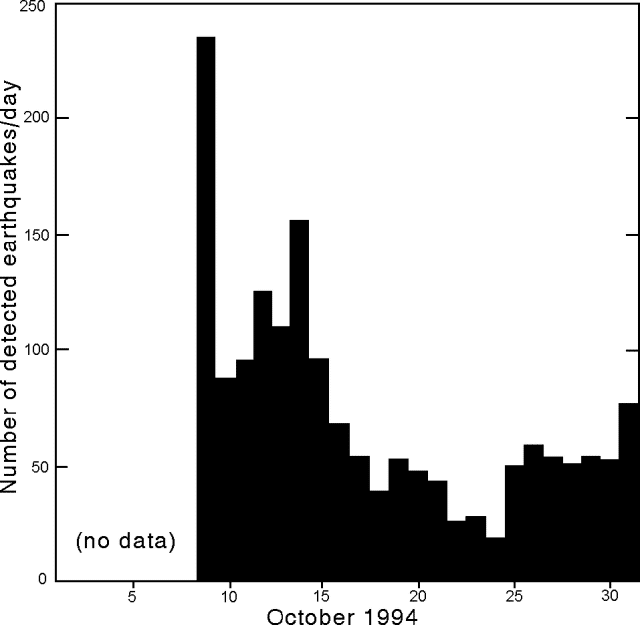 |
Figure 20. Fluctuations in the level of seismicity recorded at Rabaul, October 1994. Courtesy of RVO. |
"All real-time ground deformation monitoring (electronic tilts and tide gauges) had progressively been lost over the last few years prior to the eruption by lack of appropriate funding. From the onset of the eruption, ash density in the bay prevented EDM monitoring. For the first week thereafter the only accessible ground deformation data were from two water-tube tiltmeters on the outer caldera rim. They indicated radial deflation of the caldera, which started with the triggering earthquakes (ML 5.1) on 18 September and amounted to 30 and 37 µrad, respectively, by the end of September. By late September a few other stations had been recovered, including a dry-tilt array near the centre of the caldera at the S end of Matupit Island. In early October two electronic tiltmeters were deployed by the USGS team. Sea shore surveying around the bay resumed on 27 September, and geodetic levelling to Matupit Island on 4 October.
"All collected data revealed a caldera-wide subsidence amounting to ~1 m near the centre and 20-30 cm near the edges. The resulting bowl-shaped subsidence is, however, perturbed by the residuals of a pre-eruption uplift on the night of 18-19 September around the two pending eruptive centres, which amounted to 5-6 m on the E shore of Vulcan and 1-2 m at Tavurvur and Matupit Island. Minor caldera subsidence continued through October, although mainly affecting the central area within 3 km of Tavurvur. The maximum measured subsidence amounted to 20 cm at the Tavurvur tide gauge, near the long-recognized apex of ground deformation, with progressively decreasing rates from ~1.5 to 0.4 cm/day. Simultaneously, the Matupit Island tiltmeter recorded a deflation of >110 µrad, radial to the same centre of deformation, at a slowly decreasing rate (figure 21)."
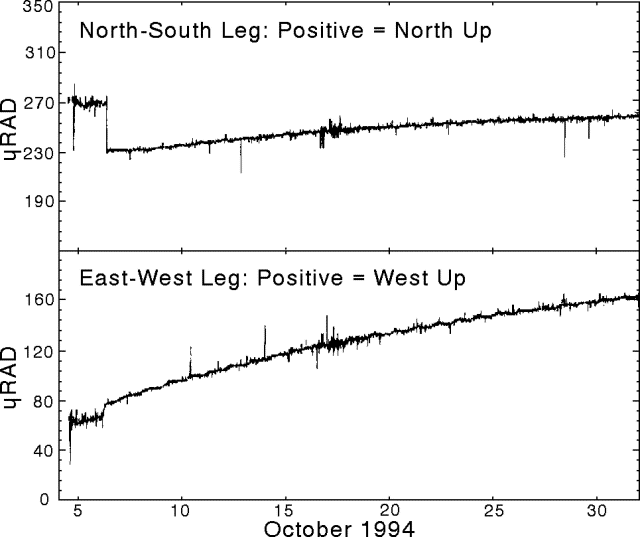 |
Figure 21. Changes recorded by the Matupit Island tiltmeter, October 1994. Although an upward trend is seen on the plot, the change reflects a steady deflation of the central part of the caldera. Courtesy of RVO. |
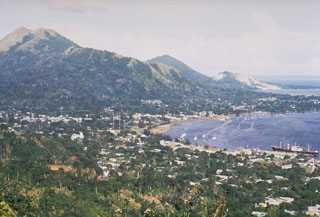
Geological Summary. The low-lying Rabaul caldera on the tip of the Gazelle Peninsula at the NE end of New Britain forms a broad sheltered harbor utilized by what was the island's largest city prior to a major eruption in 1994. The outer flanks of the asymmetrical shield volcano are formed by thick pyroclastic-flow deposits. The 8 x 14 km caldera is widely breached on the east, where its floor is flooded by Blanche Bay and was formed about 1,400 years ago. An earlier caldera-forming eruption about 7,100 years ago is thought to have originated from Tavui caldera, offshore to the north. Three small stratovolcanoes lie outside the N and NE caldera rims. Post-caldera eruptions built basaltic-to-dacitic pyroclastic cones on the caldera floor near the NE and W caldera walls. Several of these, including Vulcan cone, which was formed during a large eruption in 1878, have produced major explosive activity during historical time. A powerful explosive eruption in 1994 occurred simultaneously from Vulcan and Tavurvur volcanoes and forced the temporary abandonment of Rabaul city.
Information Contacts: C. McKee and P. de Saint-Ours, with additional contributions fromRVO Staff, RVO; T. Murray, A. Lockhart, and E. Endo, CVO; R. Johnson, AGSO; H. Davies, Univ of Papua New Guinea.