Report on Soufriere Hills (United Kingdom) — October 1996
Bulletin of the Global Volcanism Network, vol. 21, no. 10 (October 1996)
Managing Editor: Richard Wunderman.
Soufriere Hills (United Kingdom) The new dome, first observed on 1 October, continues to grow
Please cite this report as:
Global Volcanism Program, 1996. Report on Soufriere Hills (United Kingdom) (Wunderman, R., ed.). Bulletin of the Global Volcanism Network, 21:10. Smithsonian Institution. https://doi.org/10.5479/si.GVP.BGVN199610-360050
Soufriere Hills
United Kingdom
16.72°N, 62.18°W; summit elev. 915 m
All times are local (unless otherwise noted)
The following condenses the weekly Scientific Reports of the Montserrat Volcano Observatory (MVO) for the period 1 October-2 November.
As this isue was being finalized in late November, observations of cracks on Galway's Wall caused concern that failure of the crater wall could lead to a catastrophic event.On the afternoon of 26 November the area SW of the volcano was upgraded to risk zone A. This zone extends from S of O'Garra's to Gingoes Gaut. The alert level was also raised to Amber. Additional details will be provided next month.
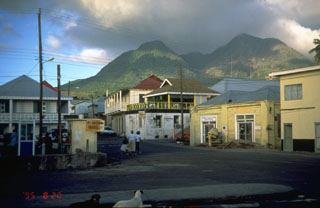
Visual observations. Clear weather from 1 to 4 October allowed excellent views of a new lava dome (figure 12) growing in the scar left by the 17-18 September explosion (BGVN 21:09). This new dome was light gray in color with a blocky texture and without spines. It developed a flat-topped, steep-sided, solid cap, apparently raised up intact by later endogenous growth. As it grew from 782 to 793 m during 1-2 October, it's base expanded southward to fill the bottom of the scar.
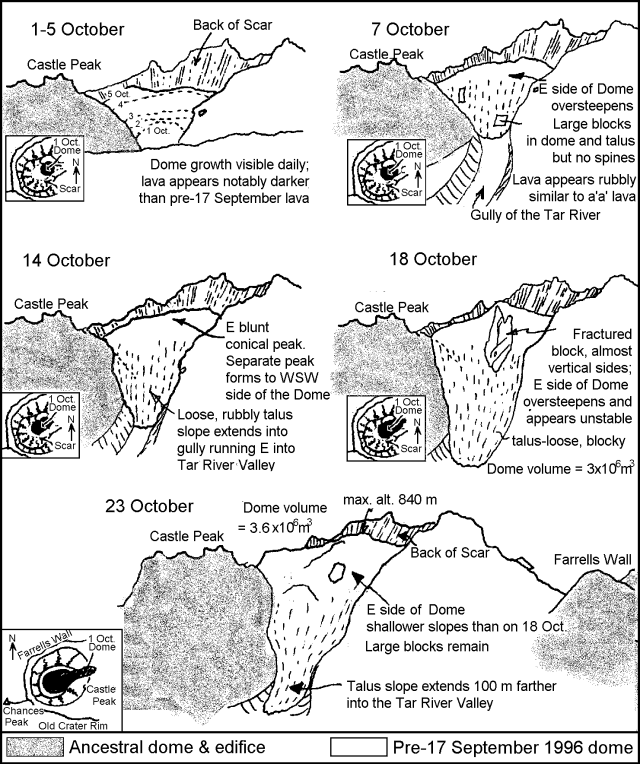 |
Figure 12. Growth of the new lava dome at Soufriere Hills during 1-23 October 1996. View is from the ENE. Courtesy of MVO. |
On 7 October the dome was ~75% of the height of Castle Peak dome and appeared to be growing as a single cohesive mass. By 8 October the SE side of the new dome was quite steep and several rockfalls were originating from the base of the E face. On 10 October the new dome was higher than the top of Castle Peak. It had expanded laterally, filling ~25% of the large scar. The dome was a chocolate-brown color, had an even surface, and a nearly rounded conical shape. Several small rockfalls from the flanks and vigorous steaming from all around the base were also observed.
Observations on 11 October revealed regular small cascades of incandescent material from both shoulders of the E face of the dome. During the daytime rockfalls were visible from the coast at the mouth of the Tar River. On 14 October peaks were observed on both the dome's SW and E sides, giving it a blocky morphology, more similar in appearance to previous domes. A small stubby spine was noted on 15 October, but it disappeared by the following day.
After mid-October there was an increase in the number of reported ash clouds. Although these ash clouds were small, reaching no more than 650 m above the crater area, their occurrence suggested a less stable dome surface. A bathymetric survey of the delta, carried out by boat on 16 October, revealed a steep termination, reaching depths of 20 m within a short distance of the shore.
On 18 October it was seen that the dome had grown rapidly on its N side and expanded toward the W, covering most of the scar floor. The E face was quite steep, with several unstable-looking blocks at the top of the slope; small rockfalls were observed from it whenever the clouds lifted.
The height of the dome had increased to 829 m by 22 October (from 808 m on 18 October). Rockfalls were occurring from the N side of the scar and vigorous steaming was observed from the S of the dome. On 23 October some moderate-sized rockfalls produced small ash clouds; the collapse of a small spine was observed and new growth was seen on the S side of the E face of the dome (figure 12).
On the morning of 29 October several rockfalls from the E face of the dome occurred during and after a thunderstorm, and produced small ash clouds. The deposits from these rockfalls went farther down the Tar River valley than any previous rockfalls since the 17-18 September explosion. On 1 November, new deposits suggested that some parts of the E face had collapsed. Other changes to the dome were limited to a general increase in the height, and the appearance of a small stubby spine on its top. On 2 November a new area of activity was observed NW of the new dome, on the edge of the scar. This area was steaming and degassing vigorously, and seemed to be deformed, suggesting a new intrusion was taking place.
Seismicity. Seismicity remained low, a pattern established following the explosion of 17-18 September. Rockfall signals were the dominant events for the first half of the month, whereas volcano-tectonic and long-period earthquakes became more frequent after mid-October. The long-period signals were often associated with observed rockfalls, but were possibly due to some internal dome process (gas expansion?) associated with collapse of the dome. These signals were similar to isolated tremor episodes observed during dome growth at Unzen in Japan.
The first volcano-tectonic swarms occurred from 2200 on 17 October to 0430 on 18 October, and from 1300 on 18 October to 0130 on 19 October. Most locations were shallower than 1 km, and the signals showed extended long-period codas at some stations, consistent with very shallow hypocenters. The two deepest earthquakes were located respectively at ~6 km under Roaches Yard, and at ~15 km, 4 km E of the crater. From 21 October the volcano-tectonic earthquakes occurred in swarms of variable duration and return times. Only a few volcano-tectonic earthquakes were recorded outside of the swarm episodes: one event on 22 October was located at a depth of 5 km to the N of the crater and two events were ~2 km beneath St Georges Hill.
The largest volcano-tectonic swarm (in terms of total numbers of events and duration) recorded since the start of dome growth occurred on 1 November and lasted until 2031 on 02 November (413 events) (figure 13). Many of these events were large enough to be located, and mostly occurred at shallow depths (>2 km). This swarm included a set of deeper events at 3-4 km beneath the crater. Similar swarms occurred in the weeks prior to the 17-18 September explosion, although they were of shorter duration, occurred more frequently, and lacked deeper earthquakes.
 |
Figure 13. Time and depth of volcano-tectonic events at Soufriere Hills as recorded during 27 October-2 November. Courtesy of MVO. |
The level of tremor was low; Gages station continued to record intermittent tremor. Higher tremor levels were often associated with increased steam venting and as a result of heavy rainfall.
EDM, COSPEC, dome volume, and other measurements. EDM measurements on the lines of the E triangle had the following results: Whites-Castle Peak line shortened by 8 mm (7-8 October), lengthened by 6 mm (8-10 October), and shortened by 2.5 cm (10-19 October); Long Ground-Castle Peak shortened by 3.4 cm (10- 19 October). All the E triangle's lines shortened by 3-4 mm (19-22 October) and by 9 cm ( 23 October-2 November). This was consistent with the long-term trend of line shortening at a rate of 1 cm/day, maintained since mid-July 1996.
For the S triangle, the Galways-Castle Peak line lengthened by 1.8 cm (6-19 October) in its second successive lengthening. For the N triangle, the St George's Hill-Farrells and Windy Hill-Farrells lines lengthened by 3 and 5 mm, respectively, on 21 October, and by 12.5 and 3 mm during 21-26 October. These lines have been quite erratic, but show long-term trends of little or no change. Measurements were also made between the Tar River Estate House and Castle Peak on 28 October, the first time this line was measured since 25 August. The original reflector was destroyed during the 17-18 September explosion, and so the line length could not be compared to previous measurements. Radial W-flank lines were measured on 1 November, between Upper and Lower Amersham, and Dagenham and Chances Steps. Most of these lines were stable, except for the line between Upper and Lower Amersham, which showed an irregular ± 5 cm variation, with no consistent change.
COSPEC measurements were carried out on 10 days in October (13, 15, 17, 21, 23, 24, 26, 27, 28, 31) and on 2 November. All the COSPEC measurements were made by running traverses beneath the volcanic plume along the W coast road. The average flux readings were 550, 650, 1110, 580, 449, 1519, 290, 434, 498, 311, and 267 metric tons/day, respectively. The values over 1,000 t/d obtained on 17 and 24 October were the highest recorded since the beginning of the volcanic crisis.
Three GPS surveys revealed that changes in slope length have not been significant at the 95% confidence level, with all variations within two sigma of the measurement error. This indicates the absence of a widespread deformation field associated with the eruption.
Range-finding binoculars and GPS equipment enabled investigators to estimate the dome's recent effusion rate as 1.8 m3/s. The estimated volumes were the following: 2.0 x 10⁵ m3 (2 October); 4.7 x 10⁵ m3 (3 October); 1 x 10⁶ m3 (10 October); 3 x 10⁶ m3 (18 October); and 3.7 x 10⁶ m3 (23 October).
Results of gas analysis of the Galways Soufriere carried out on 4 July were received from the Volcano Observatory in Guadeloupe. There were no significant changes in gas composition compared with earlier samples; the gas was dominated by CO2 (60%) and H2S (39%).
Geological Summary. The complex, dominantly andesitic Soufrière Hills volcano occupies the southern half of the island of Montserrat. The summit area consists primarily of a series of lava domes emplaced along an ESE-trending zone. The volcano is flanked by Pleistocene complexes to the north and south. English's Crater, a 1-km-wide crater breached widely to the east by edifice collapse, was formed about 2000 years ago as a result of the youngest of several collapse events producing submarine debris-avalanche deposits. Block-and-ash flow and surge deposits associated with dome growth predominate in flank deposits, including those from an eruption that likely preceded the 1632 CE settlement of the island, allowing cultivation on recently devegetated land to near the summit. Non-eruptive seismic swarms occurred at 30-year intervals in the 20th century, but no historical eruptions were recorded until 1995. Long-term small-to-moderate ash eruptions beginning in that year were later accompanied by lava-dome growth and pyroclastic flows that forced evacuation of the southern half of the island and ultimately destroyed the capital city of Plymouth, causing major social and economic disruption.
Information Contacts: Montserrat Volcano Observatory (MVO), c/o Chief Minister's Office, PO Box 292, Plymouth, Montserrat (URL: http://www.mvo.ms/).