Report on Soufriere Hills (United Kingdom) — November 1996
Bulletin of the Global Volcanism Network, vol. 21, no. 11 (November 1996)
Managing Editor: Richard Wunderman.
Soufriere Hills (United Kingdom) Cracks and landslides on SW wall cause major concern
Please cite this report as:
Global Volcanism Program, 1996. Report on Soufriere Hills (United Kingdom) (Wunderman, R., ed.). Bulletin of the Global Volcanism Network, 21:11. Smithsonian Institution. https://doi.org/10.5479/si.GVP.BGVN199611-360050
Soufriere Hills
United Kingdom
16.72°N, 62.18°W; summit elev. 915 m
All times are local (unless otherwise noted)
The following condenses the weekly Scientific Reports of the Montserrat Volcano Observatory (MVO) for the period 2 November-8 December 1996.
Visual observations. At the beginning of November growth concentrated in the central W part of the 1 October dome, which lies in Englishs crater N and adjacent to Castle Peak, an ancestral dome. The new dome's height was measured at 880 m on 5 November; the same day a new spine was noted on its SW side. Rainfall and a lack of vegetation contributed to a 6 November landslide on the S flank of the crater, above Galway's Soufriere (figure 14). On 7 November incandescent material was seen on the top and N edge of the 1 October dome. The spine first seen on 2 November increased in height and partially collapsed by 9 November. On that day, large amounts of steam were observed over the dome complex especially in the S part at the contact with the Castle Peak dome; several small gullies from recent rockfalls were also seen on the N part of the 1 October dome.
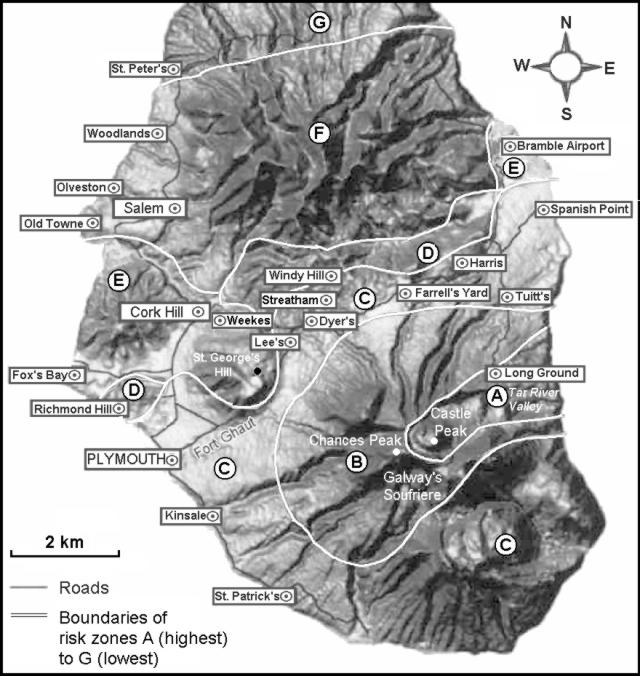 |
Figure 14. Volcanic risk map of Montserrat, 1 October 1996. English's Crater contains Castle Peak (an old dome) and new domes from this eruption; Chances Peak is the high point on the crater rim, and other sections of the crater wall are named for adjacent geographic features (Galway's Wall, Farrells Wall, etc.). Modified from a map provided courtesy of the Montserrat Reporter. |
Throughout the second week of the month there was intense steaming from the area around Castle Peak. On the ediface's SW side, heavy rains caused more rock slides on the SW face of Galway's Wall and its upper reaches appeared thin and unstable. On 14 November blocky light gray lava extruded on the dome's N flank, and on its S side it bulged.
On 17 November there were two rockfalls from the N side of the dome and the subsequent small pyroclastic flows were channeled down the canyon's E side. For the first time since the start of the 1 October dome growth, these rockfalls extended ~500 m from the dome, beyond the slope's break at the base of Castle Peak.
Late on 21 November, the new growth areas on the 1 October dome were clearly distinguishable as zones of continuous glow and occasional falls of glowing material mainly from the N and NE faces of the dome, and at times from the NW. Many of the rockfalls emanated from close to the top of the dome, just below several new small spines. On 22 November, the 1 October dome was seen clearly from the NW of the volcano for the first time. The dome was pale gray in color and blocky, in contrast with its scoriaceous, smoother, chocolate-brown appearance in October. Steam escaped at both the SW rim of the September 17-18 explosion scar, and to the W of the active dome.
On 23 November, several vertical cracks on Galway's Wall (SW section of the crater wall) appeared longer than before, extending down much of the face. The lava dome and talus had piled up behind this wall to a depth of ~120 m, with only ~30 m of wall remaining above it.
Growth during the last two weeks of November was predominantly in the N and SW sectors of the 1 October dome, resulting in flattening of the top of the dome into a broader plateau with no change in height. The volume of the 1 October dome was estimated as 4.47 x 10⁶ m3 (dense rock equivalent: DRE) on 24 November and 4.65 x 10⁶ m3 (DRE) by 1 December. This is equivalent to a mean extrusion rate of 47,500 m3/day, significantly less than the 86,250 m3/day estimated for the period 7-24 November. The active NE face of the dome fed two erosive chutes. About 180,000 m3 (DRE) of material was added to the developing talus fans associated with the new dome.
On 26 November, Galway's Wall showed signs of considerable weakening with a series of fractures visible on the wall surface, and talus from small rock avalanches on the inner and outer portions of the wall. The wall was largely composed of interbedded lithified talus and block-and-ash deposits from prehistoric eruptions, cross-cut by ~2-m-wide lateral sills and an anastomosing dike (~3 m wide). The base of the wall largely consisted of relatively thinly bedded tuffs dipping toward the center of English's Crater.
On the morning of 27 November, a large rockfall from Galway's Wall dislodged ~150,000 m3 of material. This avalanche traveled as far as the break in slope, ~300 m from the crest of the wall. Some small pyroclastic flows were also generated on 27 November; they reached a maximum runout of 800 m. Overnight on 27 November, heavy rainfall swept up old pyroclastic-flow material in the Tar River valley and landslide material in the White River and generated lahars. In the meantime, collapses from the 1 October dome caused small pyroclastic flows. Extremely limited dome growth took place in late November.
On 29 November a new series of NW-SE fractures dipping steeply E was observed on Galway's Wall. On 1 December two vertical fractures, trending ~60°, were seen E of Chances Peak near the intersection with Galway's Wall. These large fractures were >50 cm wide and extended at least a few meters below the surface of the wall.
Rockfall activity from Galway's Wall (both on the inner and outer walls) accelerated in association with an intense volcano-tectonic earthquake swarm from 30 November to 8 December. As a result, at least two more avalanches similar to that of 27 November occurred, along with many smaller events. Coarser rockfalls were associated with avalanching from the central portion of the wall.
Seismicity. A swarm of volcano-tectonic earthquakes on 1-2 November marked the most intense period of activity since dome growth began in November 1995 (BGVN20:10); it was also the only swarm during the current activity with hypocenters deeper than 3 km. All the other earthquakes in the November swarms were <2 km beneath the crater. The week of 2-9 November was also dominated by a swarm of volcano-tectonic earthquakes (389 events). Another swarm (212 events) began on 9 November and lasted until 12 November. Shorter swarms of volcano-tectonic earthquakes occurred on 14 November (40 events), and on 19-20 November (53 events). Apart from these swarms, volcano-tectonic activity was limited to occasional single earthquakes during the rest of November.
The number of rockfall signals increased during 20-24 November, but the level of activity was still much lower than that in the months prior to the September 17-18 explosion. Rockfall activity returned to a low level by 26 November.
A strong inverse correlation between dome rockfalls and the shallow volcano-tectonic swarm activity was observed. Dome rockfalls were not completely absent during seismic swarms, but some may have been due to strong shaking of the unstable dome. On 28 November strong, continuous seismic signals were recorded at most stations in the seismic network. The signals were caused by pyroclastic flows in the Tar River Valley and debris flows along Tar River, White River, and Fort Ghaut.
A correlation between Galway's Wall landslides and seismic signals enabled retrospective identification of previous large landslides: the strong shaking caused by volcano tectonic events triggered landslides on Galway's Wall. Using this criterion, rock avalanches from the Galway's Wall were found to have occurred since at least as early as 24 October, but the largest of these by far occurred on 4 November. No landslides were recorded during the intense seismicity on 1 and 2 November.
The largest volcano-tectonic earthquake swarm recorded since [the start of the eruption] began on 30 November and ended abruptly on 8 December (figure 15). In that time, 1,671 earthquakes were recorded. Figure 14 shows data on the volcano-tectonic activity between 23 November and 8 December as well as the amplitudes of individual events at the Gages seismic station, which was closest to the activity. The plot of amplitude logarithm (proportional to the magnitude) shows that the size of the largest events slowly increased during this swarm. Some of the larger events (M ~3) were felt by residents of Weekes, the closest occupied area, on the NW side of St. Georges Hill (figure 14). A bimodal pattern to the magnitudes was observed, with small earthquakes (M ~1) dominating. During the increase of activity up until 5 December, the number of small earthquakes increased with time, while the number of large ones remained almost constant. This meant that the b-value of the earthquake distribution increased, although these earthquakes clearly did not follow a classical magnitude-frequency relationship.
 |
Figure 15. Volcano-tectonic earthquake activity recorded by the broad-band seismic network at Soufriere Hills. Courtesy of MVO. |
MVO scientists postulated that the volcano-tectonic earthquakes were caused by pressurized magma at shallow depths. When the magma outlet becomes periodically blocked, a slow down of the dome growth and reduction in rockfalls occur. In the meantime the high-pressure build-up causes rock fracturing around the magma body. If the magma behaves as a non-Newtonian fluid it requires a certain pressure to yield and flow. The correlation between Galway's Wall landslides and the volcano-tectonic swarms suggests that magma pressurization is increasing the stress on the base of the wall. The occurrence of deeper earthquakes at the start of this phase of activity (mid-October) and during the increased activity of 2 November, suggests that the current phase is a response to some deeper volcanic activity, possibly injection of fresh magma.
Ground deformation. EDM measurements made on the E triangle (Long Ground-White's-Castle Peak) between 4 and 8 November were consistent with the recently established shortening trend of ~6 mm/day. The shortening trend on the E triangle continued during the second week of the month, although its rate slowed to ~5 mm/day. Between 18 and 30 November, the lines shortened ~6 mm/day. The last measurement on 4 December showed 3.8 cm shortening over a four-day period, a significant rate increase.
The N triangle (Upper Farrell's-St. Georges Hill-Windy Hill) was measured on 5 November. The lines from Windy Hill and St Georges Hill to Upper Farrell's shortened by 3 mm and 8 mm, respectively, since these were last measured on 27 October. These lines are quite erratic, and show long-term trends of little or no change. The Galway's-Castle Peak line (S triangle) was remeasured on 2 December, following replacement of the EDM reflector on Chances Peak. A line shortening of 2.6 cm since 19 October was recorded, a rate higher than the previous trend on this line.
EDM measurements on the W flank of the volcano on 7 November showed that the line lengths between Upper and Lower Amersham (near Plymouth) shortened by 1 mm since November 1, whereas those between Lower Amersham and Chances Peak lengthened by 5 mm during the same period, without following any particular trend.
Deformation data suggested that movements are confined to the upper flanks and are thought to be due to loading of the upper part of the edifice by the new dome, and localized thermal expansion and pressurization of the magma conduit at shallow depths.
GPS measurements on 3, 6, 16, 23, 25, 26, and 27 November and 5 and 7 December indicated that all line lengths and station heights did not undergo major changes and remained within the 95% confidence level of their long-term means. Only radial lines to the Farrell's benchmark high on the N flank of the volcano showed signs of movement, although within formal errors.
A dome-volume survey was made on 7 November using GPS equipment and range-finding binoculars. The volume estimate was, within error, the same as that obtained from the previous survey on 23 October (BGVN 21:10).
Gas, ash, and rainwater measurements. COSPEC measurements were carried out on nine days in November (3, 5, 10, 11, 13, 14, 16, 18, and 19). All COSPEC measurements were made by running traverses beneath the plume along the W coast road. The average flux readings were 371, 155, 240, 227, 178, 243, 176, 363, and 250 metric tons/day, respectively. These values are similar to recent measurements, indicating that only low amounts of sulfur dioxide are emitted from the volcano during periods of dome growth. Daily fluctuations do not suggest any strong link between SO2 production and earthquake swarms. Analysis of SO2 diffusion tubes at five sites W of the volcano showed that the averaged concentrations of SO2 correlated with the COSPEC measurements.
Rainwater samples collected on 4 November from Upper Amersham, the site closest to the volcano, showed the lowest pH (3.3) recorded. Rainwater collected N and W of the volcano on 10 and 14 November showed continuation of the highly acidic rainfall, particularly W of the volcano. A sample from a pond in the upper Amersham area showed very high levels of chloride. Rainwater samples analyzed for the period 14 to 17 November had low pH values (3.0 to 3.6), with the exception of Weekes, which was neutral.
Hazard assessment. The alert level was raised from Amber to Orange early in the morning of 28 November because of the increased instability of Galway's Wall and fears that catastrophic collapse of the wall might cause a lateral blast. The risk map in effect during October (figure 14) was modified on 26 November because of the increased risk to St. Patricks and surrounding areas on the volcano's SW side. On 3 December, complete closure of zones A to D was recommended as a temporary measure, because the scientific team thought that a larger collapse was possible. Such an event would involve more of the S part of the crater wall, potentially causing major dome instability and pyroclastic flows in any direction. This change was formalized on 5 December with a temporary revision of the risk map, which included all of the S of the island, from Foxes Bay across to Spanish Point, within zone A/B.
Geological Summary. The complex, dominantly andesitic Soufrière Hills volcano occupies the southern half of the island of Montserrat. The summit area consists primarily of a series of lava domes emplaced along an ESE-trending zone. The volcano is flanked by Pleistocene complexes to the north and south. English's Crater, a 1-km-wide crater breached widely to the east by edifice collapse, was formed about 2000 years ago as a result of the youngest of several collapse events producing submarine debris-avalanche deposits. Block-and-ash flow and surge deposits associated with dome growth predominate in flank deposits, including those from an eruption that likely preceded the 1632 CE settlement of the island, allowing cultivation on recently devegetated land to near the summit. Non-eruptive seismic swarms occurred at 30-year intervals in the 20th century, but no historical eruptions were recorded until 1995. Long-term small-to-moderate ash eruptions beginning in that year were later accompanied by lava-dome growth and pyroclastic flows that forced evacuation of the southern half of the island and ultimately destroyed the capital city of Plymouth, causing major social and economic disruption.
Information Contacts: Montserrat Volcano Observatory (MVO), c/o Chief Minister's Office, PO Box 292, Plymouth, Montserrat (URL: http://www.mvo.ms/); The Montserrat Reporter, Plymouth, Montserrat (URL: http://www.tiac.net/users/wcwdaj/reporter/reporter.htm).