Report on Toya (Japan) — June 2000
Bulletin of the Global Volcanism Network, vol. 25, no. 6 (June 2000)
Managing Editor: Richard Wunderman.
Toya (Japan) Eruption decreasing in intensity; precursors to 31 March eruption
Please cite this report as:
Global Volcanism Program, 2000. Report on Toya (Japan) (Wunderman, R., ed.). Bulletin of the Global Volcanism Network, 25:6. Smithsonian Institution. https://doi.org/10.5479/si.GVP.BGVN200006-285030
Toya
Japan
42.544°N, 140.839°E; summit elev. 733 m
All times are local (unless otherwise noted)
Usu's multi-vent NW-flank eruption that began on 31 March 2000 continued until at least 10 July (see previous report and map in BGVN 25:03). By 10 July the eruption had lost considerable vigor. The last noteworthy ash fall took place on 6 April; a small one occurred on 7 April. Several excellent reports were published rapidly by the Geological Survey of Hokkaido (GSH, 2000a, b). This article provides a summary of those Japanese-language reports as well as excerpts from a formal statement discussing Usu's behavior through 10 July. Satellite imagery also provided ashfall data. The active dome and associated vent group was incorrectly spelled "Konpira-yama" in previous Bulletin reports. According to formal rules of translation this name should be "Kompira-yama."
Prior to the eruption, geological mapping and bore holes had delineated portions of Usu's edifice and surrounding subsurface, enabling workers to draw a generalized cross section (figure 22). In addition to these background studies, as Usu entered an eruptive phase on 31 March a comprehensive suite of monitoring instruments were in place.
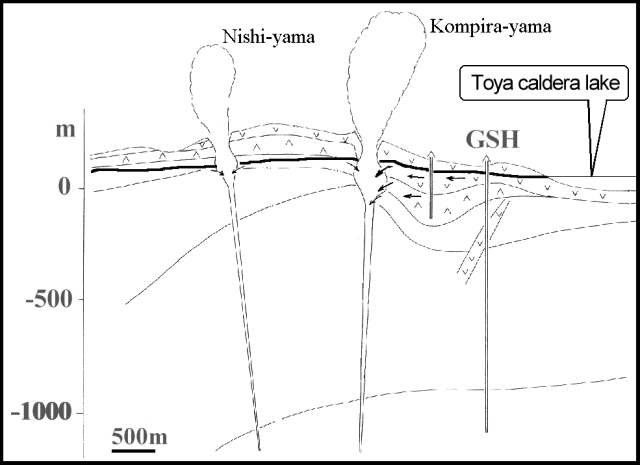 |
Figure 22. A schematic cross section across the flank of Usu showing boreholes, subsurface rock units (unlabeled), and areas of the two active vent groups with their plumes. The schematic illustrates the inferred zone of phreatic eruptions, estimated at 200-1000 m in depth. The groundwater surface was drawn as the distinctly heavier line connecting to the Toya lake on the right and at a depth of a few tens of meters above the "0" datum on the left). Arrows show the idealized paths of groundwater moving through the rock. After GSH (2000a, b). |
Four days prior to the eruption, groundwater levels in instrumented wells (the potentiometric surface) around the volcano began to change (figure 23). A day or two later, these perturbations escalated rapidly. Data from five wells (figure 23) show that at least four underwent roughly synchronous offsets that grew to reach the 2- to 10-m range. These dramatic offsets were inferred to have been driven by the influx of magma. Also, water temperatures increased at hot springs. The level of the groundwater surface in the instrumented wells peaked near the time the eruption started. For the wells with post-eruptive data on figure 23, the groundwater surface began a comparatively gradual steady decrease soon after the eruption started. Ancillary details on well locations and behavior appear in the cited reports.
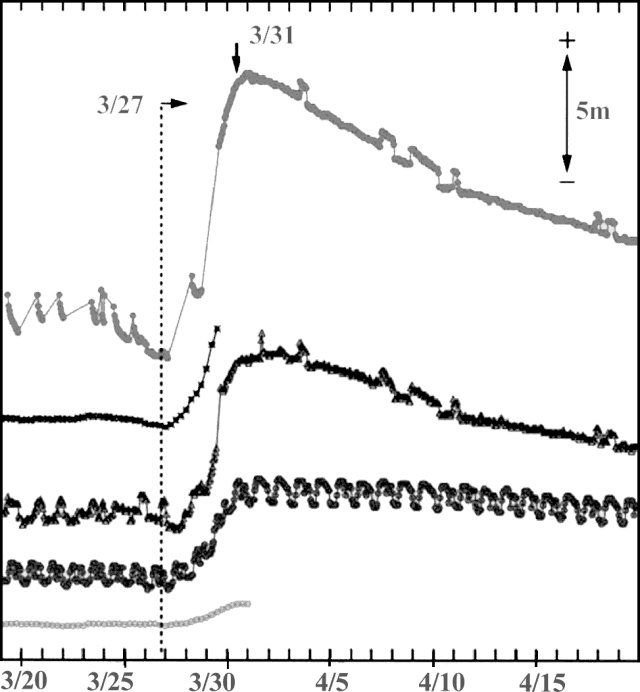 |
Figure 23. Perturbations to the groundwater surface level in monitored water wells around the time of the initial Usu eruptions; common vertical scale bar at upper right shows relative magnitude of displacement with strong offset beginning around 27 March 2000. Small arrow labeled "3/31" indicates the point of initial eruption (31 March 2000). After GSH (2000a, b). |
Global Positioning System (GPS) data helped predict the 31 March eruption. GPS station KMK is near Hokkaido's N coast and ~7 km E of Usu's active vent groups. KMK was compared with three other stations near Usu beginning around 30 March (figure 24). The comparison revealed large vertical motions-tens of centimeters per day- including some beginning on 29 March (not shown). Figure 24 shows how the rates of vertical motion declined in early April at all three close-in stations. The reports also noted horizontal motions measuring tens of centimeters per day.
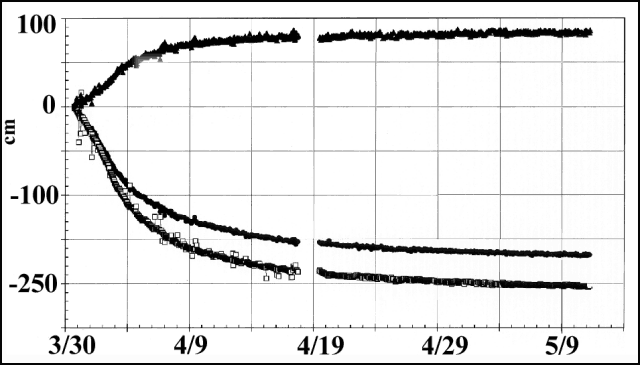 |
Figure 24. Relative vertical position of the land surface near Usu during 30 March-9 May 2000. The comparison is between three close-in GPS stations with respect to station KMK, ~ 7 km E of the Kompira-yama and western Nishi-yama vent groups. After GSH (2000a, b). |
Clear precursory seismicity appeared at Usu (figure 25). The maxima, ~150 earthquakes in a 2-hour interval (i.e., ~75 earthquakes/hour), occurred ~1 day prior to the eruption. The eruptive pulses on 1 April took place during an interval with comparatively low seismicity.
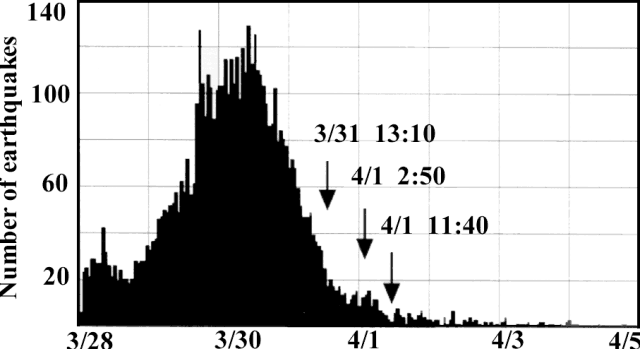 |
Figure 25. Seismic overview of Usu for 28 March to 7 April 2000 portraying multifold increases in the number of earthquakes prior to the 31 March eruption. Bars are for 2-hour intervals with the maximum values representing ~75 earthquakes/hour. The arrows indicate the date of the first three eruptions of the episode. For comparison, the perturbations of hydraulic head were strongest during 27-31 March. After GSH (2000a, b). |
Figure 26 provides a graphical summary of the episode's eight modest but identifiable ash falls. Most of the ash blew E, but an eruption on 1 April blew SE and one on 4 April blew N. GSH (2000a) features a time line for the two vent groups in eruption, graphically portraying 31 March-7 April plume observation. Figure 27 presents a sample of this larger time line: the portion for 1 April 2000. Figures such as this provide a particularly apt summary of complex phenomena.
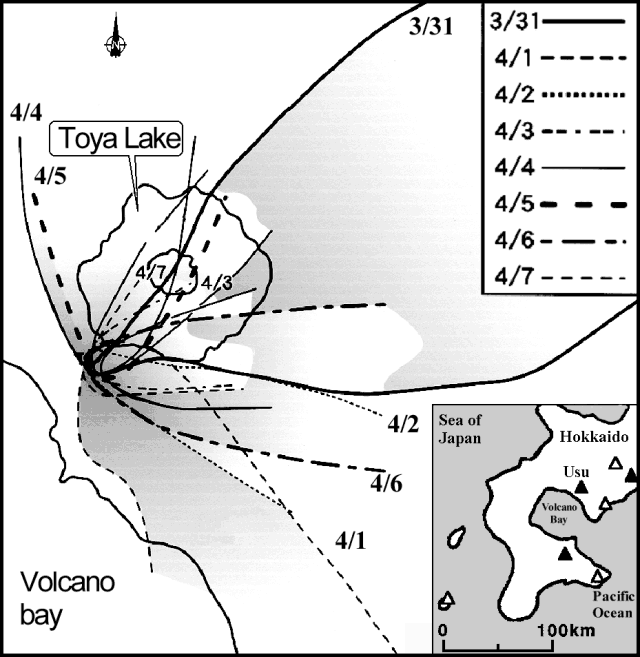 |
Figure 26. Limits of ash fall distribution seen for Usu's outbursts (31 March-7 April 2000). The date convention is month/day. After GSH, 2000a, b. |
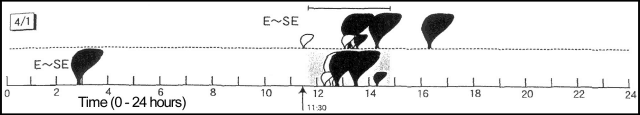 |
Figure 27. A time line of activity at Usu on 1 April 2000 portraying the character of eruptive plumes from the Kompira-yama (upper line) and western Nishi-yama (lower line) vent groups. Plume symbols are shown in two sizes and colors, representing larger (>1-km-tall), smaller (< 1-km-tall), black, and white plumes. The shaded area bracketed by a solid line above (about 1145-1545) indicates an interval of dominantly visual plume observations. The arrow at 11:30 represents the time of onset for an eruption. The given compass directions (eg., E~SE) indicate the direction of ashfall from the vent groups. The original full-length version (31 March-7 April, in Japanese) includes numerous other notes and comments. After GSH (2000a). |
Committee's announcement. The Usu eruption committee chaired byYoshiaki Ida made a formal announcement on 10 July. They noted that on this date Usu's phreatic eruption continued at the Kompira-yama and western Nishi-yama vent groups, but the supply of magma from depth had almost ceased. Accordingly, they anticipated a gradual decrease in volcanism.
The committee indicated that the current eruption occurred due to upward movement of magma from depths of ~10 km reaching a shallow reservoir around 4-5 km. Portions of the shallow reservoir traveled NW and then to the vents where magma escaped. The committee noted that on 10 July uplift still continued at western Nishi-yama (~5 cm/day) but that its areal extent and rate were decreasing. The committee noted that by 10 July small faults associated with the eruption ceased moving. They appeared as visible fault traces cutting across roads and other infrastructure (see photos in GSH, 2000a, b).
The committee also noted that the early phases of the eruption had ejected portions of juvenile material, whereas by 10 July the eruptions mainly discharged steam. Similarly, with time, cloud height and explosive vigor decreased. On 10 July Nishi-yama still gave off intermittent weak ash; Kompira-yama still emitted loud blasts with glowing volcanic rocks. But by this time such activities had decreased and ballistic bombs continued to fall several hundred meters from the Kompira-yama vent group. Earthquakes continued on the SW flank of Usu, but by 10 July they became increasingly scarce. The committee suggested a pyroclastic surge was unlikely in the near future .
Satellite imagery. A satellite image from 3 April shows Usu's ash blanketing parts of the largely snow-covered landscape (figure 28). The image caption states that the team planned to image Usu every 3-4 days. The images were captured on ASTER (The Advanced Spaceborne Thermal Emission and Reflection Radiometer), a Japanese-built instrument that obtains high-resolution (15-90 m2/pixel) images at 14 wavelengths from visible to thermal infrared. ASTER registers land surface temperature, emissivity, reflectance, and elevation; it flies on the Terra platform where it serves as a zoom lens for the other Terra instruments. ASTER has the ability to change viewing angles, enabling it to make stereoscopic images and detailed terrain height models. NASA terms the Terra satellite the flagship of the EOS mission. The latter is an effort to better understand planet Earth's atmosphere, land, and oceans, as well as their interactions with solar radiation and with one another.
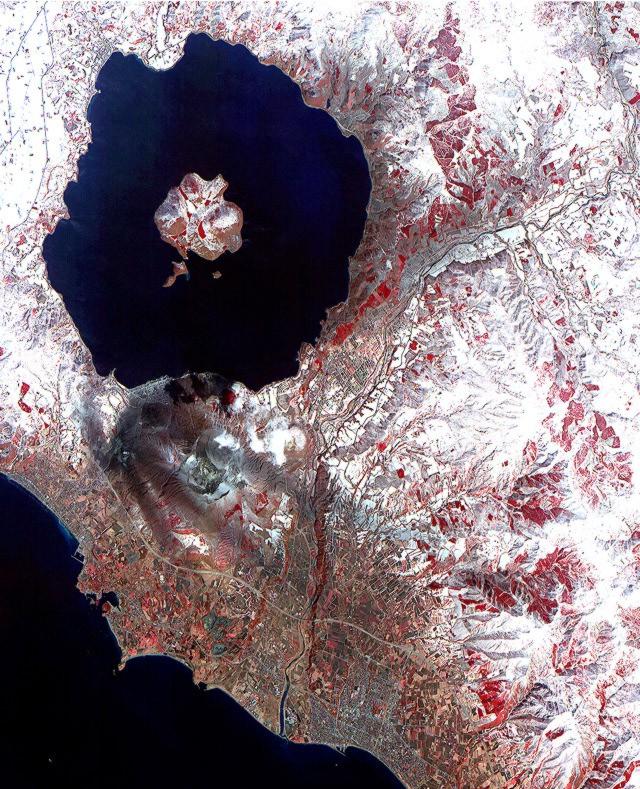 |
Figure 28. A false-color image taken on 3 April by the Terra satellite's ASTER instrument showing the ash-darkened snow resulting from complex eruptions at Usu volcano's multiple vents. N is towards the top of the image. Usu and many of the visible deposits lie immediately S of Lake Toya, a circular 10-km-diameter caldera lake with a central island. The Pacific Ocean lies towards the S (the image's lower left-hand corner) and in this region enters Uchiura-Wan bay. (ASTER record identification, 257). Courtesy of NASA. |
References. Geological Survey of Hokkaido (GSH), 2000a, Observations of Usu's volcanic eruption, 2000, Preliminary Report (in Japanese), 53 p. (in color on the GSH website and available as a 47 M file.
Geological Survey of Hokkaido (GSH), 2000b, Usu eruption in 2000, GSH News, 2000, 5, vol. 16, (ISSN 1345-1138), (text and captions in Japanese), 4 p. (1 additional sheet with 8 color plates)
Geological Summary. Usuzan, one of Hokkaido's most well-known volcanoes, is a small stratovolcano located astride the southern topographic rim of the 110,000-year-old Toya caldera. The center of the 10-km-wide, lake-filled caldera contains Nakajima, a group of forested Pleistocene andesitic lava domes. The summit of the basaltic-to-andesitic edifice of Usu is cut by a somma formed about 20-30,000 years ago when collapse of the volcano produced a debris avalanche that reached the sea. Dacitic domes erupted along two NW-SE-trending lines fill and flank the summit caldera. Three of these domes, O-Usu, Ko-Usu and Showashinzan, along with seven crypto-domes, were erupted during historical time. The 1663 eruption of Usu was one of the largest in Hokkaido during historical time. The war-time growth of Showashinzan from 1943-45 was painstakingly documented by the local postmaster, who created the first detailed record of growth of a lava dome.
Information Contacts: Masahiro Yahata, Geological Survey of Hokkaido, Kita 19, Nishi 12, Kita-Ku, Sapporo, 060-0819, Japan; Yoshiaki Ida, University of Tokyo, Earthquake Research Institute, Yayoi 1-1-1 Bunkyo-Ku, Tokyo 113, Japan; NASA Terra Project, NASA Goddard SFC, MC 613, Greenbelt, MD 20771 USA (URL: https://terra.nasa.gov/); Yasushi Yamaguchi, Japan Outreach Center for ASTER, Nagoya University, Earth & Planetary Sci Dept/Faculty Sci, Furou-cho Chikusa-ku, Nagoya 464-01; Usu Volcano Observatory, Institute of Seismology and Volcanology, Graduate School of Science, Hokkaido University, Sohbetsu-cho, Usu-gun, Hokkaido, 052-0103, Japan (URL: http://www.sci.hokudai.ac.jp/isv/english/).