Report on Atmospheric Effects (1995-2001) — May 2001

Atmospheric Effects (1995-2001)
Bulletin of the Global Volcanism Network, vol. 26, no. 5 (May 2001)
Managing Editor: Richard Wunderman.
Atmospheric Effects (1995-2001) Volcanic aerosol optical thicknesses derived from lunar eclipse observations
Please cite this report as:
Global Volcanism Program, 2001. Report on Atmospheric Effects (1995-2001) (Wunderman, R., ed.). Bulletin of the Global Volcanism Network, 26:5. Smithsonian Institution.
Atmospheric Effects (1995-2001)
All times are local (unless otherwise noted)
The following report, discussing volcanic aerosol optical thicknesses since 1960 as derived from lunar eclipse observations, was provided by Richard Keen. About once per year, on average, the moon is eclipsed as it passes into the Earth's shadow; at these times the moon can be used as a remote sensor of the global average optical depth of stratospheric aerosols of volcanic origin. Volcanic aerosols and lunar eclipses can be linked because the moon is visible during total lunar eclipses due to sunlight refracted into the shadow (umbra) by the Earth's atmosphere (primarily by the stratosphere), stratospheric aerosols reduce the transmission of sunlight into the umbra, and the path length of sunlight through a stratospheric aerosol layer is about 40 times the vertical thickness of the layer. Therefore, the brightness of the eclipsed moon is extremely sensitive to the amount of aerosols in the stratosphere.
Methodology and data reduction. Aerosol optical thicknesses can be calculated for the date of an eclipse from the difference between the observed brightness of the eclipse and a modeled brightness computed for an aerosol-free standard atmosphere, modified by assumed distributions of ozone and cloud. Details of this technique, applied to observations during 1960 through 1982, appear in Keen (1983); updates following the eruption of Pinatubo appeared in February 1993 (Bulletin v. 18, no. 2) and November 1997 (Bulletin v. 22, no. 11). This report updates the time series through the lunar eclipse of 9 January 2001, the last total lunar eclipse until May 2003.
Figure 12 plots the global optical thicknesses derived from 38 total or near-total lunar eclipses during 1960-2001. Results from eight eclipses during 1880-1888 have been added to figure 12 to allow comparison with the effects of Krakatau in 1883. The plotted values are actual derived optical depths, modified as follows: Due to the higher concentration of aerosols from Agung and El Chichón in the Southern and Northern Hemispheres, respectively, a sampling bias due to the moon's passing though the southern or northern portion of the umbra was removed by using an empirical adjustment factor of 0.8 (thus, if the moon passed S of the Earth's shadow axis during an eclipse following an Agung eruption, the derived optical thickness was multiplied by 0.8, while the derived value was divided by 0.8 if the moon passed N of the axis). Furthermore, no lunar eclipses occurred until 18 months following the Pinatubo eruption in June 1991, while results from Agung and El Chichón indicate that peak optical depths occurred about 9 months after those eruptions. Therefore, for plotting purposes on figure 12, the time series of optical thicknesses following Pinatubo was extrapolated backwards to a date 9 months after the eruption using a composite decay curve (with a time constant of 1.92 years) derived from the Agung and El Chichón eclipse data. Finally, the global optical depths were set to zero on the dates of the eruptions of Krakatau, Agung, Fuego, and Pinatubo; observed values were near zero for eclipses close to the dates of the eruptions of Fernandina and El Chichón.
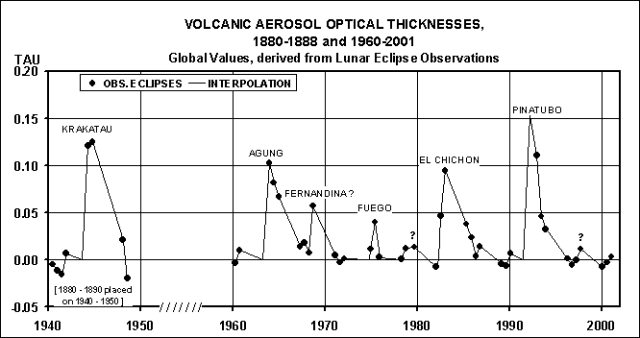 |
Figure 12. Global optical thicknesses derived from 38 total or near-total lunar eclipses during 1880-1888 and 1960-2001. Details about the methodology and data reduction used to construct this figure are in the report text. Courtesy of Richard Keen. |
The time series. The volcanic eruptions probably responsible for the major peaks in the times series are identified, although the identification of Fernandina with the 1968 peak is highly uncertain. Comparative maximum global optical thicknesses are: Pinatubo (1991), 0.15; Krakatau (1883), 0.13; Agung (1963), 0.10; El Chichón (1982), 0.09; Fernandina (1968), 0.06; Fuego (1974), 0.04.
The results indicate that the volcanic aerosol veil from Pinatubo disappeared between the eclipses of November 1993, and April 1996, with optical depth probably reaching zero sometime in 1995. Since 1995, optical depths have stayed near zero ( ± 0.01), indicating no further major injections of volcanic aerosols into the stratosphere. However, slight increases to observed values slightly above 0.01 in 1979 and in late 1997 are close to the noise level due to the uncertainty in the brightness observations; if real, they could indicate aerosols from the eruptions of Soufriere St. Vincent (1979) and Soufriere Hills on Montserrat (1997).
Acknowledgments. Thanks are due to the following observers who supplied observations of the three eclipses in the 2000-2001 series: C. Drescher, F. Farrell, M. Matiazzo, A. Pearce, and D. Seargent (Australia), W. de Souza and J. Aguiar (Brazil), J. Finn (Canada), K. Hornoch (Czech Republic), A. Shahin (Dubai, United Arab Emirates), G. Glitscher (Germany), N. Abanda, S. Abdo, W. Abu Alia, E. Al-Ashi, H. Al-Dalee', A. Al-Niamat,K. Al-Tell, and M. Odeh (Jordan), R. Bouma (Netherlands), B. Granslo and O. Skilbrei (Norway), A. Pereira and C. Vitorino (Portugal), J. Atanackov and J. Kac (Slovenia), T. Cooper (South Africa), T. Karhula and P. Schlyter (Sweden), R. Eberst and A. Pickup (UK), R. Keen, T. Mallama, and J. Marcus (USA).
References. Keen, R., 1983, Volcanic aerosols and lunar eclipses: Science, v. 222, p. 1011-1013.
Information Contacts: Richard A. Keen, Program for Atmospheric and Oceanic Sciences (PAOS) , 311 UCB, University of Colorado, Boulder, CO 80309 USA.