Report on Mauna Loa (United States) — September 2002
Bulletin of the Global Volcanism Network, vol. 27, no. 9 (September 2002)
Managing Editor: Richard Wunderman.
Mauna Loa (United States) Following 9 years of slow deflation, quicker inflation since mid-May 2002
Please cite this report as:
Global Volcanism Program, 2002. Report on Mauna Loa (United States) (Wunderman, R., ed.). Bulletin of the Global Volcanism Network, 27:9. Smithsonian Institution. https://doi.org/10.5479/si.GVP.BGVN200209-332020
Mauna Loa
United States
19.475°N, 155.608°W; summit elev. 4170 m
All times are local (unless otherwise noted)
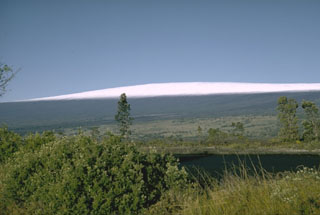
Mauna Loa is the southern-most volcano on the island of Hawaii. Following the last eruption of Mauna Loa, during March-April 1984 (SEAN 09:03), there have been several periods of inflation and deflation at the volcano's summit caldera, Moku`aweoweo. As of September 2002, Mauna Loa has remained non-eruptive (figure 14) for 18.5 years. The pattern of deformation at Moku`aweoweo abruptly changed in mid-May 2002 from deflation to inflation, lasting until at least September 2002. An archive of deformation and seismic data from Mauna Loa dating back to the 1970s provides an example of the volcano's pre-eruptive and precursory behavior.
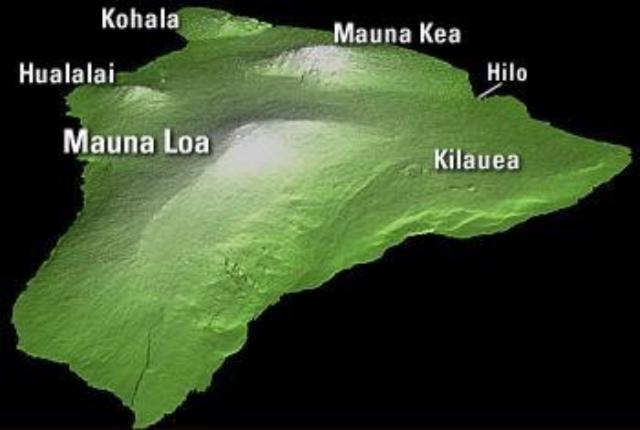 |
Figure 14. Oblique shaded-relief map (N at top) showing the location of the city of Hilo and the five volcanoes that built the island of Hawaii. The young growing submarine volcano Lōʻihi is not shown. When including the submarine portions of Hawaii attributed to Mauna Loa, it ranks as Earth's largest active volcano, encompassing 51 percent of the island's surface area and comprising a volume over ~ 65,000 km3. Courtesy HVO. |
After the last Bulletin report about Mauna Loa in July 1991(BGVN 16:07) the volcano's summit continued to gradually inflate as it had since the 1984 eruption. This trend reversed in 1993-1994 when distances across the caldera shortened by as much as 7 cm, and leveling surveys in 1996 and 2000 measured more than 7 cm of subsidence SE of the caldera.
Beginning on 24 April 2002 at 0645 a notable cluster of deep earthquakes (darkest circles in figure 15) occurred in a 52-hour period. The earthquakes ended on 26 April at 1045. Many of the epicenters plotted within or close to the caldera's SW margin. The earthquakes ranged in depth from 26 to 43 km and in magnitude from 1.1 to 1.7. Several shallow earthquakes preceded this cluster; the largest, a magnitude 2.5 event on 21 April at 1931, was located ~3 km beneath the SW rift zone. After the cluster, several deep long-period events were recorded beneath the SW rift zone. At that time data from the continuous tiltmeter, dilatometer, and nearly continuous global positioning system (GPS) stations failed to suggest significant deformation of Moku`aweoweo caldera, upper-rift zones, or outer flanks.
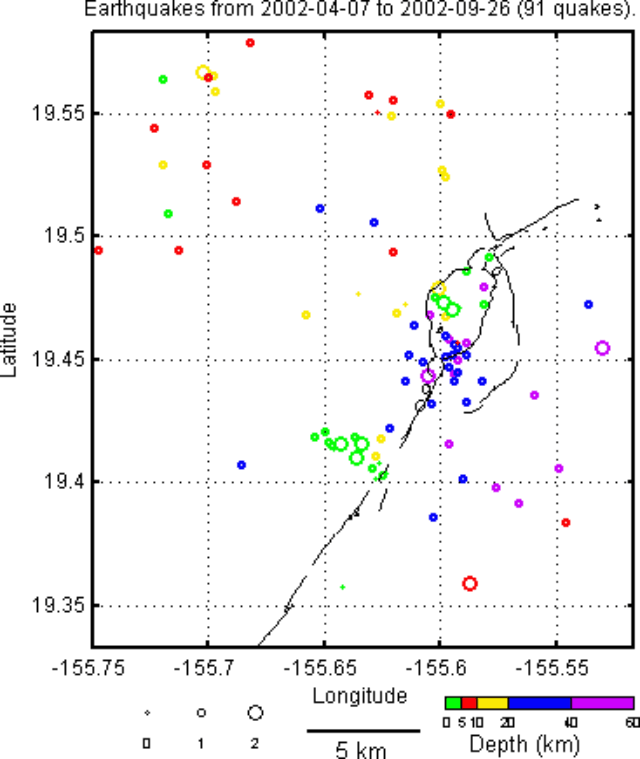 |
Figure 15. Plot showing the magnitudes, locations, and depths of earthquakes registered at Mauna Loa during 7 April- 26 September 2002. Following the swarm of deep earthquakes during 24-26 April (dark circles), seismicity was somewhat elevated. |
Inflation. HVO maintains several continuously recording GPS stations installed in 1999 (figure 16). Beginning in late April or early May 2002, deformation data began to show signs of renewed activity.
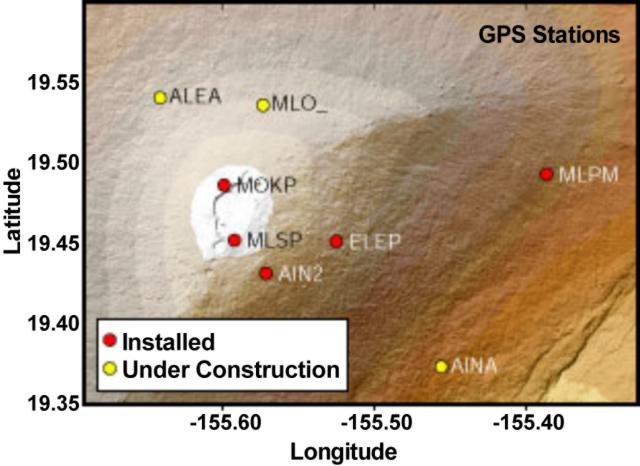 |
Figure 16. Map showing the several GPS stations HVO maintains on Mauna Loa as of September 2002. HVO plans to install several additional stations (white dots), on indefinite loan from Stanford University. Courtesy HVO. |
Figure 17 shows the change in distance between MOKP and MLSP GPS stations, located on opposite sides of Moku`aweoweo. The increased distance between the two stations was interpreted to represent inflation of the summit magma reservoir, centered ~5 km below the caldera. The small amount of extension marks a noticeable change from the pattern of deflation during the preceding 9 years. GPS measurements also revealed that the summit area had inflated about 2 cm, consistent with swelling.
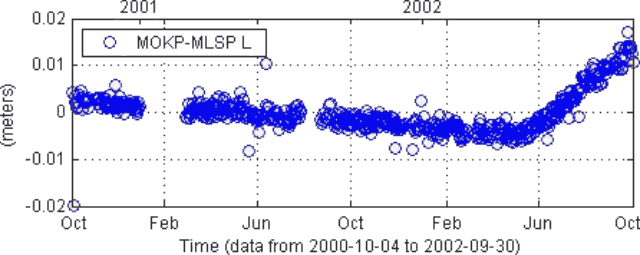 |
Figure 17. Graph showing the change in distance between GPS stations MOKP and MLSP, located on opposite sides of Moku'aweoweo caldera, as seen during 4 October 2000-30 September 2002. Distance across Moku'aweoweo began to increase by 5-6 cm/year starting in late April-May 2002. Courtesy HVO. |
The switch from slow deflation to more rapid inflation occurred around 12 May. GPS data indicated lengthening at a rate of 5-6 cm per year. Therefore, as of 26 September the caldera had widened about 2 cm since 12 May. Measurements at GPS stations farther out on the flanks showed that swelling occurred at more than the summit, in particular, the upper part of the SE flank was moving outward.
In order to test the precision of the GPS measurements, HVO compared the GPS data against dry-tilt method data at the summit, an independent means to measure ground deformation using land-surveying instruments, deployed at regularly visited stations. These confirmed the GPS results, though with less precision.
Electronic-tiltmeter data obtained at the Moku'aweoweo tiltmeter were also analyzed for changes in tilt direction. No significant volcanic tilt was recorded that deviated from the diurnal signal corresponding to daily temperature fluctuations, or an annual signal corresponding to seasonal temperature changes.
During the inflationary period, seismicity at Mauna Loa was at a somewhat elevated level following the 24-26 April earthquake cluster. But, it remained far lower than it was the months prior to the 1975 and 1984 eruptions.
May-September 2002 unrest in comparison to activity since 1974. For Mauna Loa these data sets are available: electric distance meter (EDM) measurements since about 1975, GPS observations since 1999, dry-tilt observations since 1975, and seismicity since 1974. The capability to detect unrest at Mauna Loa has increased in the past few years with the installation of many new, continuously recording electronic tiltmeters, GPS receivers, and strainmeters (figure 18).
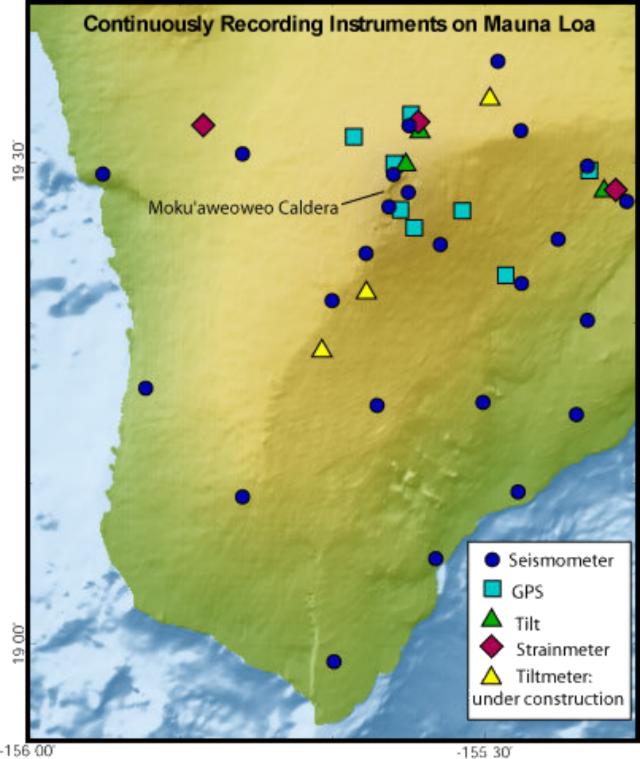 |
Figure 18. Map showing locations of continuously recording instruments for measuring deformation and seismicity at Mauna Loa as of September 2002. This map omits many additional benchmarks used in various deformation surveys. Courtesy HVO. |
Figure 19 shows the distance measured across Moku`aweoweo caldera between MOKP and MSLP benchmarks by EDM during 1975 to September 2002, and by GPS beginning in 1999. Abrupt extensions associated with the 1975 and 1984 eruptions were caused by the rise of magma from the summit reservoir to the surface. During the 1984 eruption, the summit area subsided rapidly as lava erupted. When the eruption stopped, the summit reservoir again began to inflate in response to the influx of magma, as indicated by the increasing distance between the two benchmarks until about1993. Inflation did not occur again until early May 2002 when the slow contraction across the summit changed abruptly to extension. This extension rate is the highest since immediately after the 1984 eruption.
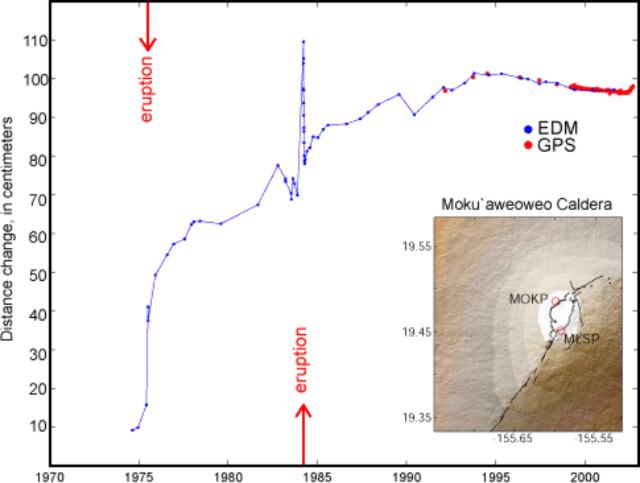 |
Figure 19. The change in distances across Moku`aweoweo caldera at Mauna Loa, between MOKP and MSLP benchmarks (see map inset) as measured by electronic distance meter since about 1975 to September 2002 and by GPS receivers since 1999. Note the abrupt change from contraction to extension in May 2002. Courtesy HVO. |
GPS measurements have only been made at Mauna Loa since 1999, but in that relatively short time an abrupt change in ground movement has been recorded (figure 20). Measurements made during January 1999-May 2002 show small velocities of ground displacement towards the SW. In contrast, during May-September 2002 the direction of ground motion changed from a fairly uniform, southeastward movement to a predominately radial pattern. In addition, the rate of ground motion increased by 5 to 10 times.
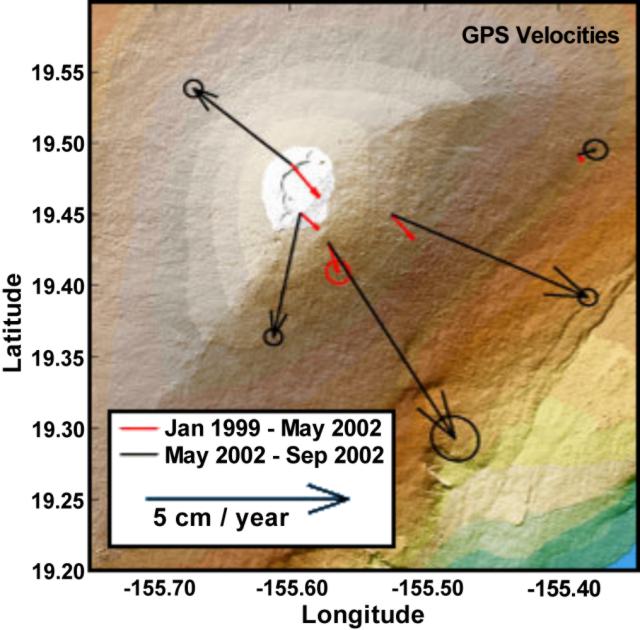 |
Figure 20. Velocities of ground displacement measured by GPS stations on Mauna Loa during 1999 to 12 May 2002 (light lines) and 12 May to 21 September 2002 (black lines). The arrows represent the speed and direction of motion. The tips of the arrows representing the actual motion point lie somewhere within the uncertainty ellipses. Courtesy HVO. |
Ground tilt away from the caldera occurs when magma accumulates beneath the surface. Although electronic measurements provide much more precise readings, the dry-tilt method remains in use at HVO after 35 years for several reasons. First, the measurements can be made nearly anywhere at any time. Second, they are not subject to long-term instrument drift. Lastly, they provide an independent corroboration of measurements made by more sophisticated modern instruments. Dry-tilt measurements revealed the following: inflation between the 1975 and 1984 eruptions (figure 21a), inflation after the 1984 eruption, continuing until 1993 (figure 21b), and deflation from 1993 through March (probably May) 2002 (figure 21c). After March (probably May), the tilt returned to an inflationary pattern (figure 21d). The most recent pattern of inflation is based on only two sets of measurements, and the tilt varies, with some smaller arrows pointing inward, so it is much less certain than the past patterns. Still, the radial pattern strongly suggests that inflation is occurring.
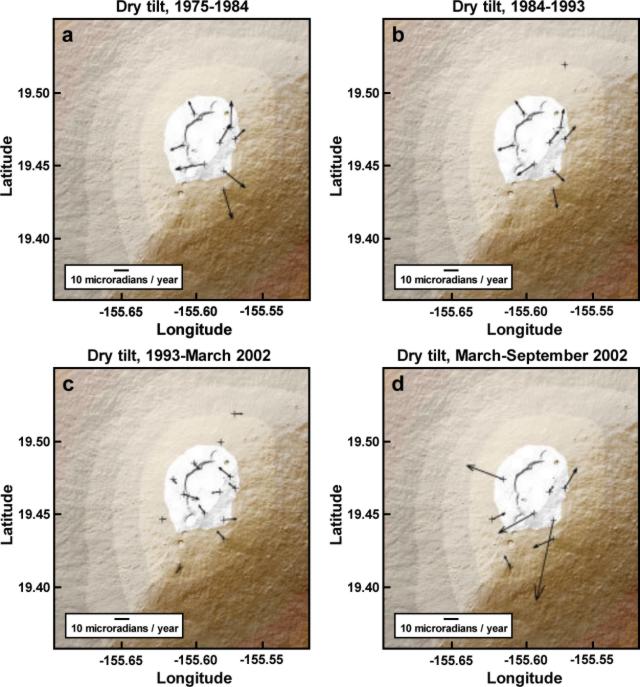 |
Figure 21. Rates of ground tilt measured in the summit region of Mauna Loa during 1975 to September 2002. Arrows point in the direction of downward tilt rate of the ground surface; arrow lengths show the amount of tilt in microradians (note scale bars). A) inflation during 1975-1984, between the last two eruptions at Mauna Loa; b) inflation after the 1984 eruption to 1993; c) deflation during 1993 to March (probably May) 2002; and d) a general return to inflation until at least September 2002. Courtesy HVO. |
HVO's telemetered seismographic network recorded significant changes in seismicity before the Mauna Loa eruptions in 1975 and 1984 (figure 22). The short-term forecasts of these eruptions were based in large part on precursory activity. Both eruptions were preceded by an increase in earthquakes at intermediate depths NE of Moku`aweoweo, and then by an increase in shallower earthquakes beneath Mauna Loa's summit. From the 1984 eruption until late April 2002, approximately 30 earthquakes were located per year beneath Mauna Loa's summit and upper flanks. Rates of seismicity moderately increased beginning in late April 2002, particularly at depths greater than 15 km (figure 22d). As of 29 September 2002, 100 earthquakes were recorded in 2002 below the summit and upper flanks of the volcano, 83 of which occurred after mid-April. This rate is markedly higher than those of previous years, but it is still well below the rates seen prior to the last two eruptions. Before an eruption becomes imminent, HVO scientists expect that rates of shallow seismicity will elevate to levels much higher than those observed in late September 2002.
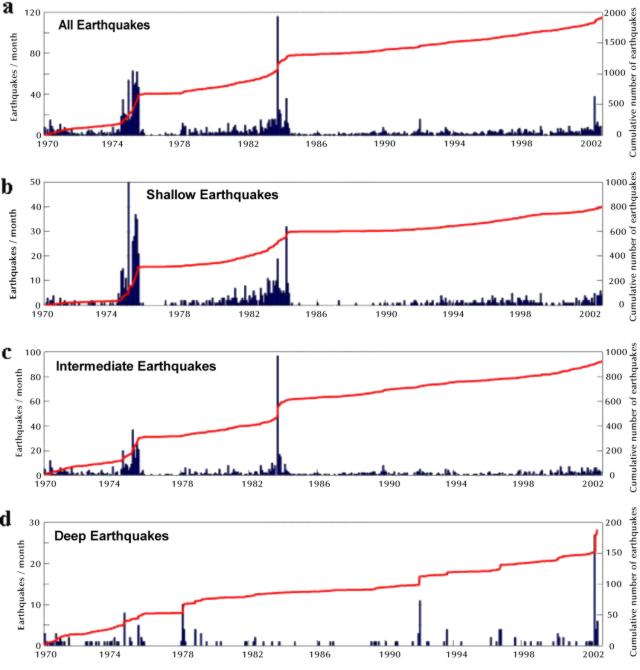 |
Figure 22. Monthly earthquakes (bars, scales at left) and cumulative numbers of located earthquakes (curves, scales at right), separated into three depth ranges, within or beneath Mauna Loa between 1974 and 29 September 2002. The earthquakes shown occurred beneath Mauna Loa's summit and upper flanks and had magnitudes greater than 1.0. Part "a" shows all earthquakes; "b", shallow earthquakes (0 to 5 km deep); "c", intermediate earthquakes (5 to 15 km deep); and "d", deep earthquakes (greater than 15 km deep). Courtesy HVO. |
References. Moore J G, Clague D A, Holcomb R T, Lipman P W, Normark W R, Torresan M E, 1989. Prodigous submarine landslides on the Hawaiian Ridge. J Geophys Res, 94: 17,465-17,484; Lockwood J P, Lipman P W, 1987. Holocene eruptive history of Mauna Loa volcano. U S Geol Surv Prof Pap, 1350: 509-535.
Geological Summary. Massive Mauna Loa is a basaltic shield volcano that rises almost 9 km from the ocean floor to form the world's largest Holocene volcano. Flank eruptions typically occur from the lengthy NE and SW rift zones, and from the Moku'aweoweo summit is caldera, which is within an older and larger 6 x 8 km caldera. Two of the youngest large debris avalanches documented in Hawaii traveled nearly 100 km from Mauna Loa; the second of the Alika avalanches was emplaced about 105,000 years ago (Moore et al., 1989). Almost 90% of the surface of the volcano is covered by lavas less than 4,000 years old (Lockwood and Lipman, 1987). Beginning about 1,500 years ago, a series of voluminous overflows from a summit lava lake covered about 25% of the volcano's surface. Over the last 750 years, from shortly after the formation of Moku'aweoweo caldera until the present, an additional 25% of the volcano has been covered with lava flows, mainly from summit and NW rift zone vents.
Information Contacts: Hawaiian Volcano Observatory (HVO), U.S. Geological Survey, PO Box 51, Hawaii National Park, HI 96718, USA (URL: https://volcanoes.usgs.gov/observatories/hvo/).