Report on St. Helens (United States) — September 2004
Bulletin of the Global Volcanism Network, vol. 29, no. 9 (September 2004)
Managing Editor: Richard Wunderman.
St. Helens (United States) New eruption starts suddenly—first dome-growth in 18 years
Please cite this report as:
Global Volcanism Program, 2004. Report on St. Helens (United States) (Wunderman, R., ed.). Bulletin of the Global Volcanism Network, 29:9. Smithsonian Institution. https://doi.org/10.5479/si.GVP.BGVN200409-321050
St. Helens
United States
46.2°N, 122.18°W; summit elev. 2549 m
All times are local (unless otherwise noted)
After a hiatus of over 13 years, following phreatic eruptions during November 1990 to February 1991, a new eruption began in the crater at Mount St. Helens. Some shallow seismicity preceded the eruption, but this came only 9 days prior to the first ash emission. There was no progression of deep earthquakes propagating upward with time during the preceding months. Also apparently absent were other classical monitored parameters (deformation, gas emissions, geochemical or thermal anomalies) that could help foretell of an eruption several weeks or months ahead.
The eruption extruded a two-pyroxene, hornblende dacite of low vesicularity. The initial extrusions and uplift affected the S dome area and adjacent crater floor to the S. The intrusion included uplift and deformation of glacial ice, as well as some melting of ice, forming a small, short-lived bubbling lake (nicknamed 'the Jacuzzi') and a minor lahar out of the crater.
This report discusses the first 16 days of the eruption, from the first sign, shallow earthquakes, which began on 23 September 2004. This report was chiefly put together from reports posted by the Cascades Volcano Observatory (CVO), but also benefitted from personal communications with James Quick, Marianne Guffanti (both at USGS, Reston, Virginia), and James Vallance (USGS-CVO).
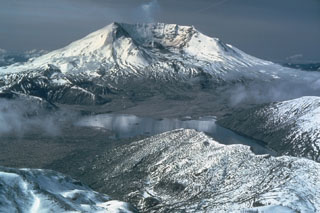
Synopsis. A photograph of the scene several weeks before the eruption came from climbers on the S rim. They visited during the last week of August 2004, a time when all still seemed quiet (figure 46). A chronology of events in the first 16 days (table 4) includes the dates and times of the events, the hazard status to people on the ground and to aviation traffic, and some brief comments on the seismicity and volcanism taking place.
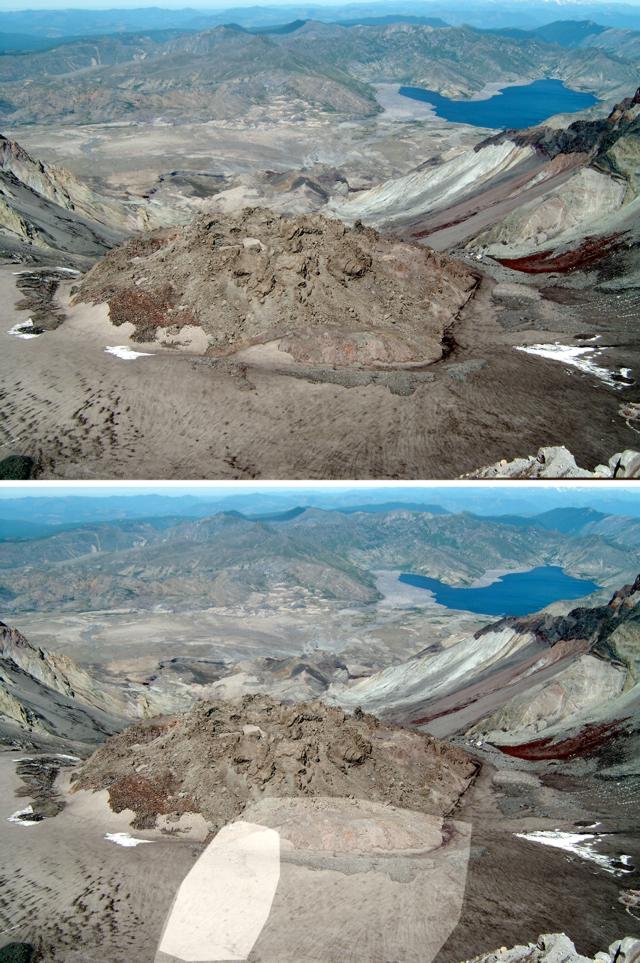 |
Figure 46. Photographs looking N from the crater rim at Mount St. Helens during clear, hot weather in the last week of August 2004. Much of the lower half of the top photo shows the S side of the 1980-1986 dome, the flat area arcing around it called the moat, and parts of the engulfing crater walls. In the upper half of the photo lie (from right to left) Spirit Lake, a large open area called the pumice plain, and some ridges, including the one directly across the pumice plain, Johnson Ridge. Glacial ice covers the moat and portions of the lower dome and lower crater walls. Debris from mass wasting covers parts of the glacier.The bottom photo is the same image with shading added by James Vallance to indicate the approximate locations of the extruding dome and the larger region of uplift. Those events took place between 27 September and the present, one to two months after this photograph, dramatically altering the surface morphology between the dome and the southern crater wall. Photo courtesy of Ivan Savov, taken on the S crater rim ~ 200 m W of the upper end of the Monitor Ridge trail. |
Table 4. A simplified chronology of the events at Mt. St. Helens from 23 September to 8 October 2004. Taken from material posted by the Cascades Volcano Observatory.
| Day | Date | Hazard Status | Comment |
| DAY 1-3 | 23-25 Sep 2004 | None posted | Swarm of small, shallow earthquakes (less than M 1) began on morning of the 23rd, peaked mid-day on the 24th, then declined through the afternoon of the 25th. |
| DAY 4 | 26 Sep 2004 | 1 - Notice (green) | Seismicity increased; ten M 2-2.8 events; volcanic unrest at 1500 hours. First Yellow alert since Oct. 1986. |
| DAY 7 | 29 Sep 2004 | 2 - Advisory (yellow) | Higher advisory issued at 1040 hours. |
| DAY 8 | 30 Sep 2004 | 2 - Advisory (yellow) | Deformation S of dome; fissures on ~200 m of ice. |
| DAY 9 | 01 Oct 2004 | 2 - Advisory (yellow) | Ash emission rose to 3 km altitude. |
| DAY 10 | 02 Oct 2004 | 3 - Alert (red) | Increased fumaroles, CO2 and H2S detected. |
| DAY 11 | 03 Oct 2004 | 3 - Alert (red) | Tremor episode; no eruptive plume. Continued detection of CO2 and H2S. Small steam and ash emission with plume to the crater rim. Temporary flight restriction within 9 km radius of summit. |
| DAY 12 | 04 Oct 2004 | 3 - Alert (red) | Large-scale glacial uplift. Steam and ash emission with plume to 3 km. |
| DAY 13 | 05 Oct 2004 | 3 - Alert (red) | Most vigorous ash/steam emission from both vent areas. Ash to 5 km. |
| DAY 14 | 06 Oct 2004 | 2 - Advisory (yellow) | Seismicity and tremor low. |
| DAY 15 | 07 Oct 2004 | 2 - Advisory (yellow) | Seismic activity low. Weak puffs of steam and a new vigorously erupting vent were observed. |
| DAY 16 | 08 Oct 2004 | 2 - Advisory (yellow) | Light seismic activity continued (1-2 events/hour; largest ~M 1.5). |
The CVO website contains a complete discussion of the 3-level hazard-status scheme used there during this reporting interval. In brief form, the status rises from 1 - Notice, to 2 - Advisory, to 3 - Alert. (These are short-hand for Notice of Volcanic Unrest: Alert Level One, Volcano Advisory: Alert Level Two, and Volcano Alert: Alert Level Three.) These respective levels of hazard status correspond to an informal color code, rising from green, to yellow, to red (shown in parentheses on table 1). A type of announcement, the Information Statement, discusses events that are unusual or short-lived, or both. On days 1-3, at the start of this crisis, a specific volcanic hazard was not specified.
Description of activity. At about 0200 on the morning of 23 September 2004, an earthquake swarm began at Mount St. Helens. Through 1700 hours on that date about 200 small (less than M 1) earthquakes had been located at the volcano, and many smaller events were recorded throughout the morning. The earthquakes occurred at shallow depths (less than 1 km) mostly under the lava dome that formed between 1980 and 1986.
Such earthquakes are common for the volcano. But a swarm with this many earthquakes has not been recorded for several years. The most recently case was on 3-4 November 2001. By 25 September 2004 seismicity had declined significantly. However it remained elevated above background. On 26 September the character of the swarm changed to include more than ten larger earthquakes (M 2-2.8), the most in a 24-hour period since the eruption of October 1986. Some of the earthquake types suggested pressurized fluids (water and steam) or perhaps magma. As a consequence, CVO and the University of Washington's Pacific Northwest Seismograph Network released the first Notice of Volcanic Unrest at this site in 18 years. The earthquakes occurred at shallow depths (less than 2 km) below the 1980-1986 lava dome.
On 27 September seismicity increased very slowly throughout the day. All earthquake locations were still shallow and beneath the dome. The largest earthquake recorded in the prior 24 hours was about M 1.5. Preliminary results from a gas flight late in the afternoon of 27 September did not indicate any magmatic gas.
Throughout the day of 28 September seismic activity remained at a fairly constant, but high rate of about two small (less than M 2) earthquakes per minute. All earthquake locations were still shallow and in or below the lava dome. That night seismic activity increased significantly. Throughout the day the seismicity remained elevated at 3-4 events per minute. A number of these events were between M 2 and 3. All earthquakes remained in or below the dome. By 30 September and 1 October the seismicity level had increased slightly, including events as large as M 3.3.
Around noon on 1 October a small 25-minute-long eruption occurred from a vent just S of the lava dome. The vent opened in a portion of the glacier that had become increasingly crevassed and uplifted over the past few days. The eruption sent a steam and minor ash plume to an altitude of about 3 km that drifted SW, accompanied by minor, local ashfall. Seismicity dropped several hours after the eruption, but gradually increased with earthquakes (maximum M 3) occurring 1- to 2-times per minute.
A 40-minute steam-and-ash emission started on 2 October at 0943. Steam clouds carrying minor ash billowed out of the crater to an altitude of 3 to 4 km. The emission occurred during a time of gradually increasing seismicity, which dropped slightly after the emission, but continued to increase gradually through the afternoon. CVO's preliminary reports indicated that despite this increase, the event did not generate diagnostic earthquakes or explosion signals. Scientists inferred that hot rock was pushed up into the glacier, which then melted ice and generated the steam.
An interval of tremor lasting 50 minutes occurred immediately after a small steam emission at 1215 on 2 October. When the tremor stopped, the seismic character changed back to the earlier mode with shallow earthquakes under about maximum magnitude M 3 occurring 1- to 2-times per minute. Another period of smaller steam and ash bursts occurred between 1410 and 1440. Visual observations showed that the area of uplift, which includes part of the glacier and a nearby segment of the S flank of the lava dome, continued to rise. Part of the vent for the steam and ash emissions of the past few days was discovered to be covered by a boiling lake.
A gas flight on 3 October found slightly lower concentrations of carbon dioxide. On the other hand, for the first time hydrogen sulfide was detected. The 4 October gas flight detected carbon dioxide, often in association with hydrogen sulfide and occasional sulphur dioxide.
On 5 October at 0943 a 30-minute-long steam-and-ash emission started, and at 1410 a 10-minute-long steam-and-ash emission began. Ashfall on roads SE of the volcano achieved a maximum thickness of 0.2 mm at 8 km from the source. Neither emissions generated diagnostic earthquakes or explosion signals. As on 4 October, steam and ash emissions were associated with sightings of a bubbling lake. After the 4 October emissions, earthquake energy slowly increased to previous high values.
On 5 October continued uplift included part of the glacier and a nearby segment of the dome's S flank. Cracks opened in the dome. Portions of the cracks reached temperatures of 40-50°C (above ambient temperatures at the dome and glacier's surface, but far below the minimum magmatic temperature of ~ 800°C). Rocks avalanched off the dome, falling into the lake and onto the S crater floor. The dome's N flank appeared thermally stable.
The most vigorous steam and ash emission of the reporting period began on 5 October amid an interval with high seismicity shortly after 0900. Steam clouds billowed from the crater for over an hour, with variable ash content. For the first time, the ash content was sufficient to be detected by National Weather Service Doppler Radar. Steam and ash clouds reached about 3 km high and drifted NNE. A light dusting of ash fell in Morton, Randle, and Packwood, Washington, towns about 50 km from the volcano. Seismicity dropped during the emission and stayed relatively low the next day.
On 6 October the low-level tremor observed following the eruption gradually declined. Brief crater observations from Coldwater Visitor Center noted weak steam emissions. Small lahars from the crater traveled N onto the pumice plain during a rainstorm in the early morning of 6 October. Lahars flowed a short distance toward both Spirit Lake and the North Fork of the Toutle river.
The GPS station on the dome's N flank showed a trend of northward displacement totaling 2 cm over the last three days. This is the same sense of movement recorded by the nearby station that was destroyed by the first steam-and-ash emission on 1 October. In contrast, GPS instruments on the outer flanks of the volcano showed no movement.
Additional analysis based on lidar (LIght Detection And Ranging) and photographs of the intensely uplifting area suggested that the total volume change represented by the deformation between late September and 6 October was about 16-20 million cubic meters. The average rate of change was about 2 million cubic meters per day. If this value represents the rate of intrusion of magma into shallow levels of the dome and underlying crater floor, or both, it was an intrusion rate about twice that measured during dome-building eruptions at Mount St. Helens in the 1980s.
The 7 October report noted that a new steam vent opened overnight to join the two that had been present for several days. Steaming from the vents generated a cloud that rose above the lava dome's S side and extended toward the crater rim. Seismic activity was low to moderate with earthquakes of M 1 to 2 occurring about once per minute. Seismicity increased slightly during 7 October. Earthquakes up to M 1 occurred at a rate of ~ 1-1.5 per minute.
Reports issued on 8 October noted seismic activity continued to be low to moderate. Earthquakes occurred at a rate of 1 to 2 per minute with the largest magnitudes about M 1.5. That day field crews reported that there had not been noticeable additional uplift of the S part of the dome and adjacent glacier in the past 24 hours. Measurements from the recent photographs and lidar showed that the intensely deformed and uplifted area on the S side of the lava dome was then about 400 m (N-S) x 500 m (E-W) with a maximum uplift of about 100-130 m.
Seismicity rose gradually for most of 8 October and leveled off overnight. Earthquakes of M 2.4 occurred about once every two minutes. During 10 October seismicity decreased slightly, to levels similar to those observed during the evening hours of 7 October. Earthquakes of 1.0 M or less continued to occur at a rate of about 1 per minute, but most had magnitudes of M 1.0 or less.
On 12 October seismicity remained low. Small earthquakes (maximum about M 1) continued to occur every 5-10 minutes. Thermal imaging around 12 October of the W part of the uplifting area revealed temperatures of 500-600°C, by far the highest yet reported. They were greatest on a large pinkish-gray fin of rock and in nearby fumaroles and cracks. These observations were consistent with new lava having reached the ground surface. Later sampling of adjacent fresh talus using a metal trash can on a line below a helicopter confirmed it's dacitic composition.
Aviation advisories. The Washington VAAC issued advisories beginning on 29 September. Between then and through 8 October, they issued 23 Volcanic Ash Advisories. Some of these were also 'volcano watches.' Most of these were cautionary in nature, and actual plumes were generally minor, frequently steam dominated rather than heavily ash laden.
Geological Summary. Prior to 1980, Mount St. Helens was a conical volcano sometimes known as the Fujisan of America. During the 1980 eruption the upper 400 m of the summit was removed by slope failure, leaving a 2 x 3.5 km breached crater now partially filled by a lava dome. There have been nine major eruptive periods beginning about 40-50,000 years ago, and it has been the most active volcano in the Cascade Range during the Holocene. Prior to 2,200 years ago, tephra, lava domes, and pyroclastic flows were erupted, forming the older edifice, but few lava flows extended beyond the base of the volcano. The modern edifice consists of basaltic as well as andesitic and dacitic products from summit and flank vents. Eruptions in the 19th century originated from the Goat Rocks area on the N flank, and were witnessed by early settlers.
Information Contacts: Cascades Volcano Observatory (USGS/CVO), U.S. Geological Survey, 1300 SE Cardinal Court, Building 10, Suite 100, Vancouver, WA 98683-9589, USA (URL: https://volcanoes.usgs.gov/observatories/cvo/); Pacific Northwest Seismograph Network (PNSN), Seismology Lab, University of Washington, Department of Earth and Space Sciences, Box 351310, Seattle, WA 98195-1310, USA (URL: http://www.pnsn.org/); Ivan Savov, Department of Mineral Sciences, National Museum of Natural History, Smithsonian Institution, Washington, DC 20560-0119, USA; Washington Volcanic Ash Advisory Center (VAAC), Satellite Analysis Branch (SAB), NOAA/NESDIS E/SP23, NOAA Science Center Room 401, 5200 Auth Road, Camp Springs, MD 20746, USA (URL: http://www.ospo.noaa.gov/Products/atmosphere/vaac/).