Report on Grimsvotn (Iceland) — October 2004
Bulletin of the Global Volcanism Network, vol. 29, no. 10 (October 2004)
Managing Editor: Richard Wunderman.
Grimsvotn (Iceland) Subglacial eruption penetrates ice cover and sends ash far as Finland
Please cite this report as:
Global Volcanism Program, 2004. Report on Grimsvotn (Iceland) (Wunderman, R., ed.). Bulletin of the Global Volcanism Network, 29:10. Smithsonian Institution. https://doi.org/10.5479/si.GVP.BGVN200410-373010
Grimsvotn
Iceland
64.416°N, 17.316°W; summit elev. 1719 m
All times are local (unless otherwise noted)
According to scientists from the Institute of Earth Sciences at the University of Iceland and the Icelandic Meteorological Office, an eruption began at the subglacial Grímsvötn volcano in the Vatnajökull ice cap, Iceland, on 1 November 2004 around 2100, and was declining by 5 November. The eruption, preceded by both long- and short-term precursors, was triggered by the release of overburden pressure associated with a glacial-outburst flood (jökulhlaup) originating from the subglacial caldera lake. The jökulhlaup reached a maximum on the afternoon of 2 November. At that time the peak discharge from affected rivers on the coastal plain at Skeidararsandur was 3,000-4,000 m3/s (based on information from the Icelandic Hydrological Service). Discharge declined quickly after the peak. No damage occurred to roads or bridges. The total volume of the jökulhlaup was ~ 0.5 km3.
Seismicity increased at the volcano in mid-2003, about the same time that uplift exceeded a maximum reached in 1998. Tthe last eruption at Grímsvötn occurred within the caldera beginning on 18 December 1998.... Additional uplift and expansion of the volcano since mid-2003 heralded the latest activity. Seismicity further increased in late October 2004, and on 26 October high-frequency tremor indicated increased water flow from the caldera lake and suggested that a glacial outburst flood was about to begin. On 29 October, the amount of discharge increased in the Skeidara River. About 3 hours before the eruption an intense swarm of volcanic earthquakes started, changing to continuous low-frequency tremor at the onset of the eruption.
The release in overburden pressure associated with the outburst flood triggered the eruption. The amount of drop in water level in the caldera at the onset of the eruption was uncertain, but was probably on the order of 10-20 m, corresponding to a pressure change of 0.1-0.2 MPa at the volcano's surface. This modest pressure change triggered the eruption because pressure in the shallow magma chamber was high after continuous inflow of magma since 1998.
Figure 5 shows the epicenters from 18 October to 1 November 2004, along with preliminary locations of the eruption site. In the early morning of 1 November, an earthquake swarm began beneath Grímsvötn. By 1400 there were 12 earthquakes; at 0651 the largest, an event of M 3 occurred. At 2010 on 1 November an eruption warning was sent to the Civil Defense, earthquake magnitudes had increased and around that time the swarm intensified. About 160 earthquakes with magnitudes up to 2.8 were recorded during the next 2 hours.
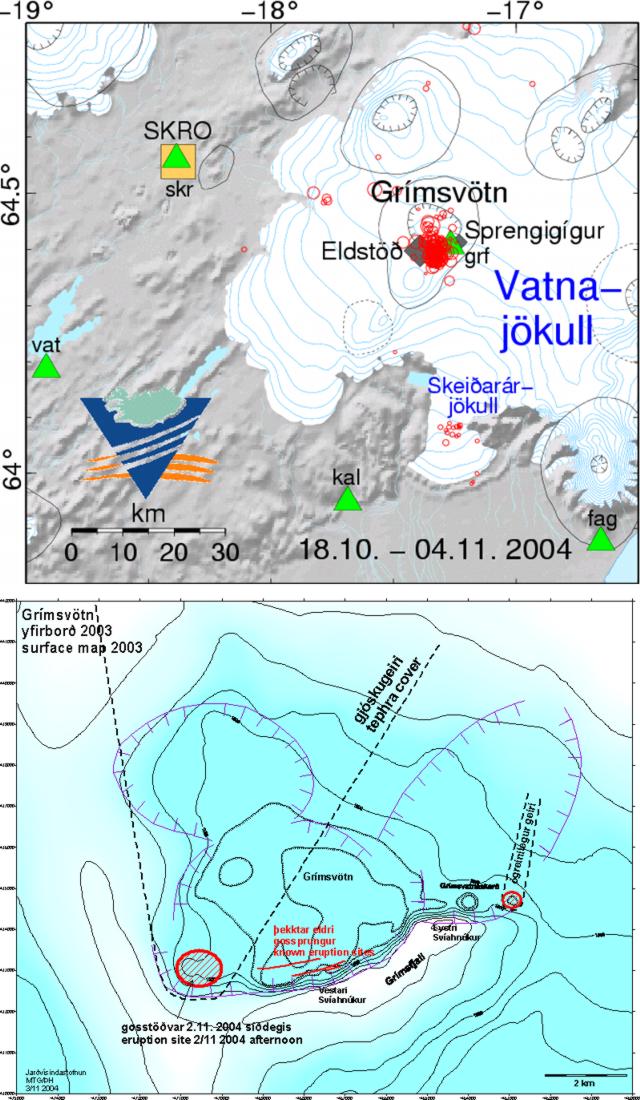 |
Figure 5. A map of the Grímsvötn area (top) showing epicenters registered from 18 October to 1 November 2004 (circles) and approximate locations of vents through the glacier (two diamonds), which lie just inside the caldera's SE margin. Seismic stations are denoted by triangles, and a continuous GPS (Global Positioning System) station by a square. A larger-scale map (bottom, base map by Magnús Tumi Gudmundsson) provides a closer look at the 2004 eruption site, locating the two ice cauldrons and cracks, as well as the margins of the ash dispersal patterns. Contours reflect 2003 ice-surface contours. A separate set of boldly hachured lines indicates the lobate form of the subglacial caldera's topographic margins. Courtesy of the Icelandic Meteorological Office. |
Initially under ice 150-200 m thick, the eruption melted its way through to the surface in about 1 hour. An eruption plume was detected by radar around midnight on 1 November. Radar estimates of plume altitude stood at 12-13 km numerous times during 2-3 November. A plot of altitude versus time showed two cases where plume heights were almost 13 km; each occurred about 0200 on 2 and 3 November. The weather radar used to make the plot was located at Keflavik-Airport, 260 km from Grímsvötn.
Lightning. Early on 2 November and through most of the morning on 3 November, numerous lightning strikes were detected by instruments, and their computed locations largely centered over Grímsvötn. The ash plume was driven to the N by southerly winds during the whole eruption. Accordingly, both the scatter and SE extension of the lightning were judged likely artifacts of imprecision in estimates of lighning locations (figure 6).
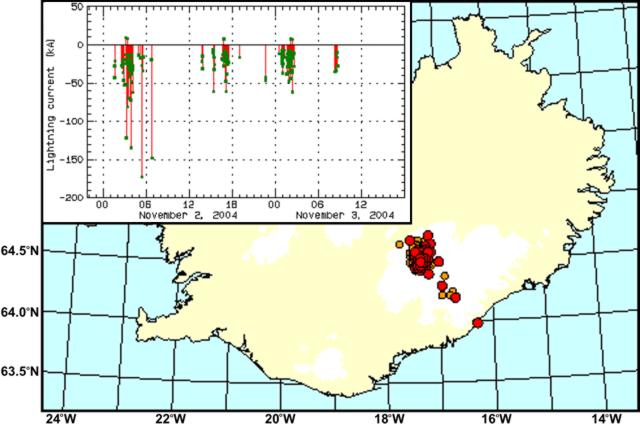 |
Figure 6. Map view of lightning in Iceland located by the UK Met Office's ATD sferics system during the first 36 hours of the Grímsvötn eruption (posted on the website of the Icelandic Meteorological Office). The inset graph shows a time-series of lightning strikes and their currents in kA (thousands of amps) recorded in conjunction with the Grímsvötn eruption during 2-3 November 2004. The plot was produced with data from the Syxri-Neslönd station, an LLP lightning direction-finder. |
Regarding the lightning data, geophysicist Pordur Arason described the three systems used. First, the Icelandic lightning location system consists of three LLP direction finder stations, each measuring time, direction, polarity, intensity and multiplicity. The stations discriminate lightning and record only cloud-to-ground (CG) lightning. The location system is old (produced pre-1980) and unfortunately only one station (Sydri-Neslond) gave useful measurements. By assuming distance from the station to Grímsvötn, Arason calculated the current in the lightning. He noted that almost all of this CG lightning showed negative polarity (lightning polarity is determined by the charge of the cloud compared to Earth).
A second lightning system results from cooperation with the UK Met Office, and one of their ATD sferics stations in Iceland. Arason had access to their data. The locations on figure 2 are those of the ATD system, which gives times and locations but does not discriminate between cloud-to-ground (CG) lightning and cloud-to-cloud (CC) lightning, although it is biased towards CG, since its antennas only measure vertical electric-field variations.
The third system was a one-station recording system of vertical electric field variations (EFMS) in Reykjavik that records the vertical component of the electric field every 200 ns for a period of a 1 ms. During the eruption it recorded the waveforms of about 150 lightning events. About half of these show characteristics of a negative polarity CG and half CC.
Magma-water interactions lead to explosions, emission of ash and steam, and to charge separation. Erupted ash becomes negatively charged and the steam positively charged. Almost all of the CG lightning had negative polarity, indicating its origin in the ash, and not the steam.
Other observations. The initial inspection of the eruption from an airplane took place around 0800 UTC on 2 November. It confirmed that a phreatomagmatic eruption was in progress from a short (less than 1-km-long) eruptive fissure at 64.40°N, 17.23°W. At that time a continuous plume rose to ~ 9 km altitude. Observations throughout the day revealed periods of high explosive activity, with maximum plume heights of 12-14 km. The strength of the eruption correlated with the seismically recorded volcanic tremor. Some explosive activity had occurred in a second ice cauldron near the SE edge of Grímsvötn, 8 km to the E of the main crater. This ice cauldron issued steam when first detected after noon on 2 November.
The London VAAC reported that the ash plume produced from the eruption reached a height of ~ 12.2 km a.s.l. According to news articles, the eruption occurred in an unpopulated region so no evacuations were needed, but air traffic was diverted away from the region.
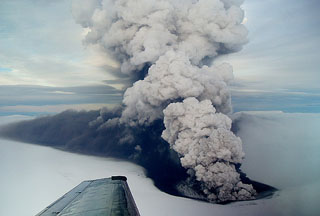
Observation flights later on 2 November photographed and videoed the vent that had opened through in the ice (figures 7-9). Plumes were sometimes nearly white and steam dominated, at other times black and ash dominated, and in some cases visible portions of the plumes simultaneously reflected both of these extremes (figure 7, 8, and 9). A 2 November view of the jökulhlaup appears as figure 10.
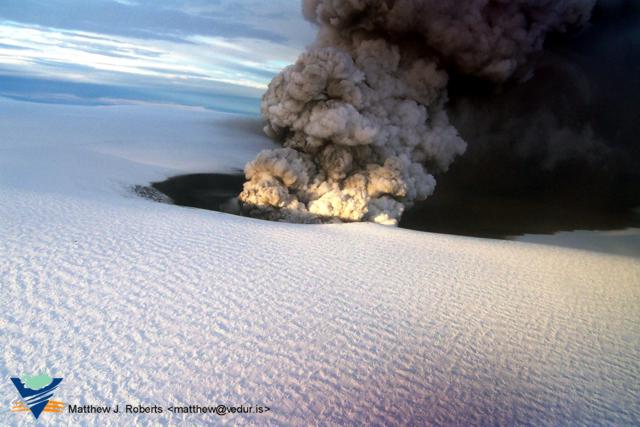 |
Figure 7. A view looking NW at the Grímsvötn eruption across an expanse of the Vatnajökull glacier. This photo was taken between 1530 and 1615 on 2 November 2004. Courtesy of the Icelandic Meteorological Office; photo credit, Matthew J. Roberts. |
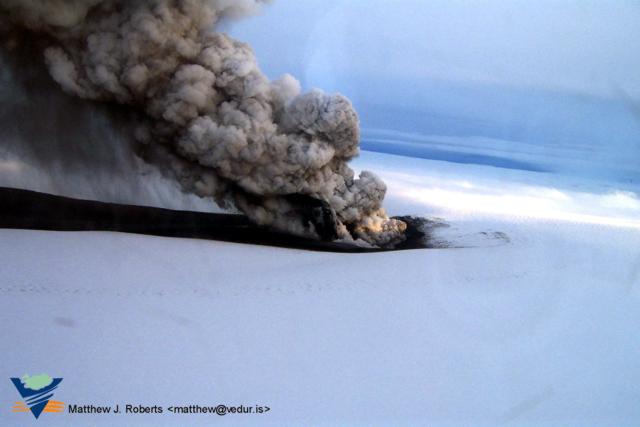 |
Figure 8. An E-looking aerial photograph showing ash falling from the Grímsvötn eruption plume, which at the time was far from vertical. The shot was taken between 1530 and 1615 on 2 November 2004. Courtesy of the Icelandic Meteorological Office; photo credit, Matthew J. Roberts. |
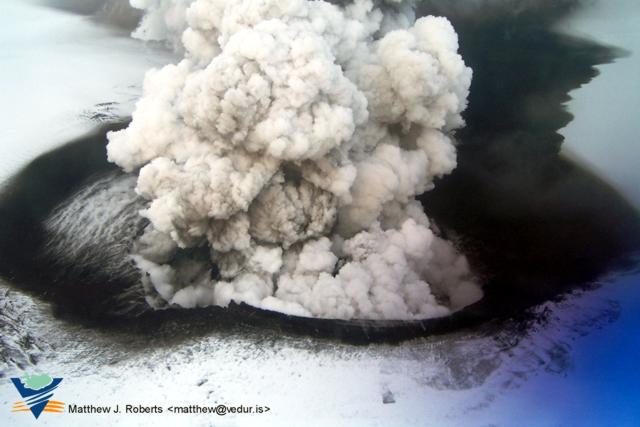 |
Figure 9. Close-up aerial view of the Grímsvötn eruption, taken from the S between 1530 and 1615 on 2 November 2004. Courtesy of the Icelandic Meteorological Office; photo credit, Matthew J. Roberts. |
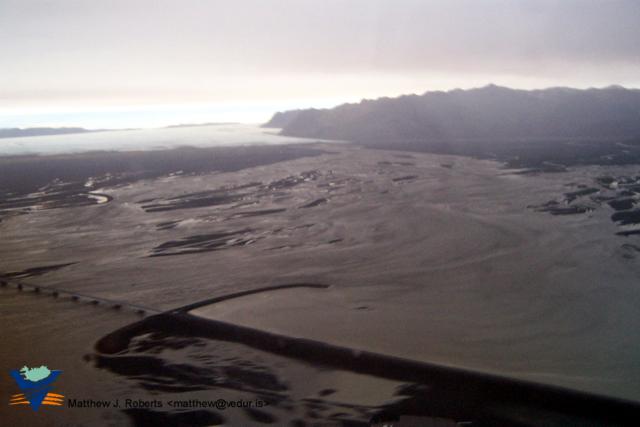 |
Figure 10. An aerial photo of the jökulhlaup from the Grímsvötn eruption, taken at 1630 on 2 November 2004 (at Skeidarar) looking inland towards the glacier (left, mid-background). The swollen, sediment-charged river system has locally inundated the coastal plains and challenged the roadway system engineered to cope with such occurrences. Courtesy of the Icelandic Meteorological Office; photo credit, Matthew J. Roberts. |
On 3 November, eruptive activity occurred in pulses, resulting in changing eruption column heights from 8-9 km to 13-14 km above the volcano. During the course of the eruption, ash plumes and tephra distributions imaged by satellites typically showed trends to the NE; in some cases plumes remained visible at least 150 km from the eruption site. A distal ash plume was observed in Norway, Finland, and Sweden.
On 9 November from 0630 to 1330 a tremor pulse was recorded, and on 11 November, from a little past 0900 and again around 1100, the seismic station at the volcano showed what the Iceland Meteorological Office called "increased jökulhlaup tremor." This tremor decreased after midnight on 12 November, increased from 0500 to 0830, then decreased again. The eruption followed a pattern similar to previous eruptions in 1983 and 1998, with probably less than 0.1 km3 of magma erupted.
According to scientists at the Iceland Meteorological Office and the Institute of Earth Sciences, University of Iceland, these eruptions, together with the 1996 Gjalp eruption N of Grímsvötn reflect much higher activity at Grímsvötn than during the middle part of last century, and may indicate that Grímsvötn is entering into a new period of high volcanism that may last for decades. Such a high activity period had been predicted on the basis of the observed cyclic volcanism in the area in the preceding millennium.
Geological Summary. Grímsvötn, Iceland's most frequently active volcano in recent history, lies largely beneath the vast Vatnajökull icecap. The caldera lake is covered by a 200-m-thick ice shelf, and only the southern rim of the 6 x 8 km caldera is exposed. The geothermal area in the caldera causes frequent jökulhlaups (glacier outburst floods) when melting raises the water level high enough to lift its ice dam. Long NE-SW-trending fissure systems extend from the central volcano. The most prominent of these is the noted Laki (Skaftar) fissure, which extends to the SW and produced the world's largest known historical lava flow in 1783. The 15 km3 basaltic Laki lavas were erupted over 7 months from a 27-km-long fissure system. Extensive crop damage and livestock losses caused a severe famine that resulted in the loss of one-fifth of the population of Iceland.
Information Contacts: Freysteinn Sigmundsson, Pall Einarsson, Magnus Tumi Gudmundsson, Thordis Hognadottir, Anette Mortensen, and Fredrik Holm, Institute of Earth Sciences, University of Iceland, Reykjavik, Iceland (URL: http://nordvulk.hi.is/, http://raunvisindastofnun.hi.is/); Steinunn Jakobsdottir, Matthew J. Roberts, Kristin Vogfjord, Ragnar Stefansson, and Pordur Arason, Icelandic Meteorological Office, Reykjavik, Iceland (URL: http://www.vedur.is/); London Volcanic Ash Advisory Center, Met Office, FitzRoy Road, Exeter, Devon EX1 3PB, United Kingdom (URL: http://www.metoffice.com/).