Report on St. Helens (United States) — June 2005
Bulletin of the Global Volcanism Network, vol. 30, no. 6 (June 2005)
Managing Editor: Richard Wunderman.
St. Helens (United States) Extrusion of smooth-surfaced dome lavas that later crumbled; explosions
Please cite this report as:
Global Volcanism Program, 2005. Report on St. Helens (United States) (Wunderman, R., ed.). Bulletin of the Global Volcanism Network, 30:6. Smithsonian Institution. https://doi.org/10.5479/si.GVP.BGVN200506-321050
St. Helens
United States
46.2°N, 122.18°W; summit elev. 2549 m
All times are local (unless otherwise noted)
Throughout the period covered by this report, March 2005 to July 2005, growth of the new lava dome inside the crater of St. Helens continued, accompanied by low rates of both seismicity and gas and ash emissions. The hazard status remained at 'Volcano Advisory' (Alert Level 2); aviation color code Orange. Results from a digital elevation model produced from imagery taken on 21 February showed the highest part of the new lava dome was 12 m higher than on 1 February; during that 3 week period the volume of dome and surrounding uplift had increased by 3 million cubic meters. The average rate of growth continued at ~2 m3/s. Figure 52 shows four views of changes to the lava dome during the period of this report. Figure 53 shows the seismicity and the time of the larger recognized explosions.
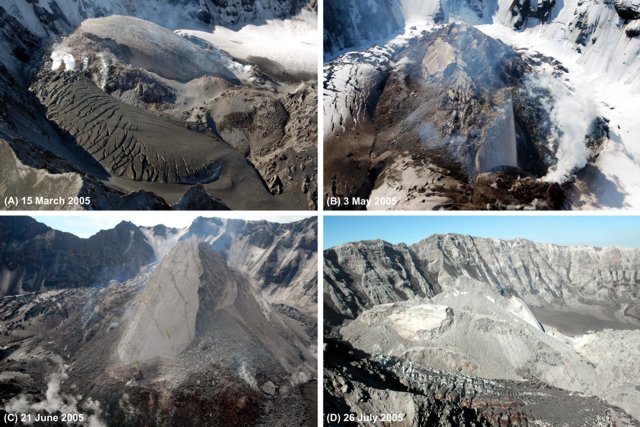 |
Figure 52. Four views into St. Helens's crater from different perspectives and dates, focusing on the new dome. A: 15 March 2005, view from NE. The whaleback is close to its maximum length of 500 m. Note that the glacier's heavily crevassed, half-moon shaped, E (left) arm lies squeezed between the growing dome and crater wall. Vent is steaming at lower-right whaleback. B: 3 May 2005, view from N. The whaleback has been breaking apart for several weeks. Note the large slab of smooth gouge-covered surface moving E (left). C: 21 June 2005, view from NW. Note the development of broad talus on W (right) flank of dome. An isolated body of smooth gouge-covered surface to the right of the main spine is emerging from talus. D: 26 July 2005, view from E crater rim. The smooth, gouge-covered spine continues to crumble as a result of M > 3 earthquakes and rockfalls. A large slab of March whaleback is visible at left. Most of the dome surface is now talus and disintegrating older whalebacks. By the end of July, the spine had been reduced to a highly fractured stump. All photos courtesy of USGS CVO. |
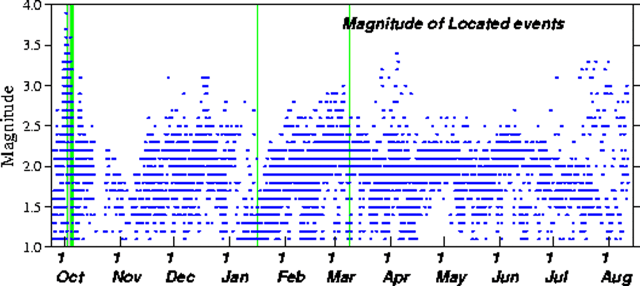 |
Figure 53. Magnitude of located earthquakes at Mount St. Helens through 27 July 2005 (Pacific Northwest Seismograph Network). Vertical lines represent the time of moderate explosions. Note periods of earthquakes M > 3 that accompanied dome break-ups in December, April, and July. Courtesy of CVO and the Pacific Northwest Seismograph Network. |
During 2-7 March, dome growth accompanied low rates of both seismicity and gas and ash emissions. Parts of the growing lava dome continued to crumble, forming rockfalls and generating small ash clouds that drifted out of the crater. The bulging ice on the deformed E arm of the glacier in the crater continued to move rapidly N at about 1.2 m per day (figure 54).
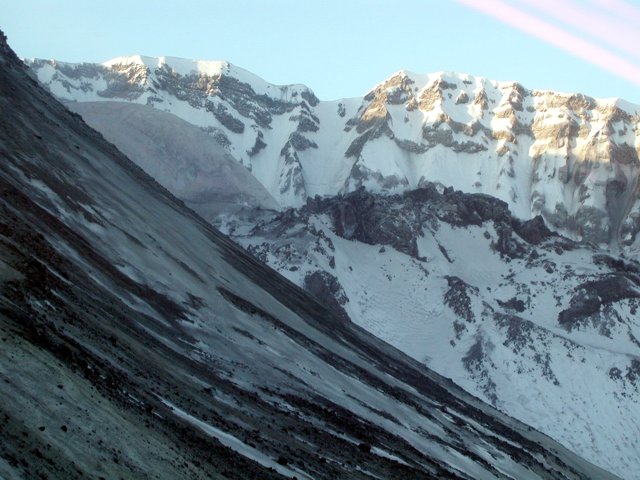 |
Figure 54. A view of the growing dome at St. Helens from the Sugar Bowl camera just before the 8 March 2005 explosion. The Sugar Bowl digital camera takes a picture every hour from its housing on the NE flanks. The image data are transmitted to a more accessible spot immediately after the pictures are taken. Courtesy of CVO. |
A small explosive event began at approximately 1725 on 8 March. The eruption lasted about 30 minutes with intensity gradually declining throughout; a fine dusting of ash from this event later fell ~ 100 km to NW (in Yakima, and Toppenish, Washington). By 0200 on 9 March, the leading edge of the faint, diffuse plume had reached ~ 300 km to the E (over western Montana). After the explosion scientists found the lava dome intact. They recognized ballistics (up to ~ 1 m in diameter) as far as the N flank of the old lava dome and a lack of them along or beyond the crater rim. The explosion vented from the NNW side of the new lava dome, very near the source of the 1 October 2004 and 16 January 2005 explosions (figure 55).
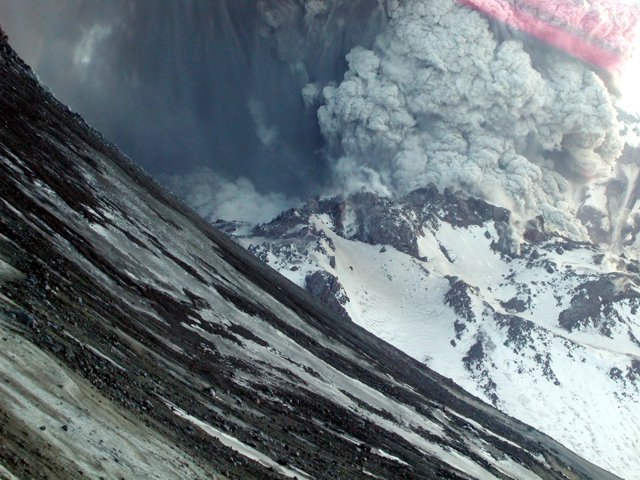 |
Figure 55. The 8 March 2005 explosion at St. Helens viewed from the Sugar Bowl camera. This shot was taken at about 1727 hours and 42 seconds on 8 March. Courtesy of CVO. |
The explosion on 8 March was one of the largest steam-and-ash emissions to occur since renewed activity began in October 2004. The Cascades Volcano Observatory (CVO) lost radio signals from three monitoring stations in the crater soon after the event started. The event followed a few hours of slightly increased seismicity not then interpreted as precursory. There were no other indications of an imminent change in activity.
After the 8 March explosion, St. Helens only emitted steam, and seismicity dropped to a level similar to that during the several hours prior to the explosion. Gas emissions were very low, essentially unchanged from those measured in late February. The hazard status for the ongoing eruption, 'Volcano Advisory (Alert Level 2),' mentioned the possibility of events like the 8 March explosion occurring without warning. That assessment remained unchanged and the hazard status stayed the same.
Analysis of aerial photographs indicated that as of 10 March the topographic changes in the crater resulting from growth of the new dome and consequent glacier deformation had a combined volume of about 45 million m3. The current eruption contributed new materials amounting to about two-thirds the volume of the old lava dome.
From March 2005 through July 2005, growth of the new lava dome continued. Rates remained low for both seismicity and gas and ash emissions. CVO noted that during such eruptions, episodic changes in the level of activity can occur over days to months. During about 26-27 March, a group of M 2 to M 3 earthquakes occurred beneath the volcano, a level of activity considered normal during dome-emplacing volcanism.
A series of large (M >=3) earthquakes occurred during 3-4 April, in addition to the typical array of smaller events. Observations on 6 April revealed that the smooth whaleback-shaped portion of the growing lava dome was broken by numerous fractures, and the edges had crumbled greatly. Several deep gashes on the E, N, and W sides frequently produced rockfalls and accompanying ash clouds. On 10 April the new dome continued to fracture and spread laterally. As a consequence, the dome's summit dropped by a few tens of meters over 2-3 weeks, leaving isolated high-standing remnants. This broken pattern was apparent in a photograph on 3 May (figure 5B).
Earthquakes steadily decreased in magnitude and number through mid-April. A GPS receiver 200 m N of the new dome crept steadily NNW at ~ 10 cm per day. The combination of the GPS measurements adjacent to the lava dome and the qualitative estimate of lateral spreading suggested that extrusion of new lava continued during April.
On the morning of 28 April there were reports of minor amounts of ashfall in the eastern part of the Portland metropolitan area, ~ 80 km SSW of St. Helens. There was no evidence of a new explosion. CVO scientists determined that large convective storms over the Cascades on 27 April entrained ash generated by the frequent hot rockfalls from the growing lava dome and kept it in suspension to fall out as far away as Portland.
During early May poor weather obscured the volcano. Seismic and ground deformation activity remained unchanged. Through much of the night of 4-5 May, however, VolcanoCam images detected intermittent glow from the new dome. The camera is mounted at the Johnston Ridge Observatory at an elevation of 1,400 m and ~ 6.5 km NNW of the volcano, a spot W of the S part of Spirit Lake. During 11-12 May images from the mouth of the crater showed the new spine of lava at the N end of the dome continuing to grow. Data from seismic and GPS instruments in the crater and on the outer flanks continued to lack significant changes over the past few weeks. Through the end of May, lava extrusion continued at the N end of the new lava dome, while the high spines continued to crumble. Other parts of the lava dome moved at the relatively low velocity of about 30 cm/day or remained stagnant. Table 7 compares the older dome with the new one as of 3 May 2005.
Table 7. A comparison of the old (1980-86) and new (2004-) domes at St. Helens. The new dome (unofficially called "the whaleback") started in October 2004, and the reported data reflects conditions seen until 1 February 2005. Courtesy of CVO.
| Feature | Old dome | New dome |
| Growth period | 1980-1986 (six years) | October 2004-February 2005 (and ongoing) |
| Size - length | ~1.1 km in diameter | ~475 m long |
| Size - width | ~1.1 km in diameter | ~152 m wide |
| Elevation / vertical height | 2.2 km, nearly 267 m above the 1980 crater floor. | As of 1 February 2005, 2.3 km, nearly 415 m above the 1980 crater floor, 152 m above the top of the old 1980-86 lava dome, and 213 m above the 2000 glacier surface. The new dome's top reached an elevation ~40 m below Shoestring Notch on the crater's SE rim. |
| Volume | ~75 x 106 m3 | ~44 x 106 m3 |
Around 4 June the rate of motion of a GPS unit on the NE part of the new dome slowed slightly, continuing to creep eastward and northward at a rate of several centimeters per day, but no longer rising vertically. The lava spine, however, continued to grow. Through the end of June 2005, seismic and deformation data continued trends similar to the previous few weeks, with small earthquakes approximately every 5 minutes, little to no movement of the old lava dome, minor movement of the N end of the new lava dome, and continued growth of the lava spine. Observations made on 15 June revealed that the lava spine continued to grow and that temperatures in cracks near the base of the spine were near 700°C. Thermal data from 15 June suggested that much of the W part of the dome was moving upward, as well as southward. During the last week of June, the smooth lava spine continued to grow at a rate of about 1.8-3.7 m per day. Rockfalls from the top of the spine kept its height from increasing by that same rate. Analysis of a digital elevation model made from imagery acquired on 15 June showed that the total volume addition to the crater since September 2004 had reached almost 60 million cubic meters.
On 2 July at 0630 a rockfall from the growing lava dome removed a large piece of the dome's top, producing an ash plume that rose above the crater rim and generating a substantial seismic signal. Persistent smaller rockfalls from the growing lava dome built talus aprons on the W and NE flanks of the dome.
On 12 July, CVO reported that rates of seismicity and ground deformation at Mount St. Helens had declined during the previous two weeks to some of the lowest levels since the eruption began in September 2004. A similar lull occurred in December 2004.
Beginning 15 July and continuing through the end of the month, the growing spine and other high areas of the dome to the south produced numerous large rockfalls, most of which were associated with earthquakes of about M 3 (figure 56). Diffuse ash plumes that rose hundreds of meters above the rim were produced by the larger rockfalls. By the end of July most of the smooth gouge-covered surface of the spine had disintegrated, and the spine was reduced to a highly fractured, but still-extruding, stump surrounded by rapidly growing aprons of rockfall debris.
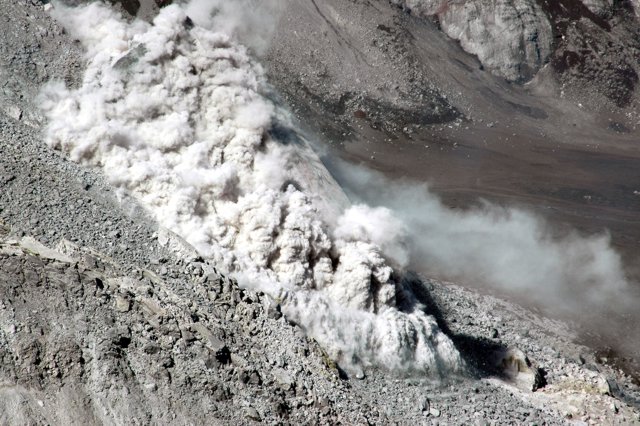 |
Figure 56. Rockfall and accompanying ash cloud on 26 July 2005 as viewed from station Brutus on the crater's E rim. Rockfall originated from the steep, fractured top of an inclined spine. Note boulders (light-colored specks against shadow) shooting ahead of ash cloud. Another spine is extruding from ground just behind the lower end of the ash cloud. Courtesy USGS and CVO. |
Geological Summary. Prior to 1980, Mount St. Helens was a conical volcano sometimes known as the Fujisan of America. During the 1980 eruption the upper 400 m of the summit was removed by slope failure, leaving a 2 x 3.5 km breached crater now partially filled by a lava dome. There have been nine major eruptive periods beginning about 40-50,000 years ago, and it has been the most active volcano in the Cascade Range during the Holocene. Prior to 2,200 years ago, tephra, lava domes, and pyroclastic flows were erupted, forming the older edifice, but few lava flows extended beyond the base of the volcano. The modern edifice consists of basaltic as well as andesitic and dacitic products from summit and flank vents. Eruptions in the 19th century originated from the Goat Rocks area on the N flank, and were witnessed by early settlers.
Information Contacts: Cascades Volcano Observatory (CVO), U.S. Geological Survey, 1300 SE Cardinal Court, Building 10, Suite 100, Vancouver, WA 98683-9589, USA (URL: https://volcanoes.usgs.gov/observatories/cvo/); Pacific Northwest Seismograph Network (PNSN), Seismology Lab, University of Washington, Department of Earth and Space Sciences, Box 351310, Seattle, WA 98195-1310, USA (URL: http://www.pnsn.org/).