Report on Kilauea (United States) — June 2005
Bulletin of the Global Volcanism Network, vol. 30, no. 6 (June 2005)
Managing Editor: Richard Wunderman.
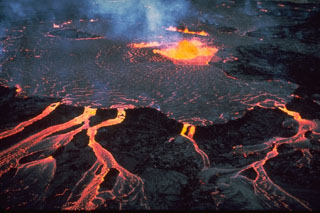
Kilauea (United States) During November 2004-January 2005 lava flows continued to enter the sea
Please cite this report as:
Global Volcanism Program, 2005. Report on Kilauea (United States) (Wunderman, R., ed.). Bulletin of the Global Volcanism Network, 30:6. Smithsonian Institution. https://doi.org/10.5479/si.GVP.BGVN200506-332010
Kilauea
United States
19.421°N, 155.287°W; summit elev. 1222 m
All times are local (unless otherwise noted)
Activity at Kīlauea through October 2004 was previously reviewed in reports that included maps showing the extent of key lava flows through most of August 2004 (BGVN 29:09). During November 2004 through January 2005, lava flows were abundant and made complex patterns. Their overall advance can be seen by comparing maps of the extent of the lava flows as of late August 2004 (figure 169) and 2 February 2005 (figure 170).
 |
Figure 169. Kīlauea lava flows erupted during activity from 1983-August 2004 of Pu`u `O`o and Kupaianaha. Note the location of Kupaianaha, the active vent area during 1986-1992, ~ 4 km ENE of Pu`u `O`o. Courtesy of the U.S. Geological Survey's Hawaiian Volcano Observatory. |
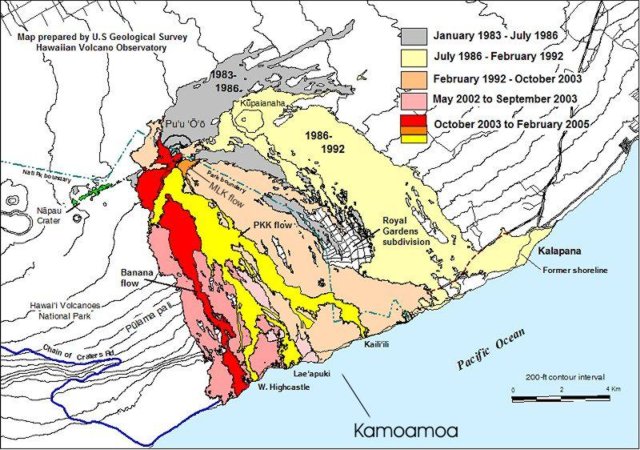 |
Figure 170. Kīlauea lava flows erupted during activity from 1983-2 February 2005 of Pu`u `O`o and Kupaianaha. Courtesy of the U.S. Geological Survey's Hawaiian Volcano Observatory. |
On 4 November 2004 lava from the Prince Kuhio Kalaniana `ole (PKK) flow entered the sea, forming a new delta seaward of the E end of the old Lae'apuki delta. The PKK flow has been continuously active since 26 July 2004, and lava continued to enter the sea through 26 November 2004. This was the first time lava entered the sea since the Banana lava flow ceased in early August 2004. The Banana flow developed from breakouts when lava escaped from the confines of the Mother's Day lava tube, emerging near the former Banana Tree kipuka. This flow stagnated early in September 2004, and the Mother's Day tube ceased carrying lava late in 2004.
During the first week in December 2004, the lava flow at Lae'apuki abated. Activity resumed during the second week along all areas of the PKK flow from high on the Pulama pali fault scarp. By 13 December lava again entered the sea at the East Lae'apuki delta. The flow moderated during the second half of December with only several areas of visible surface lava apparent on the Pulama pali fault scarp and on the coast.
New vents opened at the southern base of Pu`u `O`o on 19 January 2004 and fed the Martin Luther King (MLK) flows (figure 11). The PKK flow originated from two vents ~ 250 m S of the base of Pu `u `O`o. By 2 February 2005 the PKK flow had entered the sea at West Highcastle, Lae'apuki, and Ka`ili`ili (figure 11).
During January 2005, surface lava was visible along the three main arms of the PKK flow as they advanced downslope towards the coast (figure11). The middle arm of the PKK flow was comparatively small, and it failed to reach the ocean during this reporting interval; it remained high on Pulama pali. In contrast, lava from the E and W arms of the PKK flow began to enter the ocean on 31 January. The large E arm of the PKK lava flow fed the larger Ka`ili`ili entry. The W branch of the PKK lava flow once supplied lava to Lae'apuki (an E branch of the W arm), but later also began feeding the West Highcastle ocean entry (the W branch of the W arm, figure 11).
Seismicity. After seven months of relative quiescence renewed seismicity and numerous small long-period (LP) events again became visible in November 2004 on the North Pit seismogram. Elevated activity began on 16 November, peaking at over 2,000 events a day by late November (figure 171). Nearly all of these earthquakes were too small to catalog. To obtain this plot, a daily event count was extrapolated from a representative part of the North Pit (NPT) seismogram. Scientists combined the counts for two shallow (0-5 km deep) earthquake types, those designated by HVO as short-period summit or short-period caldera (SPC) and those designated as shallow, long-period (long-period caldera A, LPC-A) earthquakes. The similar frequency content of these two kinds of earthquakes make them difficult to distinguish on the drum record. In addition, small-magnitude deeper earthquakes, designated as long-period earthquakes originating at depths over 5 km, may have also registered within the summit caldera to appear on the plot, although they would be expected to contain a lower dominant frequency of oscillation than the LPC-A earthquakes. Tremor episodes were rare or absent.
 |
Figure 171. A time series of Kīlauea's daily earthquakes (SPC, LPC-A, and possibly LPC-C types) registered at the summit during October 2004 through January 2005. Courtesy of U.S. Geological Survey's Hawaiian Volcano Observatory. |
A minor peak in seismicity occurred in later January, during the two days before and after the 25 January inflation-deflation event. Most of the events on 25 January appeared to be of the SPC variety.
Tilt and deformation. The tiltmeter record at Kīlauea summit (UWE) and Pu`u `O`o (POC) showed numerous correlated tilt changes, with a short time delay between UWE and POC stations and larger magnitude delays at POC (figure 172). One of the largest of these deformations took place on 25-26 November and resulted in about 3 microradians of tilt at UWE, and 5 microradians at POC. This was similar in character to the tilt events of recent months, starting with fairly rapid deflation, followed by a similar rate and magnitude of inflation. Though they differ in character from the deflation-inflation-deflation (DID) cycles of the past few years, they seem to be originating from the same shallow storage area near Halemaumau, the crater at Kīlauea's summit.
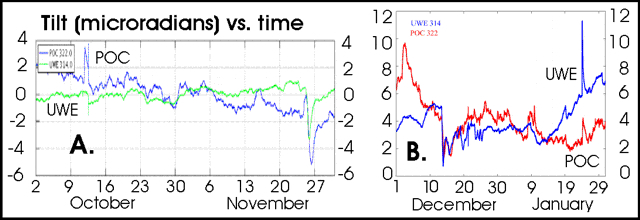 |
Figure 172. Electronic tiltmeter records from the N flank of Pu`u `O`o cone (POC) and NW rim of Kīlauea caldera (UWE) for (A) October and November 2004 and (B) December 2004 through January 2005. Only the radial component is plotted, i.e., the direction that maximizes signal from the most common sources of tilt at both locations. Courtesy of U.S. Geological Survey's Hawaiian Volcano Observatory. |
Kīlauea continued to inflate over this reporting period. The extension rate across the summit increased dramatically in early January 2005, from an average rate of about 8 cm/yr to over 40 cm/yr. There was a short inflation-deflation event on 25 January, followed by about 2-3 days of extremely rapid movement of the S flank; continuous GPS stations on the S coast were displaced by up to 2 cm. The pattern and rate of motion are very similar to the slow earthquake of November 2000. The slip event occurred during a swarm of earthquakes (see seismic section above), but the cumulative magnitude of these earthquakes was not nearly as great as the estimated equivalent moment magnitude of the slip.
Other large episodes of correlated multistation tilt occurred on 14 December 2004 and 25 January 2005. In December, both UWE and POC recorded deflationary tilts of about 4 and 2.5 microradians, respectively, over about 12 hours. In mid-January, the summit started showing a high rate of inflationary tilt, coinciding with the increase in cross-summit extension, measured by continuously recording GPS. In the early morning of 25 January, summit tiltmeters and POC recorded a rapid inflation (about 5.5 microradians in an hour at UWE, 2 at POC) followed by an equal amount of deflation over the next day. The event was similar to the fairly frequent deflation-inflation-deflation (DID) events at Kīlauea. Similarities included the apparent source regions of the inflation, the seismic signature, the delay time between the summit and the rift zone, and the timing of increased activity.
SO2 emission rate measurements. Summit SO2 emission rates for October/November ranged from 80 to 130 metric tons per day (t/d) with an average of 105 t/d (standard deviation, s.d.=20 t/d for 36 measurements made over 6 days). Although this represents a slight decrease over emission rates measured during the previous reporting period, it does not represent a significant change. Correlation spectrometer (COSPEC) SO2 measurements along the Chain of Craters Road yielded SO2 flux rates of 1,080-1,660 t/d with a mean value of 1,270 t/d (s.d. of 260 t/d for 27 measurements made over 4 days). The drop in emissions, which began in May 2004, had continued through November 2004. A lack of trade winds hindered SO2 flux measurements during November and December. Six traverses on 6 December yielded an emission rate of 105 t/d (s.d.=10 t/d) consistent with the more frequent measurements made during September-October 2004. The return of the tradewinds in early February allowed measurements to resume and showed that summit emissions had decreased markedly, likely due to the heavy rainfall on 4 February.
Geological Summary. Kilauea overlaps the E flank of the massive Mauna Loa shield volcano in the island of Hawaii. Eruptions are prominent in Polynesian legends; written documentation since 1820 records frequent summit and flank lava flow eruptions interspersed with periods of long-term lava lake activity at Halemaumau crater in the summit caldera until 1924. The 3 x 5 km caldera was formed in several stages about 1,500 years ago and during the 18th century; eruptions have also originated from the lengthy East and Southwest rift zones, which extend to the ocean in both directions. About 90% of the surface of the basaltic shield volcano is formed of lava flows less than about 1,100 years old; 70% of the surface is younger than 600 years. The long-term eruption from the East rift zone between 1983 and 2018 produced lava flows covering more than 100 km2, destroyed hundreds of houses, and added new coastline.
Information Contacts: Hawaiian Volcano Observatory (HVO), U.S. Geological Survey, PO Box 51, Hawaii National Park, HI 96718, USA (URL: https://volcanoes.usgs.gov/observatories/hvo/).