Report on Anatahan (United States) — May 2006
Bulletin of the Global Volcanism Network, vol. 31, no. 5 (May 2006)
Managing Editor: Richard Wunderman.
Anatahan (United States) Eruptions restarted in 2005 and continued until at least June 2006
Please cite this report as:
Global Volcanism Program, 2006. Report on Anatahan (United States) (Wunderman, R., ed.). Bulletin of the Global Volcanism Network, 31:5. Smithsonian Institution. https://doi.org/10.5479/si.GVP.BGVN200605-284200
Anatahan
United States
16.35°N, 145.67°E; summit elev. 790 m
All times are local (unless otherwise noted)
Anatahan erupted almost continuously from 5 January 2005 until 3 September 2005 when eruptions suddenly ceased (BGVN 30:07, 30:08). Observations through 16 September indicated relative quiet. Indications from later reports (discussed below) are that this lull continued through at least mid- to late-February 2006. Eruptions resumed after that, although the observations suggest chiefly or entirely gas-rich plumes. Jenifer Piatt suggested that plumes after early September 2005 and through May 2006 rose only to low altitude, perhaps 2,500 m.
This report covers the period through early June 2006 and includes both field observations as well as several satellite-based SO2 measurements, and extensive satellite images of thin plumes assessed as vog (volcanic smog; table 5). Some of those plumes extended W to SW from Anatahan and had overall atmospheric SO2 masses on the order of up to 4 kilotons (kt).
Table 5. AURA/OMI SO2 from Anatahan plumes at stated dates in 2006 (the two indicated with asterisks ("**") shown as figures). The last column displays the plume's overall estimated SO2 mass. The second and third columns indicate, respectively, the area of the sulfurous plume, and the estimated maximum SO2 concentration (in DU) and its latitude and longitude. Courtesy of Simon Carn.
| Date | Time (UTC) | Orbit | Area of plume (km2) | Highest concentration in Dobson Units (DU) | Coordinates | Atmospheric SO2 (kilotons) |
| 15 Mar 2006 | 0400-0420** | 08852 | -- | -- | -- | 1-2 |
| 12 Apr 2006 | 0249-0428** | -- | 9.1 x 10⁴ | 1.9 DU | 13.16°N, 137.26°E | 2.2 |
| 16 Apr 2006 | 0401-0404 | 09318 | 9.8 x 10⁴ | 6.7 DU | 16.28°N, 145.39°E | 3.9 |
| 23 Apr 2006 | 0407-0410 | 09420 | 11.0 x 10⁴ | 4.6 DU | 17.42°N, 143.06°E | 3.5 |
| 31 May 2006 | 0331-0334 | 09979 | 4.8 x 10⁴ | 3.0 DU | 16.07°N, 145.24°E | 1.4 |
During the week ending 19 September 2005, there were three periods of elevated tremor. On 13 September, technicians from the Emergency Management Office of the Commonwealth of the Northern Mariana Islands (EMO-CNMI) who were reinstalling seismic station ANA2 on Anatahan reported that the plume was gray, small, and moving to the NW. They heard no explosions and saw no craters or large ballistics in vicinity of ANA2.
CMNI-USGS reports for 3 September until at least 26 December 2005 noted an absence of erupted ash. At least as late as 27 February 2006, Anatahan lacked reported ash emissions. Also as late as the 27th, seismicity was at background levels, amounting to a few percent of the late June 2005 maximum, with occasional long-period earthquakes. On 27 February 2006, the Alert level was reduced to Normal and the Aviation Color Code to Green because of the continuing low levels of activity.
By the date of the next USGS update, on 20 March 2006, activity had increased somewhat and the Alert level was raised to Advisory and the Aviation Color Code to Yellow. A faint, thin plume of gas that was occasionally observable during January and February became continuous and slightly more dense on satellite imagery during the first three weeks of March.
Using the Ozone Monitoring Instrument (OMI) on NASA's EOS/Aura satellite, Simon Carn imaged Anatahan's plume of 15 March 2006 (figure 27). Anatahan lies at the solid triangle; the plume blew largely SW. Carn found that the atmospheric SO2 mass was 1-2 kilotons. He noted that there had been an upsurge in satellite-detected SO2 output that began in mid-February 2006. The highest concentrations of several OMI analyses (table 6 and figure 28) were measured on 16 and 23 April (3.9 and 3.5 kilotons of SO2, respectively).
Table 6. A summary of Anatahan plume data based on US AFWA satellite observations during 15 March to 31 May 2006. DMSP stands for Defense Meteorological Satellite Program. Courtesy of Charles Holliday and Jenifer E. Piatt, AFWA.
| Date | Time (UTC) | Satellite (resolution or wavelength) | Observation |
| 15 Mar 2006 | 0354 | Aqua Modis (500 m res.) | Faint vog plume seen drifting generally SSW |
| 16 Mar 2006 | 0125 | Terra Modis (500 m res.) | Vog seen drifting generally to the SW |
| 17 Mar 2006 | 0330 | Aqua Modis (1 km res.) | Cloud cover obscured visibility |
| 18 Mar 2006 | 0415 | Aqua Modis (500 m res.) | Vog plume appears longer and more dense, drifting generally SW |
| 19 Mar 2006 | 0320 | Aqua Modis (500 m res.) | Moderately dense vog plume, extending over 370 km SW. No signature has been visible on MTSAT split window IR imagery nor NOAA channel differencing images, suggesting minimal ash content in the plume. |
| 19 Mar 2006 | 1606 | NOAA-18 Shortwave IR (3.55-3.93 µm) | Hot spot visible at island |
| 19 Mar 2006 | 2221 | DMSP F-16 Visible (566 m res.) | A very faint plume discernable out to 230 km SW from source |
| 20 Mar 2006 | 0400 | Aqua Modis (500 m res.) | Vog plume drifting S and SW |
| 20 Mar 2006 | 2209 | DMSP F-16 Visible (556 m res.) | Very light vog drifting SSW |
| 21 Mar 2006 | 0305 | Aqua Modis (500 m res.) | Distinct vog plume drifting SSW |
| 21 Mar 2006 | 1546 | NOAA-18 Shortwave IR (3.55-3.93 µm) | Hot spot indicated at island |
| 24 Mar 2006 | 0035 | Terra Modis (500 m res.) | Vog plume drifting W then NW |
| 24 Mar 2006 | 0804 | DMSP F-13 Visible (1.11 km res.) | Plume extended at least 833 km W before curling N. Using shadows, the plume is estimated at below ~1.2 km (4,000 ft). |
| 29 Mar 2006 | 1604 | NOAA - 18 Shortwave IR (3.55-3.93 µm) | Hot spot indicated at island |
| 29 Mar 2006 | 2110 | DMSP F-13 Visual (1.11 km res.) | Steam measures 37 km W and vog measures ~320 km SW and ~670 km NNE of the summit. Tops are estimated below ~1.5 km (5,000 ft). |
| 29 Mar 2006 | 2110 | DSMP F-13 Visual (556 m res.) | Steam and vog visible at island; greater detail of vog trending ~320 km to SW |
| 30 Mar 2006 | 0820 | DMSP F-13 Visual (1.11 km res.) | Steam measured 56 km NW; vog measured ~600 km SW and ~670 km NNE of the summit. Tops are estimated below ~1.5 km (5,000 ft). |
| 30 Mar 2006 | 1554 | NOAA 18 Shortwave IR (3.55-3.93 µm) | Hot spot detected at the island |
| 02 Apr 2006 | 1953 | NOAA18 Shortwaave IR (3.55-3.93 µm) | Hot spot detected |
| 04 Apr 2006 | 0320 | Aqua Modis (500 m res.) | Cloud formation along the vog plume with tops estimated at below ~3 km (10,000 ft) |
| 04 Apr 2006 | 0559 | DMSP-F-12 Visual (556 m res.) | Vog measures 210 km SSW of the summit |
| 14 Apr 2006 | 0355 | Aqua Modis (500 m res.) | Vog drifting over ~390 km SW |
| 14 Apr 2006 | 0808 | DMSP F-13 Visual (556 m res.) | Vog seen drifting over ~ 500 km SW, expanding extensively as it spreads |
| 17 Apr 2006 | 0125 | Terra Modis (500 m res.) | Light vog plume blown over 400 km WSW to W |
| 17 Apr 2006 | 1612 | NOAA-18 Shortwave IR (3.55-3.93 µm) | Hot spot visible |
| 17 Apr 2006 | 2143 | DMSP F-13 Visual (556 m res.) | Vog measures over 490 km WSW |
| 22 Apr 2006 | 2153 | DMSP F-16 Visual (556 m res.) | Faint vog plume trended ~40 km NW |
| 23 Apr 2006 | 0045 | Terra Modis (250 m res.) | Possible gray steam/ash plume extending under 28 km NW and vog extending over 155 km NW |
| 23 Apr 2006 | 1954 | NOAA-17 Shortwave IR (3.55-3.93 µm) | Hot spot detected at island |
| 24 Apr 2006 | 0130 | Terra Modis (500 m res.) | Visible vog trended ~325 km W then curved ~130 km NE and dissipated |
| 23 May 2006 | 0430 | Aqua Modis (500 m res.) | Vog seen drifting generally W, then curving S and SW |
| 23 May 2006 | 0710 | NOAA 15 Visual (1.85 km res.) | Vog trending generally SW then W for ~390 km |
| 26 May 2006 | 0130 | Terra Modis (500 m res.) | Vog trending WNW(?) |
| 26 May 2006 | 0800 | DMSP F-16 Visual (2.78 km res.) | Vog seen drifting WSW for up to 1,250 km |
| 26 May 2006 | 1234 | NOAA 17 Shortwave IR (3.55-3.93 µm) | Hot spot detected at the island |
| 30 May 2006 | 2120 | DMSP F-14 Visible (2.77 km res.) | Plume extends over 1,480 km to the WSW |
| 30 May 2006 | 2120 | DMSP F-14 Visible (556 m res.) | Plume extends over 1,480 to the WSW. NASA Aura/OMI estimated the columnar SO2 concentration associated with the plume. |
| 31 May 2006 | 0315 | Aqua Modis (500 m res.) | Vog seen drifting generally to the SW, with great dispersion |
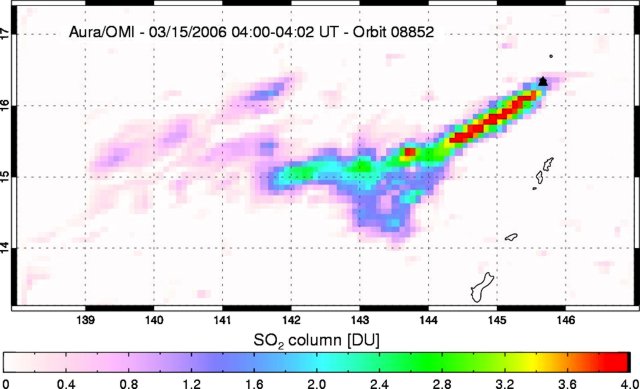 |
Figure 27. AURA/OMI image of SO2 from Anatahan at 0400-0420 UTC on 15 March 2006 (orbit 08852). The overall estimated SO2 mass in the 15 March plume was 1-2 kilotons. Concentration path-lengths for the atmospheric column are scaled in Dobson Units (DU). This is an example of a comparatively short plume, with greatest SO2 concentrations nearest the source, and blown somewhat more southerly than some of the later ones. Courtesy of Simon Carn. |
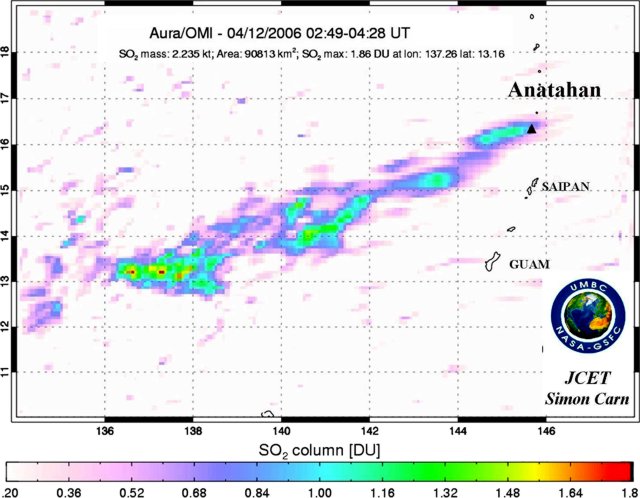 |
Figure 28. AURA/OMI image of SO2 from Anatahan at 0249-0428 UTC on 12 April 2006. The overall estimated SO2 mass in the 12 April plume was 2.2 kilotons (for other parameters and comparisons, see table 6). This is an example of a comparatively elongate plume, with highest SO2 registered in areas ~1,000 km ESE of the source. Courtesy of Simon Carn. |
OMI is a Dutch-Finnish imaging spectrometer that measures ozone and other atmospheric trace gases such as SO2. OMI is a nadir-viewing imaging spectrometer that covers the ultraviolet and visible spectral range (270-500 nm). Its high spatial resolution increases the chance of observing cloud-free pixels, thereby enhancing the accuracy of the data products. OMI observes a strip of the Earth's surface about 2,600-2,800 km wide in one shot. The satellite's own movement along with Earth's rotation enables OMI to scan the entire globe. A two-dimensional CCD detector records both the complete swath and the spectrum of every ground pixel in the swath. The spatial information is imaged on one dimension of the CCD detector while the spectrum is projected along the other dimension of the CCD detector. OMI detects the total column amount of SO2 between the sensor and the Earth's surface and maps this quantity as it orbits.
On 17 March around 2200 UTC, the level of seismicity nearly doubled and continued at that level for 2 hours. On the 18th around 1400 UTC, the level of seismicity again nearly doubled and continued at that level for about 8 hours before returning to the baseline level prior to 17 March. The increased seismicity consisted of small (M 0-1) long-period earthquakes occurring approximately every minute, sometimes reaching two per minute. A total of about 600 such events were detected during 17 and 18 March. Volcanic Ash Advisories were issued by the Washington VAAC; plumes appeared to contain gas and only insignificant amounts of ash.
According to the Air Force Weather Agency (AFWA), on 19 March a hot spot at Anatahan was visible on satellite imagery. Vog (volcanic smog) extended 200 km from the island (figure 29).
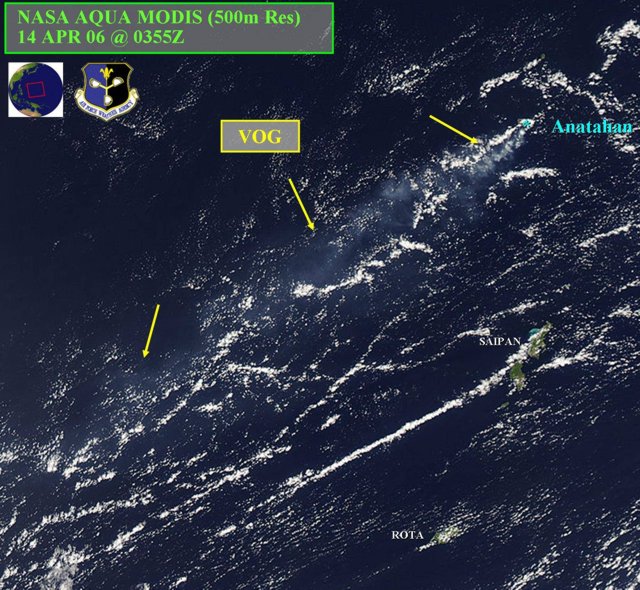 |
Figure 29. Anatahan's SW-drifting plume at 0320 UTC on 19 March as seen in a satellite image (AQUA MODIS, 500 m resolution) The US Air Force Weather Agency (AFWA) analysts interpreted this plume as vog. Courtesy of AFWA and NASA. |
On 24 March around 1330, seismicity at Anatahan abruptly increased to about twice the background level. The seismicity consisted of low-amplitude tremor and small, long-period earthquakes, similar to the seismicity on 17 and 18 March. On 24 March, vog from Anatahan was visible on satellite imagery extending W, then curling N. The plume was estimated to be below 1.2 km altitude, and no ash or hot spots were visible. Anatahan remained at Alert level Advisory; Aviation Color Code Yellow (Volcanic activity has increased somewhat, but remains fairly low and is being closely monitored).
From 28 March to 4 April, seismic levels fluctuated. Seismicity again jumped up to about double the background level for a few hours on 29 and 31 March and 2 April. Anatahan continued to produce a gas-and-steam plume visible in satellite imagery. On 4 April, Saipan residents reported smog and the smell of sulphur.
On 8 April a team from EMO-CNMI visited Anatahan and found steam and gas discharging from the E crater along the SW crater wall above a discolored lake. Testing confirmed the presence of SO2 and H2S in the plume. The plume rose to an altitude of less than 2 km and drifted to the NW as brownish vog. No ash fell from the plume onto the island. Based on these results and satellite surveillance, Anatahan was inferred to be emitting steam, gas, and vog.
Three long-period earthquakes occurred on 14 and 15 April. Each was preceded by several minutes of significantly reduced seismicity. AFWA reported that a hot spot was visible on NOAA shortwave IR imagery on 17 April at 1612 UTC, and vog extended over 490 km WSW in F-13 imagery on 17 April at 2143 UTC. SO2 mass values for 23 April were the second highest in this reporting interval. On 24 April 2006 AFWA reported that hot spots were occasionally visible and that vog was nearly always visible in satellite images.
Throughout May 2006, Anatahan's E crater continued to emit vog that was visible in MODIS imagery. Seismicity levels were low throughout April and May. A few to several microearthquakes occurred each day, all with magnitudes M 1 or smaller.
Ash may have erupted in late May. Although ash was indicated on radar on 27 May, and in a pilot's report for 29 May, those events took place during intervals of such low seismicity that people watching that data felt eruptions were unlikely to have occurred then.
On the other hand, based on a pilot report, the Washington VAAC declared that an ash plume from Anatahan reached an altitude of 3 km on 29 May and drifted W. Vog issuing from the E crater was visible on satellite imagery at about 1333 on 29 May 2006, and increased prior to emission of an ash plume. A report issued from the Washington VAAC on 30 May at 0535 indicated a faint, low-level gas-and-ash plume extending from the summit. At 2120 UTC on 30 May the plume extended over 1,480 km WSW.
By 19 June continued gas and steam emissions remained visible in satellite imagery. Seismicity dropped from recent levels and occasional microearthquakes were recorded locally.
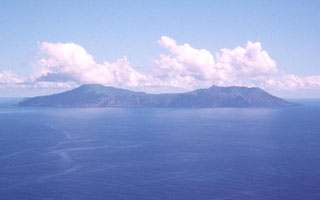
Geological Summary. The elongate, 9-km-long island of Anatahan in the central Mariana Islands consists of a large stratovolcano with a 2.3 x 5 km compound summit caldera. The larger western portion of the caldera is 2.3 x 3 km wide, and its western rim forms the island's high point. Ponded lava flows overlain by pyroclastic deposits fill the floor of the western caldera, whose SW side is cut by a fresh-looking smaller crater. The 2-km-wide eastern portion of the caldera contained a steep-walled inner crater whose floor prior to the 2003 eruption was only 68 m above sea level. A submarine cone, named NE Anatahan, rises to within 460 m of the sea surface on the NE flank, and numerous other submarine vents are found on the NE-to-SE flanks. Sparseness of vegetation on the most recent lava flows had indicated that they were of Holocene age, but the first historical eruption did not occur until May 2003, when a large explosive eruption took place forming a new crater inside the eastern caldera.
Information Contacts: Juan Takai Camacho and Ramon Chong, Emergency Management Office of the Commonwealth of the Northern Mariana Islands (EMO-CNMI), PO Box 100007, Saipan, MP 96950, USA (URL: http://www.cnmihsem.gov.mp/); Simon Carn, Joint Center for Earth Systems Technology (JCET), University of Maryland Baltimore County (UMBC), 1000 Hilltop Circle, Baltimore, MD 21250, USA; Charles Holliday and Jenifer E. Piatt, U.S. Air Force Weather Agency (AFWA)/XOGM, Offutt Air Force Base, NE 68113, USA.