Report on Soufriere Hills (United Kingdom) — April 2007
Bulletin of the Global Volcanism Network, vol. 32, no. 4 (April 2007)
Managing Editor: Richard Wunderman.
Soufriere Hills (United Kingdom) Seismic activity continues at a reduced level through 1 June
Please cite this report as:
Global Volcanism Program, 2007. Report on Soufriere Hills (United Kingdom) (Wunderman, R., ed.). Bulletin of the Global Volcanism Network, 32:4. Smithsonian Institution. https://doi.org/10.5479/si.GVP.BGVN200704-360050
Soufriere Hills
United Kingdom
16.72°N, 62.18°W; summit elev. 915 m
All times are local (unless otherwise noted)
Activity returned to normal levels following the strong explosive episode of 10 September 2006 (BGVN 31:09). Activity after September included an occasional minor explosions, rockfalls, minor pyroclastic flows, venting of ash and gases and steam with emissions reaching up to 3 km altitude, minor ashfalls, and mudflows during heavy rains. In September and October, the minor pyroclastic flows primarily moved down the N and NE flanks of the dome. In January, pyroclastic flows traveled down the Gages Valley, Tyres Ghaut, Belham Valley, Tuits Ghaut, Farrells Plain, and especially the lower Tar River Valley E of the volcano.
Lava-dome growth slowed in March, and by the end of April it appeared to have ceased. On 1 June Montserrat Volcano Observatory (MVO) (figure 75) warned that, while the lava extrusion had ceased and the dome may not be actively growing, it remains as a large mass of partially molten lava capable of collapsing or exploding. According to MVO, the amount of material above Tyres Ghaut to the NW was sufficient to generate pyroclastic flows and surges capable of affecting the lower Belham Valley and other areas.
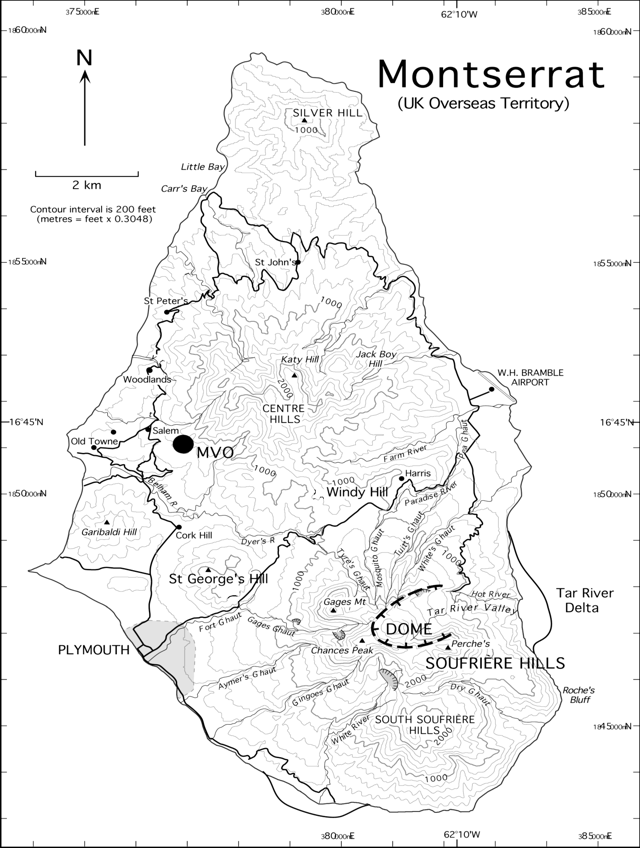 |
Figure 75. Map of Montserrat showing the pre-eruption topography of Soufrière Hills. The black circle shows the location of the MVO. The approximate outline of the Tar River delta in July 2004 is shown. Courtesy of Wadge and others (2005). |
Data provided by MVO (table 64) shows the elevated seismicity (hybrid earthquakes and rockfall signals) related to the increased activity in late August and early September (BGVN 31:09). The high number of long-period earthquakes in late June reflects the dome collapse at that time (BGVN 31:05). The dramatic decrease in long-period events and rockfalls in mid-March corresponds to the observed reduction in dome growth.
Table 64. Seismicity at Soufrière Hills between 16 June 2006 and 25 May 2007. * Data for the first 4 days only. VT: volcanic tectonic; LP: long-period. Courtesy of MVO.
| Date | Hybrid EQ's | Volcano-tectonic EQ's | Long-period EQ's | Rockfall signals | SO2 flux (metric tons/day) |
| 16 Jun-23 Jun 2006 | -- | -- | 32 | 51 | -- |
| 23 Jun-30 Jun 2006 | 54 | 4 | 1236 | 100 | -- |
| 30 Jun-07 Jul 2006 | 17 | 6 | 448 | 194 | 593 |
| 07 Jul-14 Jul 2006 | 2 | 1 | 49 | 61 | 468 |
| 14 Jul-21 Jul 2006 | 9 | -- | 341 | 293 | 523 |
| 21 Jul-28 Jul 2006 | 12 | -- | 190 | 144 | -- |
| 28 Jul-04 Aug 2006 | -- | 2 | 162 | 166 | 120 |
| 04 Aug-11 Aug 2006 | 5 | 1 | 100 | 165 | 230 |
| 11 Aug-18 Aug 2006 | 8 | 1 | 69 | 253 | 222 |
| 18 Aug-25 Aug 2006 | 142 | -- | 124 | 280 | 150 |
| 25 Aug-01 Sep 2006 | 30 | 12 | 61 | 588 | 351 |
| 01 Sep-08 Sep 2006 | 154 | 1 | 39 | 366 | 160 |
| 08 Sep-15 Sep 2006 | 210 | 5 | 38 | 413 | 405 |
| 15 Sep-22 Sep 2006 | 17 | 1 | 11 | 279 | 232 |
| 22 Sep-29 Sep 2006 | 1 | -- | 21 | 383 | 450 |
| 29 Sep-06 Oct 2006 | -- | 3 | 83 | 616 | 144 |
| 06 Oct-13 Oct 2006 | -- | 1 | 107 | 585 | 150 |
| 13 Oct-20 Oct 2006 | -- | 2 | 107 | 807 | -- |
| 20 Oct-27 Oct 2006 | 2 | 2 | 88 | 732 | 356 |
| 27 Oct-03 Nov 2006 | 1 | -- | 110 | 487 | 420 |
| 03 Nov-10 Nov 2006 | 1 | -- | 162 | 346 | 520 |
| 10 Nov-17 Nov 2006 | -- | 1 | 209 | 565 | 332 |
| 17 Nov-24 Nov 2006 | 1 | 1 | 124 | 452 | 845 |
| 24 Nov-01 Dec 2006 | -- | 2 | 101 | 298 | 465 |
| 01 Dec-08 Dec 2006 | -- | -- | 81 | 121 | 524 |
| 08 Dec-15 Dec 2006 | -- | -- | 9 | 100 | 574 |
| 15 Dec-22 Dec 2006 | -- | -- | 29 | 257 | -- |
| 22 Dec-29 Dec 2006 | 3 | 6 | 163 | 396 | 200 |
| 29 Dec-05 Jan 2007 | 3 | 3 | 22 | 231 | 152 |
| 05 Jan-12 Jan 2007 | -- | 2 | 24 | 348 | 159 |
| 12 Jan-19 Jan 2007 | 1 | 1 | 2 | 52 | 156 |
| 19 Jan-26 Jan 2007 | -- | 7 | 22 | 53 | 204 |
| 26 Jan-02 Feb 2007 | -- | 2 | 101 | 57 | 213 |
| 02 Feb-09 Feb 2007 | -- | 3 | 69 | 108 | 153 |
| 09 Feb-16 Feb 2007 | -- | 3 | 127 | 370 | -- |
| 16 Feb-23 Feb 2007 | -- | 2 | 219 | 353 | 271 |
| 23 Feb-02 Mar 2007 | 1 | 1 | 189 | 608 | 157 |
| 02 Mar-09 Mar 2007 | -- | -- | 141 | 594 | 150 |
| 09 Mar-16 Mar 2007 | -- | 3 | 61 | 383 | 157 |
| 16 Mar-23 Mar 2007 | 1 | 3 | 1 | 124 | 135 |
| 23 Mar-30 Mar 2007 | -- | 8 | 5 | 16 | 158 |
| 30 Mar-05 Apr 2007 | -- | 17 | 1 | 45 | 1035 |
| 06 Apr-13 Apr 2007 | -- | -- | 1 | 8 | 3114 |
| 13 Apr-20 Apr 2007 | -- | -- | 3 | 8 | 203* |
| 20 Apr-27 Apr 2007 | -- | -- | 1 | 3 | 476 |
| 27 Apr-04 May 2007 | -- | -- | -- | 9 | 223 |
| 04 May-11 May 2007 | -- | -- | -- | 4 | 125 |
| 11 May-18 May 2007 | -- | -- | -- | 2 | 143 |
| 18 May-25 May 2007 | -- | 1 | -- | 1 | 216 |
Strong activity during mid-September 2006. On 9 and 10 September, vigorous ash venting from the Gages Wall was accompanied by small explosions. Pyroclastic flows from fountain collapse occurred on all sides of the dome and reached 1 km W down Gages valley. On 11 September, the collapse of an overhanging lava lobe produced pyroclastic flows NE down the Tar River valley. One pyroclastic flow in the same area on 13 September reached the sea. On 14 September, vigorous ash venting resumed. Continuous ash and gas emissions during 13-19 September produced plumes that reached altitudes of 2.4-3.7 km. The Gages Wall vent continued to produce ash and gas emissions into mid-October.
Activity during September-December 2006. During 15 September-6 October the lava dome continued to grow at a moderate rate in the summit area and on the S and E sides of the dome. On 22 September the volume of the dome was about 80 million cubic meters. Lava-dome growth was concentrated on the NE part of the edifice from 6 October until 15 December, when growth moved to the SW part of the dome. A new E-facing shear lobe with a smooth, curved back enlarged during 13-20 October.
During 24 November-1 December, the two cracks in the curved back of the shear E-facing lobe on the summit propagated downward and divided the lobe into three blocks. The dome overtopped the NE crater wall and fresh rock and boulder deposits were observed in that region. During 22-29 December, lava-dome growth was focused on the W, where gas-and-ash venting occurred. A high whaleback lobe directed SW was observed on 26 December.
Aviation notices reported continuous ash and gas emissions almost every day from 15 September through 14 November, with plumes rising above 2 km to a maximum of 4.6 km altitude. Plumes extended 140 km W on 2-3 October. During 17-24 November, ash venting originated from the westernmost of two cracks in the curved back of the shear E-facing lobe on the summit. An explosion produced an ash plume that rose to altitudes of 1.5-1.7 km.
Pyroclastic flows occurred regularly as collapses from the dome sent material in all directions. Pyroclastic flows reached both the upper region of Tuitts Ghaut (N) and the sea via the Tar River Valley (E) on 23 November.
Activity during January-March 2007. Rapid lava-dome growth, pyroclastic flows, and ash venting increased during 3-9 January. Dome growth was concentrated in the NW, the highest part of the dome. Pyroclastic flows were observed in Tyres Ghaut (NW), Gages Valley (W), and N, behind Gages Mountain and accompanied by ash venting. On 4 January, simultaneous pyroclastic flows descended Tyres Ghaut and Gages Valley, and a resultant ash cloud reached an altitude of 2.5 km. The maximum distance for the Gages Valley flow was 4 km. During 6-9 January, distances of pyroclastic flows increased in Tyres Ghaut and possibly exceeded 1.5 km.
During 10-16 January, lava-dome growth was focused on the NW quadrant. During 10-11 January, one pyroclastic flow was observed to the W in Gages Valley and one to the NW in Tyres Ghaut. On 15 January, a relatively large pyroclastic flow traveled E down the Tar River Valley. After 15 January, measurable activity was low. Gas and ash venting that originated from the W side of the dome continued. A clear view on 22 January revealed that the collapse scar from the 8 January event was filled in. A small spine was noted on the W side. On 23 January, a large pyroclastic flow traveled down Gages Valley. The Washington VAAC reported that ash plumes were visible during 26-27 January. On 28 January, a large pyroclastic flow traveled down the Tar River Valley and reached the sea. A diffuse plume rose to an altitude of 1.5 km on 31 January.
During 7-13 February, growth of the lava dome continued on the W side, then was concentrated on the E and N sides for the rest of the month. The lava-dome volume in mid-February was estimated at 200 million cubic meters based on LIDAR data. Previous measurements over-estimated the lava-dome volume due to the perceived location of the dome and the lack of data from inside the crater. Small pyroclastic traveled in multiple directions throughout February. Moderate pyroclastic flows traveled down the Tar River Valley during 24-25 and 27 February. Continuous ash emissions were reported during 14 February-6 March, with plumes to altitudes of 2.1-6.1 km.
Lava-dome growth during 2-9 March was concentrated on an E-facing lobe topped with blocky, spine-like protrusions. Rockfalls affected the E and NE flanks. Pyroclastic flows traveled 2 km in the Tar River Valley. Heightened pyroclastic activity on 7 March resulted in an ash plume that rose to an estimated 2.4 km. On 11 March, a pyroclastic flow traveled down the NE flank into White's Ghaut.
During 9-26 March, lava-dome growth was concentrated on the NE side. Intermittent pyroclastic flows traveled E down the Tar River valley and produced ash plumes. One plume on 12 March rose to 3 km altitude. Pyroclastic flows were observed NW in Tyre's Ghaut and ashfall was reported from the Salem /Old Towne areas. During 23 March-3 April, dome growth apparently stopped.
MODIS thermal data indicated hot pixels at the dome and from pyroclastic flows on 24 March. Another thermal anomaly from a pyroclastic flow Tar River was detected on 29 March. No futher anomalies had been recorded by the HIGP Hotspot system through May. However, the Washington VAAC reported that a SW-drifting, diffuse plume and a hotspot were visible on satellite imagery on 2 April.
During 30 March-13 April, small, intermittent pyroclastic flows from the E-facing shear lobe occurred in the Tar River valley (figure 76). Incandescent rockfalls were seen at night during 5-9 April. On 17 April, a small pyroclastic flow was observed to the NW in the upper part of Tyres Ghaut. In mid-April MVO estimated that the lava-dome volume was about 208 million cubic meters.
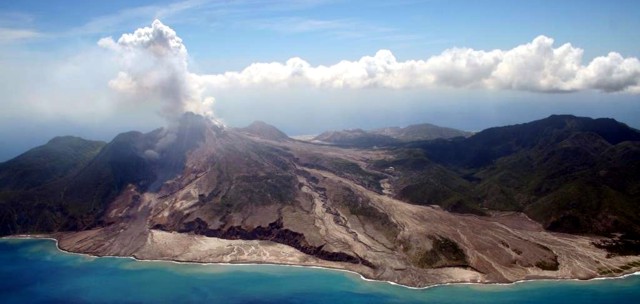 |
Figure 76. Photograph taken 4 April 2007 of southern Montserrat and Soufrière Hills from the NE, showing from left the Tar River Delta and the debris fans spilling from Tuitts and Whites Ghauts. Courtesy MVO. |
The sulfur dioxide (SO2) flux rate during 6-13 April was high, with an average value of 3,114 metric tons per day (t/d), well above the long-term average for the eruption. The previous week averaged 1,035 t/d, from a low of 71 to a high of 3,818 t/d. The three days from 8 to 10 April showed markedly elevated emissions: 3,550, 7,396 peaking at 7,471 t/d, whereas the remaining days' emissions were extremely low, some below 100 t/d.
During 13-20 April, material originating from the lava dome's E-facing shear lobe was shed down the Tar River Valley. A bluish haze containing sulfur dioxide was observed flowing down the N flanks on 18-20 April. Pyroclastic activity was ongoing on the E and NE sides of the dome during 27 April-4 May. After 4 May the overall structure of the dome changed very little. Low-level rockfall and pyroclastic-flow activity continued into late May.
Reference. Wadge, G., Macfarlane, D.G., Robertson, D.A., Hale, A.J., Pinkerton, H., Burrell, R.V., Norton, G.E., and James, M.R., 2005, AVTIS: a novel millimetre-wave ground based instrument for volcano remote sensing: J. Volcanology and Geothermal Research, v. 146, no. 4, p. 307-318.
Geological Summary. The complex, dominantly andesitic Soufrière Hills volcano occupies the southern half of the island of Montserrat. The summit area consists primarily of a series of lava domes emplaced along an ESE-trending zone. The volcano is flanked by Pleistocene complexes to the north and south. English's Crater, a 1-km-wide crater breached widely to the east by edifice collapse, was formed about 2000 years ago as a result of the youngest of several collapse events producing submarine debris-avalanche deposits. Block-and-ash flow and surge deposits associated with dome growth predominate in flank deposits, including those from an eruption that likely preceded the 1632 CE settlement of the island, allowing cultivation on recently devegetated land to near the summit. Non-eruptive seismic swarms occurred at 30-year intervals in the 20th century, but no historical eruptions were recorded until 1995. Long-term small-to-moderate ash eruptions beginning in that year were later accompanied by lava-dome growth and pyroclastic flows that forced evacuation of the southern half of the island and ultimately destroyed the capital city of Plymouth, causing major social and economic disruption.
Information Contacts: Montserrat Volcano Observatory (MVO), Fleming, Montserrat, West Indies (URL: http://www.mvo.ms/); Washington Volcanic Ash Advisory Center (VAAC), Satellite Analysis Branch (SAB), NOAA/NESDIS E/SP23, NOAA Science Center Room 401, 5200 Auth Road, Camp Springs, MD 20746, USA (URL: http://www.ospo.noaa.gov/Products/atmosphere/vaac/); Hawai'i Institute of Geophysics and Planetology, MODIS Thermal Alert System, School of Ocean and Earth Sciences and Technology (SOEST), University of Hawai'i, 2525 Correa Road, Honolulu, HI, USA (URL: http://modis.higp.hawaii.edu/).