Report on Ijen (Indonesia) — September 2007
Bulletin of the Global Volcanism Network, vol. 32, no. 9 (September 2007)
Managing Editor: Richard Wunderman.
Ijen (Indonesia) 2007 field visit found degassing and increasing fumarole temperatures
Please cite this report as:
Global Volcanism Program, 2007. Report on Ijen (Indonesia) (Wunderman, R., ed.). Bulletin of the Global Volcanism Network, 32:9. Smithsonian Institution. https://doi.org/10.5479/si.GVP.BGVN200709-263350
Ijen
Indonesia
8.058°S, 114.242°E; summit elev. 2769 m
All times are local (unless otherwise noted)
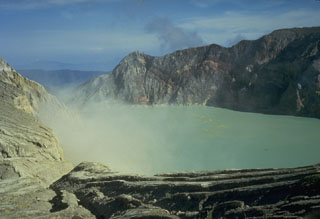
Researchers from Simon Fraser University, McGill University, and the Institut Teknologi Bandung (ITB) conducted fieldwork at Ijen from 6 July to 2 August 2007. During this period, volcanic activity was restricted to persistent degassing of the solfatara (sulfurous fumarole) located on a small dome in the SE part of the crater (figure 7). However, local sulfur miners reported a decrease in the amount of mineable sulfur, a change presumably linked to increasing exit temperatures of the fumarole gases. Visual observation revealed no change in the crater lake level or fumarole activity compared to observations (BGVN 32:02) at roughly the same time last year (dry season).
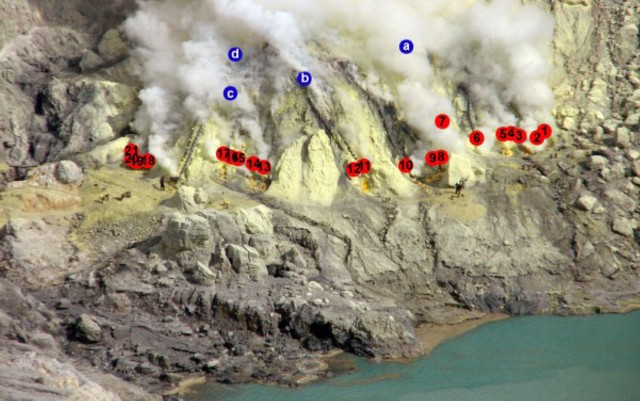 |
Figure 7. Overview of the N flank of the dome-like fumarole field (solfatara) as viewed from the crater rim of Ijen. Miners have installed pipes leading down from the dome. The pipes are used to condense sulphur, which is subsequently mined. Temperatures were measured in the pipes (numbered 1-21) and in fumaroles (lettered a-d) (see table 8). Fumarole temperatures were measured near the top of the dome. For scale, note sulphur miners near pipes 18 and 8/9. Courtesy of V. van Hinsberg. |
During the visit, exit temperatures measured at the pipes ranged from 115 to 270°C (table 8), similar to those measured in 2006. Fumaroles on top of the dome had substantially higher temperatures, ranging up to 600°C, with the hottest emitting orange flames. By comparison, fumarole temperatures reported for the top of the dome in 1999, the last year for which there are published data (BGVN 24:09), were less than 250°C.
Table 8. Temperature (°C) of gases measured at ~ 50 cm depth in pipes and fumaroles using a K-type thermocouple. Courtesy of Glyn Williams-Jones.
| Location | Temperature |
| Pipe 1 | -- |
| Pipe 2 | 235°C |
| Pipe 3 | -- |
| Pipe 4 | 255°C |
| Pipe 5 | 215°C |
| Pipe 6 | 210°C |
| Pipe 7 | 267°C |
| Pipe 8 | 216°C |
| Pipe 9 | 230°C |
| Pipe 10 | 210°C |
| Pipe 11 | 175°C |
| Pipe 12 | 116°C |
| Pipe 13 | 168°C |
| Pipe 14 | 199°C |
| Pipe 15 | 205°C |
| Pipe 16 | 155°C |
| Pipe 17 | 194°C |
| Pipe 18 | 178°C |
| Pipe 19 | -- |
| Pipe 20 | 187°C |
| Pipe 21 | 194°C |
| Fumarole A | >495°C |
| Fumarole B | 331°C |
| Fumarole C | 335°C |
| Fumarole D | 601°C |
Fumarolic sampling techniques included condensate bottles, and sublimates collected in silica tubes. In addition, they also used a Giggenbach bottle, a technique in which the escaping gases are bubbled through a caustic solution of NaOH in an evacuated flask. Reactions, such as those between the caustic solution and CO2 in the sampled gas, both remove some species from the gas and result in residual gases collected at the top of the flask. The samples obtained with the various techniques are typically studied and analyzed later in the lab.
Distinct variations in fumarole temperature observed during the course of the field campaign linked closely to weather conditions. On clear, wind-free days, fumarole temperatures were highest. The escaping fumes were generally white in color, and miners were forced to pour water on the pipes to induce sulfur condensation. On windy, clouded days, fumes were much denser and yellow in color, covering all surfaces in a veneer of sulfur. At Fumarole d, this change in weather conditions from clear and wind free to windy and cloudy corresponded to a drop in fumarole temperature from 600 to 450°C. The changes in fumarole conditions were observed to occur rapidly (i.e., within 15 minutes of a cold front moving in), suggesting to the researchers the likelihood of extensive interaction between magmatic and atmospheric gases immediately below the dome's surface.
Crater lake and Banyu Pahit river. The temperature of the crater lake was monitored daily on the S shore below the dome from 8 to 21 July 2007; it varied between 36.1 and 37.4°C. These variations also corresponded to changes in the weather. A transect along the Banyu Pahit river (see map, below) from the dam to the bridge at Watu Capil, revealed that the water was a few degrees above ambient where it emerged, but was close to the air temperature from 500 m downstream. A strong, persistent increase in discharge was observed on 21 July 2007, returning flow to the levels of 1999.
Elemental fluxes. A survey of sulfur dioxide (SO2) fluxes was made using a portable UV spectrometer (FLYSPEC) on 11, 12, and 27 July 2007 along the SE rim of the crater (~ 2,350 m elevation) and involved, respectively, eight, sixteen, and seven walking traverses under the plume with the instrument pointed upwards.
The gas plume produced directly from the active solfatara (~ 2,150 m elevation) rose buoyantly before flowing over the crater rim. On 11 July, the maximum concentration path length of the gas in the plume fluctuated between 1,800 and 2,600 ppm-m over the eight scans made during a period of 3.5 hours. The wind speed (measured with a handheld anemometer at plume height) during this time averaged 2.9 m/s and the resultant SO2 flux was therefore calculated to average 219 metric tons per day (t/d), with a standard deviation of 99 t/d. On 12 July, the average gas concentration was similar, ranging between 1,600 and 3,000 ppm-m. The average wind speed during this survey period (3 hours) fluctuated between 2.0 and 4.5 m/s and the resultant SO2 flux averaged 185 t/d, with a standard deviation of 60 t/d.
On 27 July average gas concentrations were considerably higher, ranging from 2,200 to 13,000 ppm-m over two hours. The higher concentrations were a result of the plume being less dispersed. The average wind speed during this period ranged from 2.6 to 4 m/s and the resultant SO2 flux averaged 215 t/d, with a standard deviation of 68 t/d. Based on this very limited three-day survey, the average daily flux of SO2 was estimated to be 206 t/d and was lower than that measured during a two day survey last year by ~ 130 t/d (BGVN 32:02).
The amount of native sulfur precipitating at the solfatara can be roughly estimated from that mined, given that the bulk of this sulfur is recovered. Approximately 100 miners extract sulfur, removing it from the crater in two trips each day, and carrying on average 60-80 kg of sulfur per trip. This corresponds to the deposition of 14 t/d.
Fumarole gas samples collected using Giggenbach flasks complemented the FLYSPEC measurements and determine the flux of elements other than SO2, CO2, and H2O. Rock samples and water samples taken from the lake and acid springs will allow further quantification of the output of volatiles and metals.
Self-potential surveys. These are surveys that involve measurement at the ground surface of the local, static, direct-current potentials between electrodes inserted to shallow depth at known separation distances. The method is sometimes also called spontaneous potential and abbreviated as SP. These potentials develop from numerous sources, including fluid flow, diffusion, and oxidation and reduction reactions between minerals in contact with water.
As in 2006 (BGVN 32:02), SP surveys were conducted on the summit rim and also down the S flank to the intersection of the Banyupuhit river (dashed line, figure 8) and the main road. The survey was complemented by ground temperature measurements, which found the only thermal anomaly was located in the immediate vicinity of the dome. In comparison to 2006, only the N rim of the crater showed a significant SP variation, with a decrease of SP of ~ 100mV. This variation may indicate a slight decrease of the hydrothermal activity. While the SP values are minima, the SP/elevation gradient is still slightly positive (+0.03 mV/m) suggesting that the hydrothermal system on the N rim is strong enough to compensate for the influence of the hydrological zone, characterized on the E and NE by negative SP (with a minimum at -120 mV) and an inverse SP/elevation gradient of -1.07 mV/m. This almost certainly represents the inflow of meteoric water and groundwater.
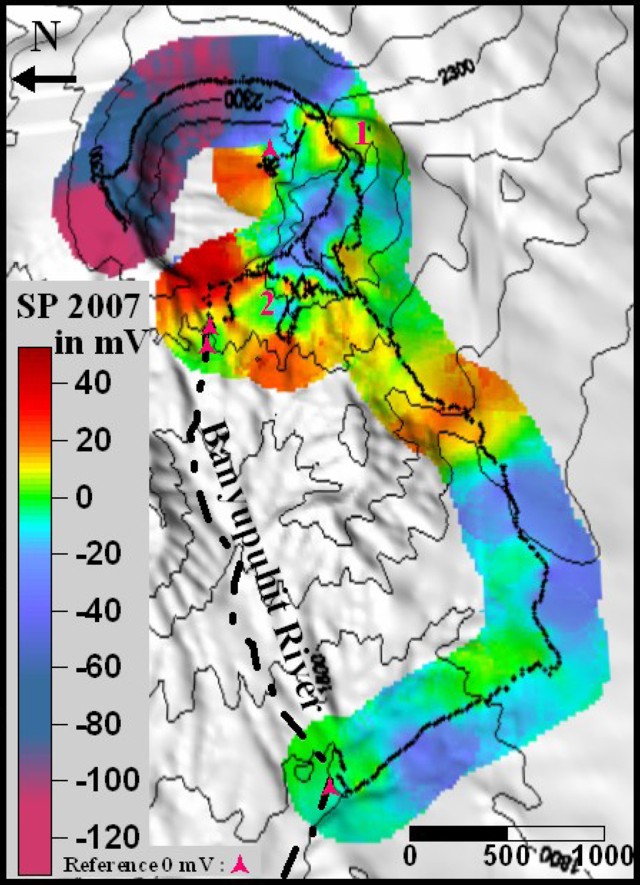 |
Figure 8. Self-potential (SP) survey results overlain on a digital elevation model (DEM) of the active crater of Kawah Ijen. All the SP data were referenced to the upper Banyupuhit river and to a spring on the inner E slope of the crater (triangles). Contour intervals are 100 m. Courtesy of G. Mauri and V. van Hinsberg. |
The 2006 SP survey suggested that the S and W flanks of the crater were characterized by a hydrothermal system; however, this year's SP and temperature study shows greater complexity. The main SP/elevation gradient is between -0.31 and -0.56 mV/m with a higher SP average than on the E rim (-4 mV in the S versus -70 mV in the E). This suggests that the S part of the crater is controlled mainly by the hydrological and underlying hydrothermal systems of the acid lake. Although some other small hydrothermal anomalies were found along the S and SW slopes (1 and 2 on figure 8), the area was principally characterized by hydrological systems.
Thus, while the presence of strong hydrothermal activity within the crater is unequivocal, the temperature and self-potential surveys to date show no evidence of it extending beyond the crater rim.
Geological Summary. The Ijen volcano complex at the eastern end of Java consists of a group of small stratovolcanoes constructed within the 20-km-wide Ijen (Kendeng) caldera. The north caldera wall forms a prominent arcuate ridge, but elsewhere the rim was buried by post-caldera volcanoes, including Gunung Merapi, which forms the high point of the complex. Immediately west of the Gunung Merapi stratovolcano is the historically active Kawah Ijen crater, which contains a nearly 1-km-wide, turquoise-colored, acid lake. Kawah Ijen is the site of a labor-intensive mining operation in which baskets of sulfur are hand-carried from the crater floor. Many other post-caldera cones and craters are located within the caldera or along its rim. The largest concentration of cones forms an E-W zone across the southern side of the caldera. Coffee plantations cover much of the caldera floor; nearby waterfalls and hot springs are tourist destinations.
Information Contacts: Nathalie Vigouroux, Guillaume Mauri, and Glyn Williams-Jones, Department of Earth Sciences, Simon Fraser University, Burnaby, BC V5A 1S6, Canada (URL: http://www.sfu.ca/earth-sciences.html); Vincent van Hinsberg and Willy (A.E.) Williams-Jones, Department of Earth and Planetary Sciences, McGill University, Montreal, Quebec, Canada (URL: http://www.mcgill.ca/eps/); Asnawir Nasution, Department of Geology, Institut Teknologi Bandung, Bandung, Indonesia (URL: http://www.itb.ac.id).