Report on Cerro Azul (Ecuador) — May 2008
Bulletin of the Global Volcanism Network, vol. 33, no. 5 (May 2008)
Managing Editor: Richard Wunderman.
Cerro Azul (Ecuador) Eruption (29 May-11 June 2008) of lava in caldera and from fissures on SE side
Please cite this report as:
Global Volcanism Program, 2008. Report on Cerro Azul (Ecuador) (Wunderman, R., ed.). Bulletin of the Global Volcanism Network, 33:5. Smithsonian Institution. https://doi.org/10.5479/si.GVP.BGVN200805-353060
Cerro Azul
Ecuador
0.92°S, 91.408°W; summit elev. 1640 m
All times are local (unless otherwise noted)
Equador's Instituto Geofísico (IG) reported that Cerro Azul began to erupt late on the night of 29 May 2008. The report was based on satellite data, network seismic data, and eye-witness reports. In repose for 10 years (BGVN 23:08), this shield volcano forms the extreme SW end of the elongate island (figure 2). Cerro Azul contains a 4 x 5 km summit crater. The eruption from the SE flank (figure 3) prevailed during 29 May to 11 June and with few exceptions emitted lava flows with `a`a textured surfaces. The flows reached 2-3 km wide and up to 10 km long. Some lava also emerged from a vent in the NE wall of the caldera. Eruptions appeared to have ceased during 2 June, breaking the time line into two eruptive phases.
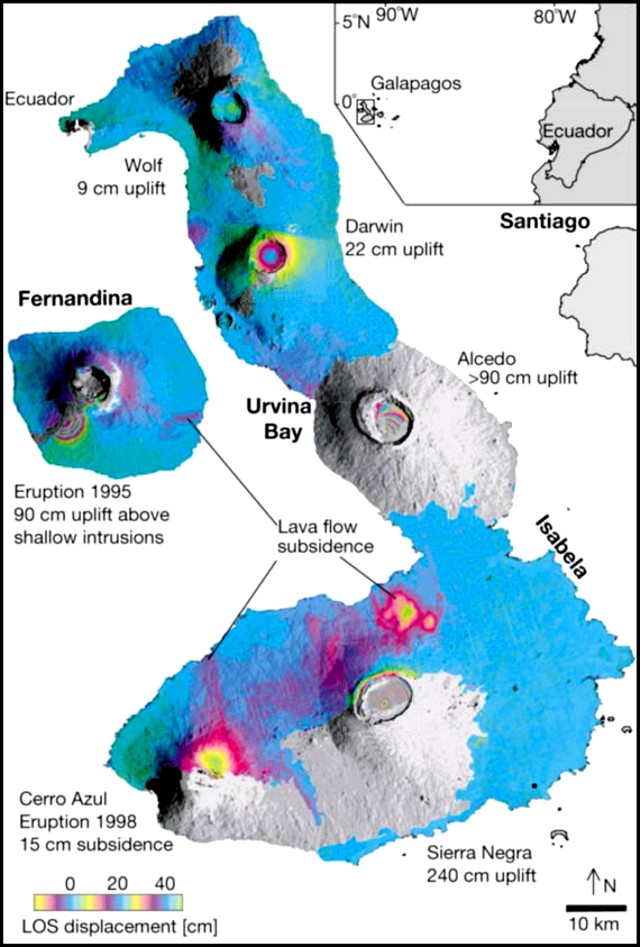 |
Figure 2. Satellite radar interferometry (InSAR) maps showing line-of-sight (LOS) ground displacements in centimeters for Fernandina and Isabela islands. For Cerro Azul (and the volcanoes Darwin, Alcedo, and Sierra Negra) the InSAR data covered 6.4 years, 1992-1998. To produce the interferograms, the phase difference between radar echoes from two satellite passes is calculated. Index map shows the Galapágos islands (~ 1,000 km W of mainland Ecuador). Maps are from Amelung and others (2000). |
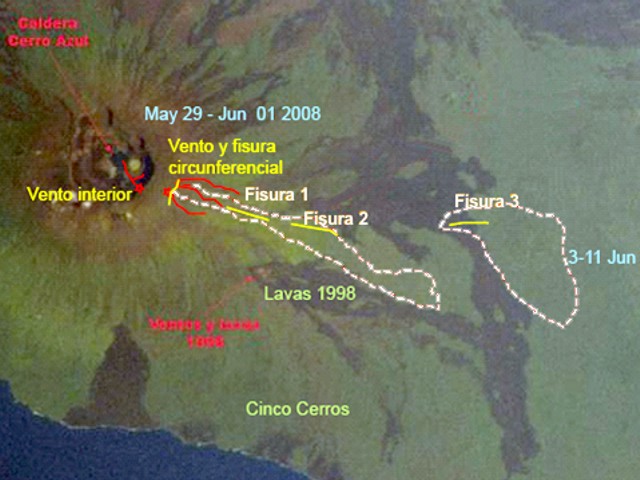 |
Figure 3. Annotated satellite image of Cerro Azul showing first-order estimates of fissure vents, the approximate margins of frequently complex flow fields, as well as eruption dates. The base image is from before the 2008 eruption. The 2008 flows generally followed similar routes as those during the SE-flank eruptions of 1978 and 1998. N is towards the top right; for scale, the distance from the crater rim to the sea directly W is ~ 8 km. Background image, Image Science and Analysis Laboratory, NASA-Johnson Space Center. Annotations and fieldwork by Andrés Gorki Ruiz, Patricio Ramón, and Nathalie Vigoroux. |
The first eruptive phase involved a rapid emission of lava during 29 May-1 June. Outside the caldera, the eruptive fissures were oriented in directions either tangential (circumferential) or radial to the volcano's symmetry. During this first phase, on 30 May, lava also extruded inside the summit caldera (figure 3).
The second eruptive phase emitted lavas over nine days (3-11 June). The lavas escaped from a separate fissure at a lower elevation than the first and oriented radially ("fissura 3" on figure 3). The flatter terrain near fissure 3 led to lavas forming an equant flow field. This contrasted with the first-phase lavas, which erupted on higher, steeper ground where they developed elongate distribution patterns.
A seismic station in the Galapagos (PAYG) suggested that activity began at 2143 hours on 29 May (local time). Signal amplitude emerged slowly at first (figure 4). Starting about an hour after that and for the next 7 hours the station registered 40 earthquakes near Cerro Azul.
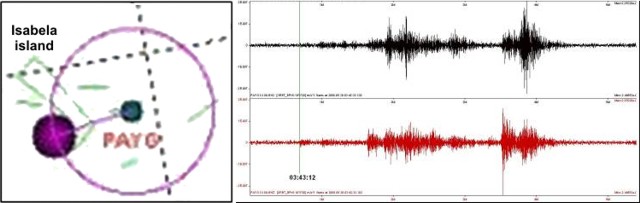 |
Figure 4. Seismic data portraying Cerro Azul's earthquakes and eruption. The left panel shows a map of the islands and station PAYG to the E, where the large dot (left) represents an epicenter near the caldera. The right panel shows the seismic traces associated with the initial signals associated with the eruption (upper is orthogonal horizontal and the lower, vertical). The vertical line at left represents 03:43:12 local time on 30 May. Courtesy of IG. |
The largest, M ~ 3.7, took place at 0051 on 30 May (local time), centered in the N caldera at shallow depth. Satellite thermal anomalies measured by MODIS/ MODVOLC showed a hot spot on the S flank at 2300 (local time). At the same time a red glow was observed in the direction of the volcano from Puerto Villamil, the capitol of Isabela Island ~ 50 km E.
According to IG, a satellite image from a Volcanic Ash Advisory Center (VAAC) showed an emission column at 0715 on 30 May 2008, probably with a low ash content, extending 140 km NW from the volcano. On the morning of 31 May, a white plume ~ 2 km high, with no visible ash, could be seen rising above the cloud cover from a point on the coast SE of the eruption site. Cloud cover then prevented further observation of the plume.
Vent areas. Aerial images taken by scientists of the Galápagos National Park on 30 May 2008 between 1400 and 1600 revealed an absence of radial fissures at that time. Lava from the higher elevation circumferential vents covered the area located at ~ 1 km elevation. Fissures 1 and 2 were therefore thought to have formed sometime between the afternoon of 30 May and morning of 1 June.
IG reports indicated that in late May into early June field visits were made by Gorki Ruiz, Oscar Carvajal, Freddy Mosquera, and Nathalie Vigouroux (and possibly others). According to Dennis Geist, they encountered sometimes foggy conditions. They inspected the area of initial eruption from Cinco Cerros, and made some key observations (figure 3) and photographs (figures 5 and 6).
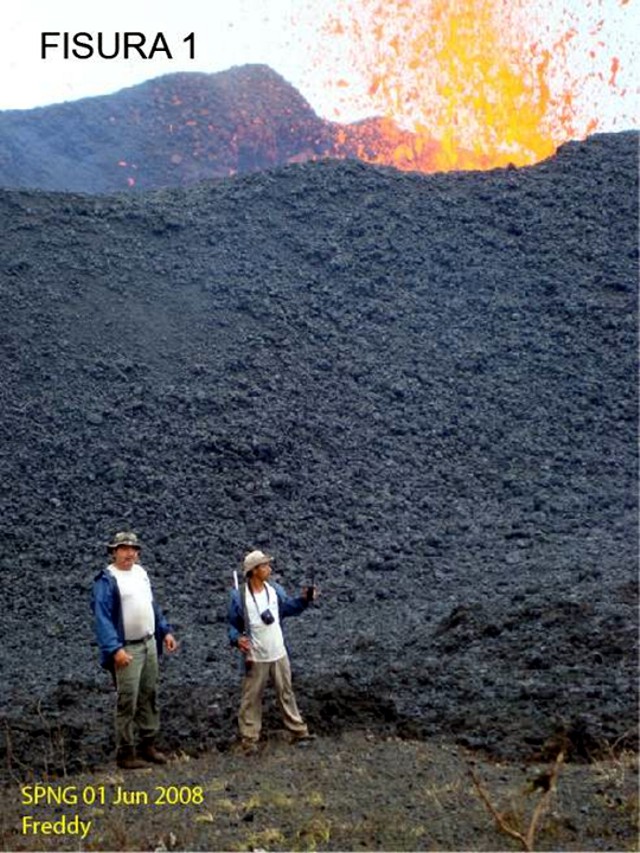 |
Figure 5. Lava spewing from part of the uppermost fissure of Cerro Azul on 1 June 2008. Photo by IG. |
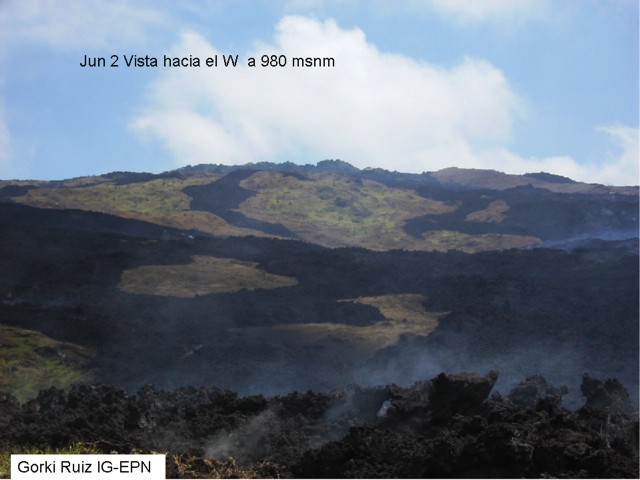 |
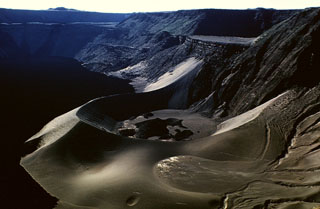
Figure 6. A view at Cerro Azul on 2 June 2008 looking W from 980 m elevation, showing the complexity of some of the flow fields in the vicinity. The foreground captures the rough-textured `a`a surface. Courtesy of Ruiz, IG. |
Fissure 1 emitted multiple lava flows; some of these reached 15 m thick. Fissure 2 lay farther out on the SE flank in an area of lower slope.
The circumferential fissure emitted six separate lava flows, some up to 5 m thick. These descended rapidly down the SE flank. Scientists were able to visit the new lava flows at an elevation of ~ 1,100 m on 2 June 2008. One of the lava flows was thin (under 1 m) with variable plagioclase and minor amounts of olivine (or pyroxene) crystals. At ~ 1,000-m elevation the flows from the circumferential fissure were overlain by tephra and lava from the upper radial fissure (fissure 1). At this location, the slope of the terrain lessened and the morphology changed to more blocky `a`a. There, the flows piled up behind the flow front.
The size of the cones built up by lava fountaining on the upper radial fissure decreased with distance from the summit. The lowest cone, at ~ 800 m elevation, was under 5 m high and emitted a small pahoehoe flow that extended a few ten's of meters downslope, but with little to no tephra.
The onset of the second eruptive phase was reported in various ways. MODVOLC alerts and related thermal images showed new hot spots at the SE end of the volcano on 3 June. They later increased in intensity and migrated E. On the night of 4 June, observers at Cinco Cerros saw a red glow. Observers on a 4 June flight spotted fissure 3. As shown below, on 5 June a huge increase in MODIS thermal anomalies occurred.
When seen on 4 and 5 June, fissure 3 emitted a lava curtain hundreds of meters long. Aerial observations suggested the height of lava fountaining was ~ 60 m with large blocks also thrown that high. The venting fed a SE-directed lava flow. Owing to the relatively flat terrain found in the saddle between Cerro Azul and Sierra Negra volcanoes, the lava flow appeared to be progressing very slowly. Part of the new flow spread over portions of the 1998 flow. A plume ~ 50 km long moving N was visible from the airplane, as well as in satellite images.
Sulfur-dioxide fluxes. Simon Carn provided satellite information on sulfur dioxide (SO2) burdens measured from the Ozone Monitoring Instrument (OMI) on NASA's Aura satellite (figures 7 and 8). The SO2 fluxes were measured once per day from 29 May to 8 June 2008. The map shown is for 31 May (UTC), the day with highest flux, ~ 35,000 tons/day. In general, the plumes blew SW from the source. The histogram (figure 7) indicates the daily SO2 fluxes emitted during this eruption period, with the highest flux on 31 May. Low fluxes occurred during 2-4 June, corresponding with the eruptive lull of 2 June.
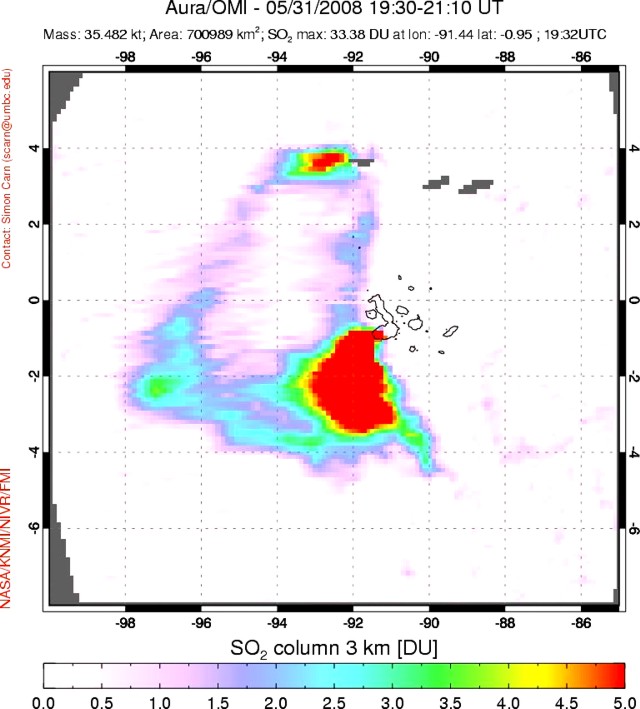 |
Figure 7. One of several available maps of sulfur dioxide (SO2) plumes measured from Aura/OMI satellite images. Data acquisition for this map occurred during 1930-2110 on 31 May UTC. Gray areas indicate regions where meteorological clouds may be obscuring the satellite view of the lower atmosphere. Courtesy of Simon Carn. |
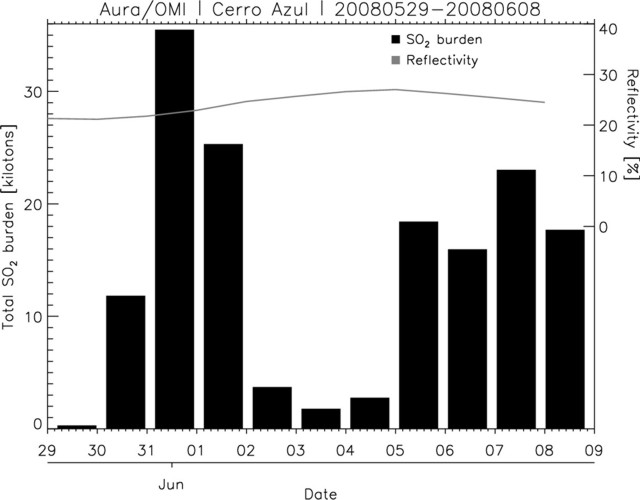 |
Figure 8. Histogram showing daily sulfur dioxide (SO2) burdens measured by the Ozone Monitoring Instrument (OMI) on NASA's Aura satellite between 29 May and 8 June 2008 UTC. These burdens were calculated based on an assumed SO2 altitude of 3 km and should be considered preliminary estimates. Courtesy of Simon Carn. |
Satellite thermal anomalies. The most recent previous eruption of the volcano took place in September 1998 (BGVN 23:08 and 23:09). In accord with the 10-year quiet period, thermal anomalies at Cerro Azul were absent at least as far back as 1 January 2000 and onward through 29 May 2008. The current eruption's anomalies appeared during 30 May-17 June 2008 (table 1) and were distributed broadly around lavas associated with fissure 3. There was a 90-pixel anomaly at 0420 on 5 June 2008; later that day there were only 5 pixels.
Table 1. MODVOLC thermal anomalies measured by MODIS instruments at Cerro Azul from 30 May through 17 June 2008. All anomalies were located E of the crater, with the farthest seen ~ 28 km due E. Courtesy of the Hawai'i Institute of Geophysics and Planetology (HIGP) Thermal Alerts System.
| Date (UTC) | Time (UTC) | Number of pixels | Satellite |
| 30 May 2008 | 0500 | 6 | Terra |
| 30 May 2008 | 0755 | 12 | Aqua |
| 31 May 2008 | 0405 | 14 | Terra |
| 31 May 2008 | 0700 | 4 | Aqua |
| 31 May 2008 | 1625 | 5 | Terra |
| 01 Jun 2008 | 0445 | 9 | Terra |
| 01 Jun 2008 | 0745 | 14 | Aqua |
| 03 Jun 2008 | 0435 | 7 | Terra |
| 04 Jun 2008 | 0815 | 25 | Aqua |
| 04 Jun 2008 | 1600 | 8 | Terra |
| 05 Jun 2008 | 0420 | 90 | Terra |
| 05 Jun 2008 | 0720 | 41 | Aqua |
| 05 Jun 2008 | 1645 | 14 | Terra |
| 05 Jun 2008 | 1940 | 5 | Aqua |
| 06 Jun 2008 | 0505 | 1 | Terra |
| 07 Jun 2008 | 0410 | 3 | Terra |
| 09 Jun 2008 | 0355 | 2 | Terra |
| 09 Jun 2008 | 1620 | 2 | Terra |
| 10 Jun 2008 | 0440 | 17 | Terra |
| 10 Jun 2008 | 0735 | 5 | Aqua |
| 10 Jun 2008 | 1700 | 2 | Terra |
| 12 Jun 2008 | 0430 | 3 | Terra |
| 12 Jun 2008 | 0725 | 4 | Aqua |
| 14 Jun 2008 | 0415 | 1 | Terra |
| 14 Jun 2008 | 1935 | 1 | Aqua |
| 16 Jun 2008 | 0405 | 1 | Terra |
| 17 Jun 2008 | 0445 | 1 | Terra |
| 17 Jun 2008 | 0745 | 5 | Aqua |
Environmental concerns and a bathymetric map. According to Galapagos National Park officials on 3 June 2008 (as reported by Agence France-Presse, AFP) the lava did not affect the islands' famed giant tortoises. Isabela, the largest island in the archipelago, is home to rare and unique flora and fauna, including the Galapagos giant tortoise, which can reach more than 230 kg in mass and live more than 100 years. The Galapagos archipelago, which consists of about 30 islands, islets, and standing rocks, is a UNESCO World Heritage Site. In 2007, UNESCO declared the archipelago's environment in danger due to the increase of tourism and the introduction of invasive species. The archipelago has a population of ~ 40,000.
William Chadwick has merged all available datasets (as of 1994) for bathymetry in the Galápagos region. Cerro Azul sits adjacent a steep drop-off to the W, with water adjacent the shore reaching ~ 3.5 km depth. In contrast, much of the island cluster is on a broad shallow platform. Chadwick offers this compiled map on his website (see Information Contacts).
Reference. Amelung, F., Jónsson1, S., Zebker, H., and Segall, P., 2007, Widespread uplift and 'trapdoor' faulting on Galápagos volcanoes observed with radar interferometry: Nature, v. 407, p. 993-996 (26 October 2000).
Geological Summary. Located at the SW tip of the J-shaped Isabela Island, Cerro Azul contains a steep-walled 4 x 5 km nested summit caldera complex that is one of the smallest diameter, but at 650 m one of the deepest in the Galápagos Islands. The shield volcano is the second highest of the archipelago. A conspicuous bench occupies the SW and west sides of the caldera, which formed during several episodes of collapse. Youthful lava flows cover much of the caldera floor, which has also contained ephemeral lakes. A prominent tuff cone located at the ENE side of the caldera is evidence of episodic hydrovolcanism. Numerous spatter cones dot the western flanks. Fresh-looking lava flows, many erupted from circumferential fissures, descend the NE and NW flanks. Historical eruptions date back only to 1932, but Cerro Azul has been one of the most active Galápagos volcanoes since that time. Solfataric activity continues within the caldera.
Information Contacts: Andres "Gorki" Ruiz, Freddy Mosquera, and Patricio Ramón, Instituto Geofísico, Escuela Politécnica Nacional(IG), AP 17-01-2759, Quito, Ecuador (URL: http://www.igepn.edu.ec/); Nathalie Vigouroux, Department of Earth Sciences, Simon Fraser University, Burnaby, Canada; Oscar Carvajal, The Galápagos National Park Service, Isla Santa Cruz, Galápagos, Ecuador; Dennis Geist and Gorki Ruiz, Geological Sciences, Box 3022, University of Idaho, Moscow ID 83844; Simon Carn, Joint Center for Earth Systems Technology, University of Maryland Baltimore Campus (UMBC), 1000 Hilltop Circle, Baltimore, MD 21250 (URL: http://so2.umbc.edu/); Hawai'i Institute of Geophysics and Planetology (HIGP) Thermal Alerts System, School of Ocean and Earth Science and Technology (SOEST), School of Ocean and Earth Science and Technology (SOEST), Univ. of Hawai'i, 2525 Correa Road, Honolulu, HI 96822, USA (URL: http://modis.higp.hawaii.edu/); William Chadwick, CIMRS, Oregon State University, NOAA/PMEL VENTS Program, Hatfield Marine Science Center, 2115 S.E. OSU Dr., Newport, OR 97365 (URL for map: https://www.pmel.noaa.gov/eoi/staff/chadwick/galapagos.html).