Report on Soufriere Hills (United Kingdom) — March 2010
Bulletin of the Global Volcanism Network, vol. 35, no. 3 (March 2010)
Managing Editor: Richard Wunderman.
Soufriere Hills (United Kingdom) Lava dome growth continuing; pyroclastic flows reached the ocean
Please cite this report as:
Global Volcanism Program, 2010. Report on Soufriere Hills (United Kingdom) (Wunderman, R., ed.). Bulletin of the Global Volcanism Network, 35:3. Smithsonian Institution. https://doi.org/10.5479/si.GVP.BGVN201003-360050
Soufriere Hills
United Kingdom
16.72°N, 62.18°W; summit elev. 915 m
All times are local (unless otherwise noted)
Montserrat Volcano Observatory (MVO) reported a strong increase in dome growth at Soufrière Hills (figure 82) and energetic explosive activity, including pyroclastic flows and substantial ash clouds, during the 6 months ending early April 2010 (the end of this reporting interval). Energetic extrusions were particularly noteworthy during January and February 2010 (table 69). From mid-December 2009 through early April 2010 there was continuing seismicity and gas emissions (table 70) as well as weekly ash emissions and pyroclsatic flows (table 71). Partial dome collapse on 11 February 2010 led to a plume that rose to ~15 km altitude.
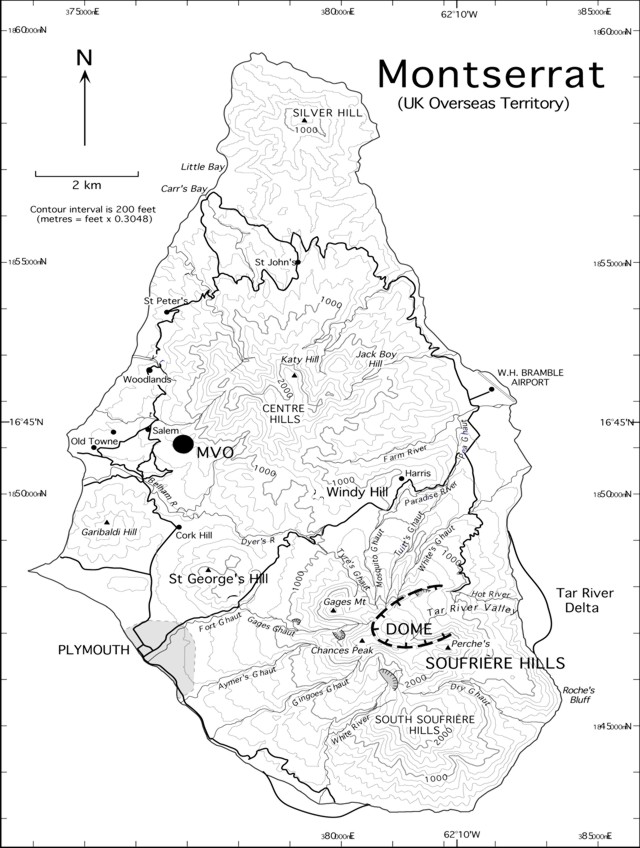 |
Figure 82. Map of Montserrat showing the pre-eruption topography of Soufrière Hills. The black circle shows the location of the MVO. The approximate outline of the Tar River delta in July 2004 is shown. Courtesy of Wadge and others (2005). |
Table 69. Key features of the five Vulcanian explosions that occurred at Soufriere Hills in January and February 2010. Units in valley columns are pyroclastic-f low runout distances in kilometers. From Cole and others (2010) with due credit to Washington Volcanic Ash Advisory Center (VAAC) for satellite and aviation-based plume altitude estimates.
| Date | Time (local) | Lapilli Fallout | Plume | White's Bottom Ghaut | Tar River Valley | Farrells Plain | Tyers Ghaut/Belham Valley | Gages | Gingoes Ghaut | White River |
| 08 Jan 2010 | 1449-1500 | No: Ash from PFs | 7.6 km (25,000 ft) | 4.7 | 2 | 2 | 5.8 | 4 | 2.6 | 1.5 |
| 10 Jan 2010 | 0128-0135 | Not known | 6.7 km (22,000 ft) | >2 | -- | 1.5 | 2.5 | 3 | -- | -- |
| 10 Jan 2010 | 2027-2031 | Yes: pumice | 5.5 km (18,000 ft) | 1.5 | 2 | -- | -- | -- | -- | -- |
| 05 Feb 2010 | 1349-1356 | Yes: non-pumiceous | 6.7 km (22,000 ft) | 1.5 | 2 | 1.5 | 2 | 4 | 1.5 | 1.5 |
| 08 Feb 2010 | 1957-2003 | Not known | 4.6 km (15,000 ft) | -- | -- | -- | -- | 3.5 | -- | -- |
Table 70. Soufrière Hills seismicity and gas measurements from weekly reports between 4 December 2009 and 19 March 2010. MVO seismicity terminology as follows: Rockfall signals (featureless, high-frequency events, which correlate to large rockfalls from the dome); Volcano-tectonic (high frequencies >5 Hz, often impulsive P-phases and usually clear S-phases); Long-period (generally phaseless events with predominant frequency ~1 Hz); Hybrid (repetitive transient events of intermediate frequency, 3-5 Hz, without discernible S-phases; initial high-frequency waveforms at some stations) (MVO, 1996). Numbers refer to the total over the period indicated. Hydrochloric acid/sulfur dioxide ratios (HCl/SO2) are derived from Fourier Transform Infrared (FTIR) gas measurements. Cycles of activity refer to rockfalls, ash venting, and pyroclastic flows. "--" indicates that data was not reported. Courtesy of MVO.
| Date | Rockfall signals | Long-period EQ's | Volcano-tectonic EQ's | Hybrid EQ's | Observations |
| 04 Dec-11 Dec 2009 | 957 | 207 | 3 | 6 | Activity (pyroclastic flow, ash venting, rock falls, etc.) continued in cycles more irregular in time in the last few days; 10 Dec-hazard level raised from 3 to 4. |
| 11 Dec-18 Dec 2009 | 977 | 134 | 3 | 58 | Cycles of activity continue, varying between 5 and 6 hours; intensity of cycles decreased slightly through the week, however an increase in intensity occurred after about 1600 on 17 Dec. |
| 18 Dec-24 Dec 2009 | 594 | 154 | 3 | 25 | Cycles of activity with periods between 6 and 7 hours; heavy ashfall NW Montserrat. |
| 24 Dec-31 Dec 2009 | 270 | 52 | -- | 6 | Cycles of activity with periods between 6 and 8 hours. |
| 31 Dec-08 Jan 2010 | 135 | 73 | 1 | 16 | Cycles of activity with periods between 8 and 10 hours; ashfall in Old Towns, Salem, Olveston, Woodlands. |
| 08 Jan-15 Jan 2010 | 68 | 25 | 2 | 10 | Three explosions occurred during the week (1449 on 8 Jan, and 0128 and 2027 on 10 Jan), each accompanied by seismic signals that lasted 11, 7, and 4 minutes, respectively; ash plumes reached altitudes of 7.6, 6.7, and 5.5 km, respectively. |
| 15 Jan-22 Jan 2010 | 196 | 38 | -- | 18 | Cycles of activity with 6-8-hour periods; several houses buried and set on fire in Kinsale; ash clouds associated with pyroclastic flows reached 3-km altitude. Hybrid swarm of seven larger quakes on 20 Jan. |
| 22 Jan-29 Jan 2010 | 565 | 113 | 2 | 18 | Cycles of activity with periods between 5 and 7 hours; 25 Jan-heavy rain caused vigorous steaming of hot pyroclastic flows. |
| 29 Jan-05 Feb 2010 | 552 | 87 | 6 | 64 | Cycles of activity with periods between 7 and 12 hours. On 5 Feb a 30-m-high pyramidal-shaped extrusion was first seen; although it temporarily put the summit elevation at 1,170 m, it was destroyed by an explosion at 1349 that day; resulting pyroclastic surges moved NW across the sea near Plymouth. |
| 05 Feb-12 Feb 2010 | 512 | 141 | 4 | 82 | Two explosions on 5 and 8 Feb; 11 Feb-partial dome collapse, plume rose to altitude of ~15.2 km. |
| 12 Feb-19 Feb 2010 | 53 | 34 | 1 | 4 | 17 Feb data consistent with quite slow extrusion of lava; MVO not yet able to make observations into the deep crater at the dome summit. HCl/SO2 = 0.76 (17 Feb). |
| 19 Feb-26 Feb 2010 | 11 | -- | -- | 6 | 23 Feb-hazard level lowered from 4 to 3. HCl/SO2 = 0.74 (19 Feb); 0.7 (22 Feb). |
| 26 Feb-05 Mar 2010 | 7 | 1 | -- | 9 | Swarm of 7 hybrids on 4 Mar. HCl/SO2 = 0.81 (1 Mar); 0.71 (2 Mar); 0.98 (4 Mar). |
| 05 Mar-12 Mar 2010 | 47 | 9 | 2 | 7 | Hybrid swarm of 6 on 11 Mar |
| 12 Mar-19 Mar 2010 | 41 | 3 | -- | 7 | 17 Mar- SO2 flux 2,315 tons/day. HCl/SO2 = 0.6 |
| 19 Mar-26 Mar 2010 | 28 | 3 | 1 | 3 | Avg. SO2 flux 342 tons/day |
| 26 Mar-02 Apr 2010 | 17 | -- | -- | 1 | Avg. SO2 flux 194 tons/day |
| 02 Apr-09 Apr 2010 | 9 | 1 | 3 | 3 | 3-day avg. SO2 flux 376 tons/day |
Table 71. Brief summary of dome emissions compiled from MVO reports, 4 December 2009-1 April 2010. Date entries indicated with a * are discussed in the text. Courtesy of MVO.
| Date | Dome Activity | Location of pyroclastic flows (PF) and rockfalls (RF) (runout distance from dome) |
| 11 Dec-31 Dec 2009 | Hottest and most active areas located on NW flank. | Whites Ghaut to Whites Bottom Ghaut to the sea (4 km); Tyres Ghaut (~1-2 km); Gages valley (~2 km); Tar River valley; Gingoes Ghaut; Farrells plain, Dyers village (~2.5 km), Spring Ghaut. |
| 31 Dec-08 Jan 2010 | Growth on N side; 2 January-40-m high, 150-m wide lobe of lava extruded onto dome. | Whites Ghaut, Farrells plain, Tyers Ghaut. |
| 08 Jan-15 Jan 2010 * | NE flank; 2 Jan-40-m high, 150-mwide lobe of lava extruded onto N summit of dome; 11 Jan-dome growth resumed on top, central part of dome. | 8 Jan-collapsing fountain of tephra generated PF down Whites Bottom Ghaut, Tuitts Ghaut (within several hundred meters of the sea), Tyers Ghaut, Belham valley, Tar River valley; 10 Jan-explosion produced PF down Whites Bottom and Tuitts Ghaut, Tyers Ghaut, Gages valley. |
| 15 Jan-22 Jan 2010 * | 18 Jan-partial dome collapse on W side of dome. | 18 Jan-PF reached sea down Aymers Ghaut (Gages valley to Spring Ghaut to Aymers Ghaut); houses inundated/burned in Kinsale. |
| 22 Jan-29 Jan 2010 | Dome growth on SE side of summit; NE side of summit has steep, vertical walls; NW part more rounded. | Increase in PF in Tar River valley (several reached sea); Whites Ghaut; heavy rain on 25 caused vigorous steaming of hot PF in Belham valley; some lahars formed. |
| 29 Jan-05 Feb 2010 | 5 Feb-central W part of lava dome grew to altitude of ~1,070 m. | Gages valley to Spring Ghaut (~2-3 km; head of Springs Ghaut neearly full of PF deposits), Whites Ghaut. |
| 05 Feb-12 Feb 2010 * | W side of dome; 9 Feb-activity shifted to N side of dome; 11 Feb-partial dome collapse, scar ~300 m wide on N flank of volcano (MVO-"largest event for volcano since May 2006"). | 5 Feb-volcanian explosion sent PF to Plymouth and into sea ~500 m, Tyers Ghaut (~2 km), Whites Ghaut, plume to ~8.4 km altitude; 8 Feb-small vulcanian explosion generated PF down Gages valley (over 2 km altitude), plume to ~5 km drifted E and ENE to Antigua; 11 Feb-PF reached on E side of island (coastline extended E ~650 meters at airport), Tyers Ghaut into Belham valley. |
| 12 Feb-19 Feb 2010 | Low activity, some incandescence on dome. | PF deposits ~15 m thick in Trant's region, PF razed many buildings in Harris and Streatham. |
| 19 Feb-26 Feb 2010 | Low activity. | -- |
| 26 Feb-05 Mar 2010 | 26 Feb-crater at summit of dome less than 100 m deep and ~200 m wide. | 4 Mar-Tar River valley. |
| 05 Mar-12 Mar 2010 * | Moderate activity. | 8-9 Mar-rainfall caused degradation of dome; Gages valley (~2 km). |
| 12 Mar-19 Mar 2010 * | Low activity; some incandescence on 14 Mar. | -- |
| 19 Mar-26 Mar 2010 | Low activity. | 25 Mar-Spring Ghaut (~2 km). |
| 26 Mar-02 Apr 2010 | Low activity. | -- |
| 02 Apr-09 Apr 2010 | Low activity; some incandescence on dome. | Lahars in Farm River and Trant's area. |
MVO issued a synthesis to the Scientific Advisory Committee (SAC) on volcanism between 15 August 2009 and 28 February 2010 (Cole and others, 2010). That report figures heavily in the following summary, but the included tables and comments also came from MVO reports, and there is a section on satellite thermal monitoring. Two similar earlier reports were published in 2009 (Robertson and others, 2009 and Stewart and others, 2009).
Since the dome remained active and at the same time represented the volcano's highest point, the summit elevation varied. The historical value of 915 m was a high point on the crater rim. Cole and others (2010) noted that the dome's summit was 1,050 m in September 2009, with the elevation being 1,130 m on 29 January 2010. Some taller heights involved blocky spines that did not last.
Extrusive Phase 5 activity. Extrusive Phase 4 finished on 3 January 2009 and was followed by 10 months of comparative inactivity with intermittent small pyroclastic flows and ash venting 5-7 October (BGVN 34:10). Phase 5 occurred from 4 October 2009 to 11 February 2010 (figure 83). Seismic records enabled MVO to subdivide this phase into three episodes of inferred dome growth as follows: 9 October-20 November 2009 (Episode 1); 20 November 2009-8 January 2010 (Episode 2); and 8 January-11 February 2010 (Episode 3). Cole and others (2010) noted that "A characteristic feature of Phase 5 dome growth has been the simultaneous occurrence of PFs in more than one direction, sometimes on the opposite side of the lava dome." Throughout Phase 5, ash often fell on inhabited areas.
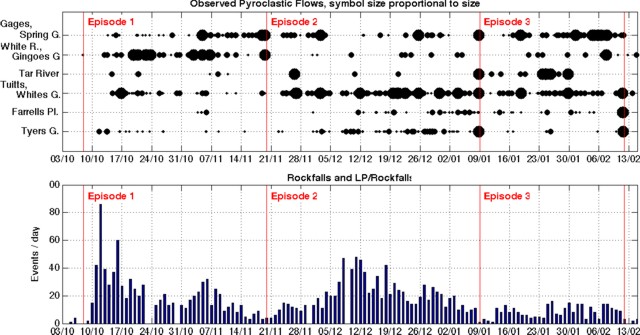 |
Figure 83. Rockfall and pyroclastic flow data from the Phase 5 interval (3 October 2009 to 14 February 2010) at Soufriere Hills. Pyroclastic flows were observed by MVO staff, mainly during work hours, with each assigned to one of six drainages (flow directions) and to one of three sizes (the symbol size is proportional to the PF's size). Daily counts of rockfalls and long-period earthquakes and rockfalls (LP/RF) were determined by inspection of seismic signals (from station MBFL located at MVO). From Cole and others (2010). |
Phase 5 began with a swarm of 24 volcano-tectonic (VT) earthquakes and ash venting. Gas fluxes had been low for two days prior to the onset of activity. The dome variously grew to the S, W, and N, and pyroclastic flows traveled in many directions. The eruptive style was described as "ash venting" rather than "explosions" due to the mild character of the associated seismic signals and the absence of ballistic fragments. Fallout deposits included comparatively coarse, well-sorted ash.
October dome growth mostly occurred on the S, with shed material filling the upper part of the SW flank's White River and covering what had stood as a protective wall for material traveling WSW. As a result, for the first time, substantial pyroclastic flows entered the WSW flank's Gingoes and Aymer's Ghauts, reaching the sea there with runout distances of over 4 km in those drainages.
Cyclic episodes of tremor occurred particularly during episode 2. On 23 November tremor occurred all day; it then waned and began to appear in cycles at 4-hour intervals, initially with signals of long-period and hybrid earthquakes. The tremor appeared associated with increased venting lasting 0.5-2 hours with plume heights to 5 km altitude. At 0640 on 10 December 2009, a large pyroclastic flow traveled down Tyers (Tyres) Ghaut and reached ~3.5 km from the lava dome.
Vigorous Vulcanian explosions occurred on five occasions during January-February 2010 (table 69), episode 3. All of these involved collapsing ash columns, producing fountain collapse pyroclastic flows that typically descended more than one ghaut. One explosion on 8 January, the largest by volume during January-February, sent a pyroclastic flow ~ 6 km down the Belham Valley. Two more Vulcanian explosions occurred during the night on 10 January.
Dome collapse of 11 February 2010. A large dome collapse took place in the early afternoon of 11 February, one day after a shift in dome-growth direction, and had several pulses. The collapse comprised 40-50 million cubic meters of material, and represented roughly 20% of the dome's total volume. A collapse scar ~ 300 m wide developed on the N flank of the dome. The collapse ended with vertically-directed explosions that created a new crater behind the collapsed part of the dome.
The collapse produced large pyroclastic flows and surges, mainly to the N and NE, that extended the E coastline (between Trants and Spanish Point), adding ~1 km2 of new land. Two smaller flows also traveled NW and entered the Belham Valley.
A large ash column resulted from the collapse that reached ~15 km altitude, causing extensive ashfall on Guadeloupe (~60 km SE) and other parts of the eastern Caribbean. After 11 February, both seismicity and surface activity quieted but deep deformation returned. Gas measurements also indicated that the system remained active.
Pyroclastic flows traveled N and NE toward the old airport. The extensive pyroclastic-flow deposits extended the coastline 300-400 m out to sea. The coastal area impacted extended from Whites Bottom Ghaut to Trants Bay, just N of the old Bramble airport (figures 84 and 85). The effects were clearly visible on the NE flanks. Some flows, ~ 15 m thick, reached the sea at Trant's Bay. These flows extended the island's coastline up to 650 m to the E.
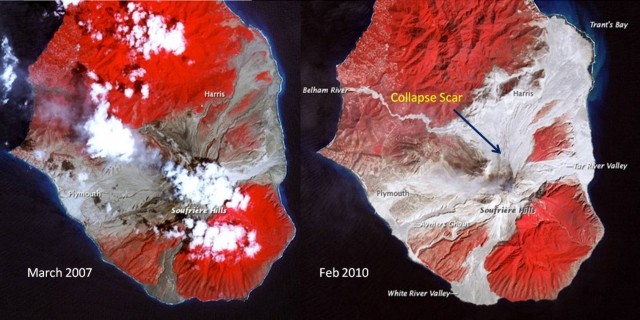 |
Figure 84. Two false-color satellite images, taken nearly 3 years apart at Soufriere Hills highlight the impact of the dome collapse of 11 February 2010. The image on the right is from 21 February 2010; the image on the left is from 17 March 2007. In colored versions of this image, red areas are vegetated, clouds are white, blue/black areas are ocean water, and gray areas are flow deposits. The large collapse scar on the N flank of the dome is visible (arrow). Several of the ghauts (valleys) on the SW side can be seen to have been nearly filled by pyroclastic flow deposits between October 2009 and February 2010. Images courtesy of NASA Earth Observatory. |
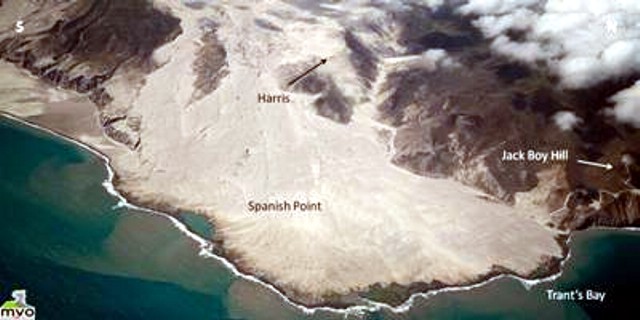 |
Figure 85. Taken one week after the events of 11 February 2010 at Soufrière Hills, this aerial photograph shows the new pyroclastic flows at Spanish Point. Courtesy of MVO. |
Towards the end of the collapse there was an energetic pyroclastic flow directed N over Streatham and Harris. This sent flows over the Harris Ridge into Bugby Hole and down the Farm River (~3.5 km from the dome) for the first time. The flows razed many buildings in both Harris and Streatham down to their foundations, and trees were felled by pyroclastic surges in the Gun Hill area and at the head of Farm River in Bugby Hole.
It was unclear whether there was any new dome growth within the crater during the week after the collapse. Night-time views of the dome revealed several small points of incandescence. Observations of the crater at the summit of the dome on 26 February found that it was then 50-100 m deep and ~200 m wide (figure 86). There was no newly extruded lava visible inside the crater.
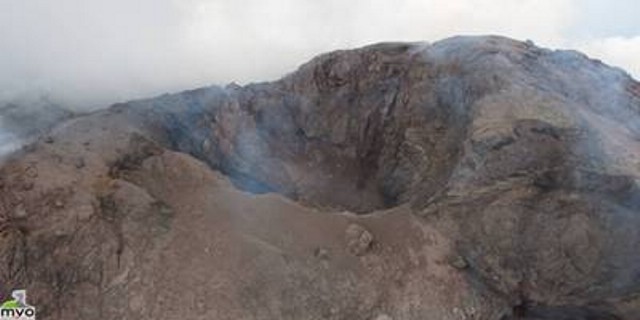 |
Figure 86. Views of the inside of the new crater at the summit of the Soufrière Hills dome taken on 26 February 2010. The dark material on the left is the deposit of a fresh rockfall that probably occurred a few days before the photograph was taken. Courtesy of MVO. |
Heavy rain on 8-9 March caused vigorous steaming of the hot 11 February deposits (figure 87). Strong geysering was visible at Trants near the old Bramble airport, with ash and steam fountaining occurring. In addition, lahars traveled down several drainages, including the Belham valley. Small spots of incandescence on the dome were visible again on 14 March. Occasional small pyroclastic flows and rockfalls were still occurring mainly from the western and southern parts of the dome.
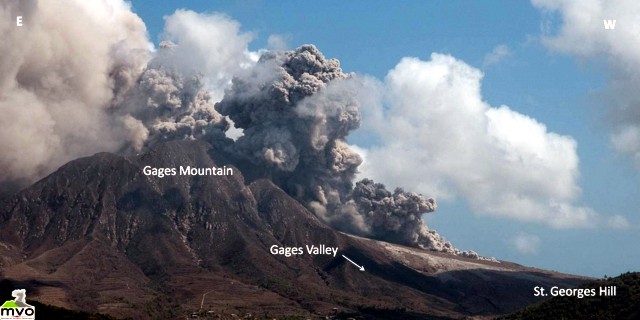 |
Figure 87. Heavy rainfall on 8 and 9 March 2010 triggered a series of small to moderate sized pyroclastic flows. These were derived from the old dome and collapse scar. Pyroclastic flows continued to form as small amounts of cooled lava were shed from the surface. Courtesy of MVO. |
MODVOLC Thermal Alerts. According to the Hawai'i Institute of Geophysics and Planetology (HIGP) Thermal Alerts System, no satellite thermal alerts were measured over Soufrière Hills between 29 March 2007 and 3 December 2008. Satellite thermal alerts were measured almost daily during 11 October 2009 through 15 February 2010. An isolated thermal alert was measured on 10 March 2010. Previously shorter periods of thermal alerts were measured during 11-29 March 2007 and 3 December 2008-3 January 2009.
References. Cole, P., Bass, V., Christopher, C., Fergus, M., Gunn, L., Odbert, H., Simpson, R., Stewart, R., Stinton, A., Stone, J., Syers, R., Robertson, R., Watts, R., and Williams, P., 2010, Report to the Scientific Advisory Committee on Montserrat Volcanic Activity, Report on Activity between 15 August 2009 and 28 February 2010, Open File Report OFR 10-01a, Prepared for SAC 14: 22-24 March 2010. Montserrat Volcano Observatory (MVO).
Robertson, R., Babal, L., Bass, V., Christopher, T., Chardot, L., Fergus, M., Fournier, N., Higgins, M., Joseph, E., Komorowski, J.-C., Odbert, H., Simpson, R., Smith, P., Stewart, R., Stone, J., Syers, R., Tsaines, B., and Williams, P., 2009, Report for the Scientific Advisory Committee on Montserrat Volcanic Activity, Prepared for SAC 13: 7-9 September 2009, MVO Open File Report 09/03.
Stewart, R., Bass, V., Chardot, L., Christopher, T., Dondin, F., Finizola, A., Fournier, N., Joseph, E., Komorowski, J.-C., Legendre, Y., Peltier, A., Robertson, R., Syers, R., and Williams, P., 2009, Report for the Scientific Advisory Committee on Montserrat Volcanic Activity, Prepared for SAC12: 9-11 March 2009, MVO Open File Report 09/01.
Wadge, G., Macfarlane, D.G., Robertson, D.A., Hale, A.J., Pinkerton, H., Burrell, R.V., Norton, G.E., and James, M.R., 2005, AVTIS: a novel millimetre-wave ground based instrument for volcano remote sensing: J. Volcanology and Geothermal Research, v. 146, no. 4, p. 307-318.
MVO, 1996, MVO/VSC Open Scientific Meeting, 27 November 1996, Seismicity of Montserrat Soufrière Hills Volcano Eruption, July 1995-November 1996 (URL: http://www.geo.mtu.edu/volcanoes/west.indies/soufriere/govt/meetings/nov1996/02.html).
Geological Summary. The complex, dominantly andesitic Soufrière Hills volcano occupies the southern half of the island of Montserrat. The summit area consists primarily of a series of lava domes emplaced along an ESE-trending zone. The volcano is flanked by Pleistocene complexes to the north and south. English's Crater, a 1-km-wide crater breached widely to the east by edifice collapse, was formed about 2000 years ago as a result of the youngest of several collapse events producing submarine debris-avalanche deposits. Block-and-ash flow and surge deposits associated with dome growth predominate in flank deposits, including those from an eruption that likely preceded the 1632 CE settlement of the island, allowing cultivation on recently devegetated land to near the summit. Non-eruptive seismic swarms occurred at 30-year intervals in the 20th century, but no historical eruptions were recorded until 1995. Long-term small-to-moderate ash eruptions beginning in that year were later accompanied by lava-dome growth and pyroclastic flows that forced evacuation of the southern half of the island and ultimately destroyed the capital city of Plymouth, causing major social and economic disruption.
Information Contacts: Montserrat Volcano Observatory (MVO), Fleming, Montserrat, West Indies (URL: http://www.mvo.ms/); Washington Volcanic Ash Advisory Center (VAAC), Satellite Analysis Branch (SAB), NOAA/NESDIS E/SP23, NOAA Science Center Room 401, 5200 Auth Rd, Camp Springs, MD 20746, USA (URL: http://www.ospo.noaa.gov/Products/atmosphere/vaac/); NASA Earth Observatory (URL: http://earthobservatory.nasa.gov/); Hawai'i Institute of Geophysics and Planetology (HIGP) Thermal Alerts System, School of Ocean and Earth Science and Technology (SOEST), Univ. of Hawai'i, 2525 Correa Road, Honolulu, HI 96822, USA (URL: http://modis.higp.hawaii.edu/).