Report on Eyjafjallajokull (Iceland) — March 2010
Bulletin of the Global Volcanism Network, vol. 35, no. 3 (March 2010)
Managing Editor: Richard Wunderman.
Eyjafjallajokull (Iceland) Fissure eruption and lava flows from E flank on 20 March
Please cite this report as:
Global Volcanism Program, 2010. Report on Eyjafjallajokull (Iceland) (Wunderman, R., ed.). Bulletin of the Global Volcanism Network, 35:3. Smithsonian Institution. https://doi.org/10.5479/si.GVP.BGVN201003-372020
Eyjafjallajokull
Iceland
63.633°N, 19.633°W; summit elev. 1651 m
All times are local (unless otherwise noted)
During March 2010, the Icelandic Meteorological Office (IMO) and the Nordic Volcanological Center of the University of Iceland's Institute of Earth Sciences (IES) reported the first eruption of Eyjafjallajökull volcano in southern Iceland since 1823. The following was mostly condensed from a multitude of reports on the EIS and IMO websites, and only discusses activity through the start of the explosive summit phase. Many of the satellite images featured here came from the NASA Earth Observatory.
From 20 March to 12 April 2010 the eruption's first phase occurred from a fissure 9 km ENE of the summit, an area named Fimmvörðuháls, located between the Eyjafjallajökull and Mýrdalsjökull icecaps (figure 1). These vents on the lower E slopes were snow-covered but not under the year-round icecap found at higher elevations. Lava flows filled gullies, and quickly melted adjacent winter snow, creating small steam plumes. After apparent cessation of the fissure activity on or about 12 April, a second phase of the eruption began on 14 April (figures 2 and 3, table 1), generating ash plumes that blew E to Europe and resulted in a 20-80% decrease of airline flights for as much as a week (Wall and Flottau, 2010). As of late May the eruption continued, with occasional plumes that restricted air travel in parts of Europe.
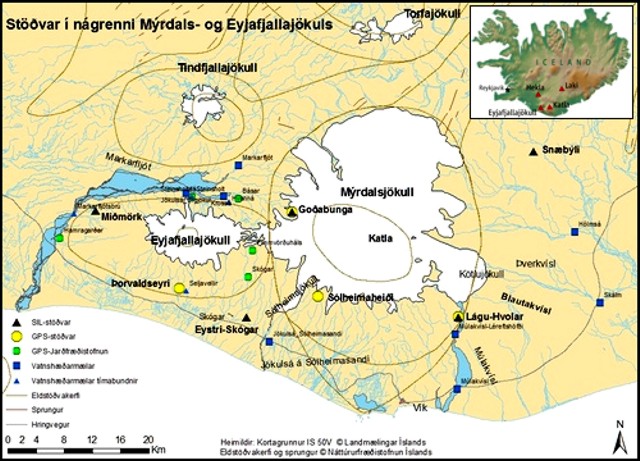 |
Figure 1. Map of southern Iceland showing Eyjafjallajökull and Katla volcanoes, towns, and locations of monitoring instruments. The Mýrdalsjökull icecap overlies Katla. ("Jökull" translates to "glacier" or "icecap" in English). Index map showing some eruptive centers is from Laursen (2010). Base map courtesy of IMO. |
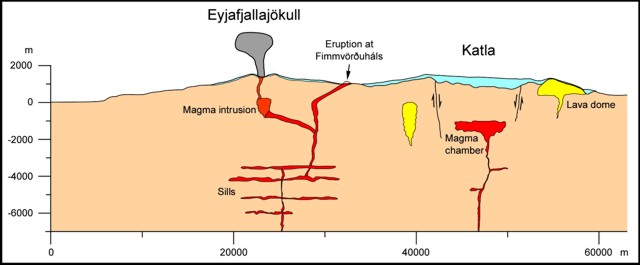 |
Figure 2. Approximately N-looking interpretive cross-section cartoon drawn between Eyjafjallajökull and Katla. The eruption of 20 March was located at Fimmvörðuháls. Starting on 14 April, eruptions took place at the summit caldera. Notice the thin upper layer (blue on colored versions) representing glacial ice and the inferred common linkage at ~ 2 km depth below sea level of the conduits feeding the two active vent areas. Courtesy of Páll Einarsson (IES). |
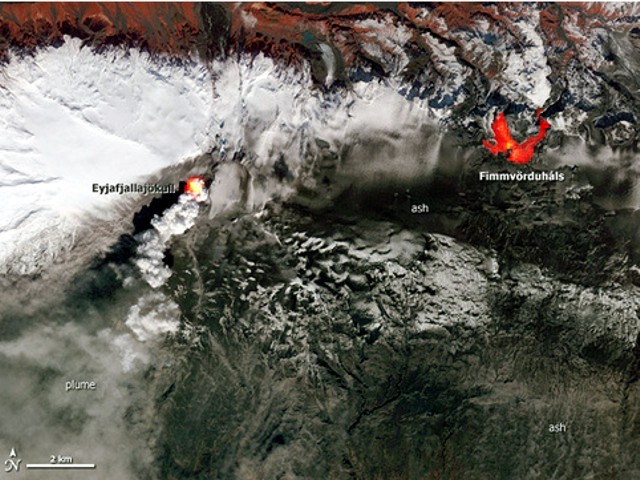 |
Figure 3. ASTER image of the Eyjafjallajökull-Fimmvörðuháls vents at 1350 local time on 19 April. The image shows both visible information and heat signatures from areas of anomalously high thermal infrared (IR) radiation (for colored versions, yellow is hottest, red, cooler). For the Fimmvörðuháls the thermal signature shows the extent of lava flows no longer extruding but still hot. At the summit, the vent is clearly active, with a thermal signature and a dense white plume blowing SSE. ASTER is the Advanced Spaceborne Thermal Emission and Reflection Radiometer flying on NASA's Terra satellite. Courtesy of Rob Simmon, the U.S./Japan ASTER Science Team, and Holli Riebeek, NASA Earth Observatory. |
Table 1. Preliminary data regarding the 2010 eruption of Eyjafjallajökull, which started at an E-flank vent (Fimmvörðuháls) and then later shifted to the ice-covered summit caldera. The grain sizes of the second phase of the eruption were quantified by The Environment Agency of Iceland; other data courtesy of IMO and IES.
| Dates | Activity | Rock type and description |
| 20 Mar-12 Apr 2010 | Fissure eruptions of lava flows at Fimmvörðuháls. | Alkali-olivine basalt (~47.7 wt % SiO2). Euhedral plagiclase, olivine, and clinopyroxene phenocrysts seem to be in equilibrium with magma. |
| 14 Apr 2010 and later | Explosions from the summit caldera of Eyjafjallajökull. Ash clouds, initially up to ~11 km altitude. | Trachyandesite (56.7-59.6 wt % SiO2). Grain size from sample at Mýrdalssandur (50 km from vent): 24%, under 10 ?m (as aerosol); 33% , 10-50 ?m; 20% , 50-146 ?m; 23%, 146-294 ?m. Fluorine: 850 mg/kg (19 April). |
Precursory observations. The IES website contained a list of scientific papers and publications including several noting restlessness at Fimmvörðuhálsat in recent years (see Further References below). The IES reports noted that the Fimmvörðuháls eruption followed weeks of high seismicity and deformation (figure 4).
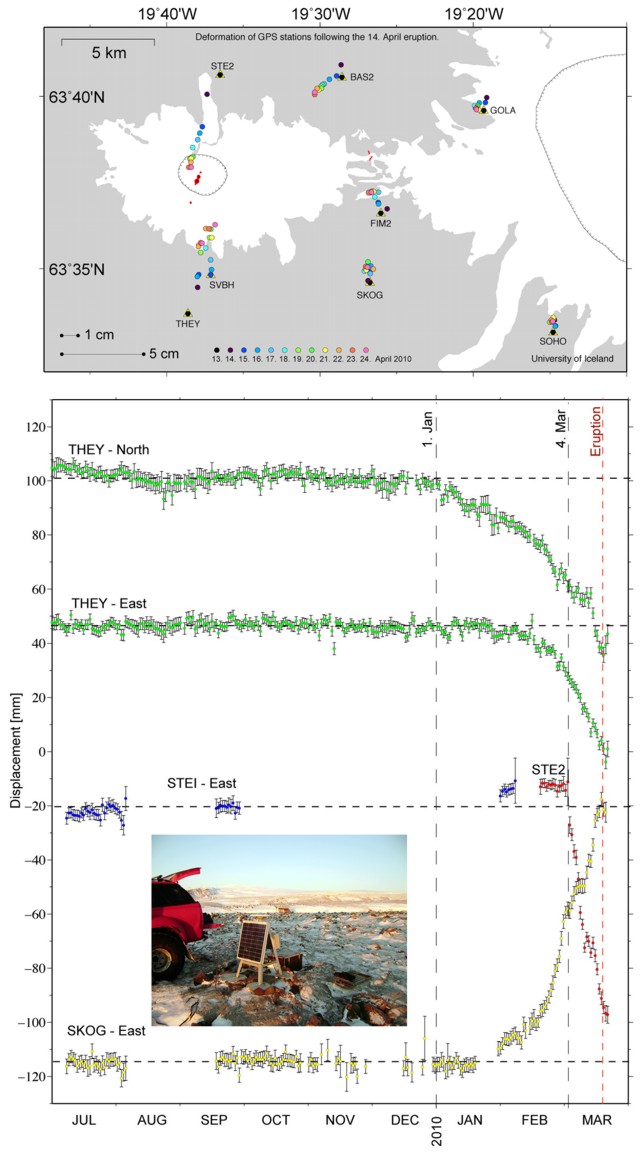 |
Figure 4. (top) Map of the southern Iceland GPS (Global Positioning System) network, including stations THEY, SKOG, STE1, and STE2. (bottom) Displacement measurements for selected continuous/semi-continuous GPS stations around Eyjafjallajökull from early July 2009 to early March 2010. Inset photograph is of station SKOG. Courtesy of IES. |
In general terms, GPS data indicated that permanent station Thorvaldseyri (THEY; S of the volcano, figure 4) started moving S in late December 2009. In the weeks prior to the eruption, there was rapid deformation at Skogaheidi (SKOG; S of the volcano) and Steinsholt (STE1 and STE2; N of the volcano). IES identified three distinct phases in the GPS data. First, at the end of December, the southward motion of THEY. Second, at the beginning of February 2010, displacement at THEY changed to SW as SKOG began E displacement. Third, after 5 March, STE2 displaced rapidly NW and up. Scientists noticed a trend after 4 March at continuous GPS sites installed within 12 km of the eruptive site; all showed deformation at rates of up to a centimeter a day.
Seismic tremor began around 2230 on 4 March, and around that time, signal sources rose slowly towards the surface. Compared to the weeks prior to the eruption, seismicity increased rather slowly immediately prior to the eruption. However, as the eruption onset neared, geophysicists saw both the depth of earthquakes decrease and the locations of earthquakes move from the area under the summit towards the Fimmvörðuháls site.
According to Laursen (2010) "Eyjafjallajökull's so-far-unpredictable behavior offers a perfect example of the challenge facing volcanologists. Before this spring's first eruption...GPS stations on the volcano had wandered several centimeters in May of 2009 and again in December, signs that rising magma was stretching the skin of the volcano in advance of an eruption. In mid-February...Steinunn Jakobsdóttir, a geophysicist at IMO, was tracking tremors ~ 5 kilometers below Eyjafjallajökull's surface. But officials didn't order evacuations because the seismic hints weren't that dire. 'Usually when an eruption starts, a low-frequency [seismic signal] is rising when the magma is coming to the surface,' says Jakobsdóttir. Although seismic tracking placed magma closer to the surface on 19 March, this low-frequency signal was absent, so civil authorities kept the alert level at its lowest setting. But the next night, southern Icelanders reported a dark cloud glowing red above the mountain: The volcano had experienced a small eruption, one that led authorities to evacuate farmers living in its floodplains."
Eruption from Fimmvörðuháls. Late on 20 March 2010 an eruption began at Fimmvörðuháls, an area around 1,000 m elevation in a ~ 2-km-wide pass of ice-free land between Eyjafjallajökull and Mýrdalsjökull. Initially detected visually, the eruption was seen at 2352 that day as a red cloud above the site.
The eruption broke out with Hawaiian-style fire fountains (figure 5) on a ~ 500-m-long, NE-oriented fissure (at 63° 38.1' N, 19° 26.4' W). Lava flowed a short distance from the eruptive site and a minor eruption plume rose to less than 1 km altitude and blew W. Tephra fall was minor or insignificant.
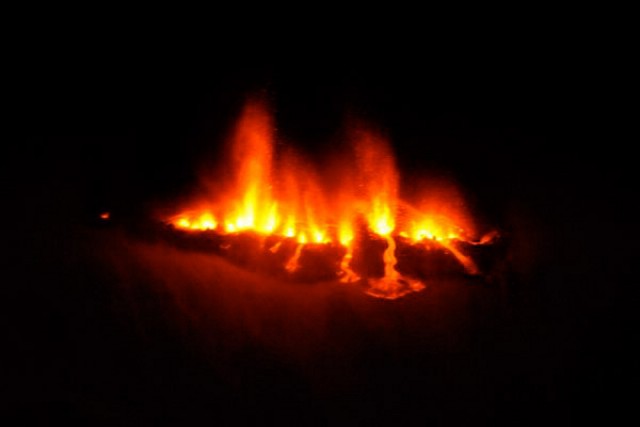 |
Figure 5. Image of fissure eruption at Eyjafjallajökull taken 21 March 2010 by Sigrún Hreinsdóttir. Courtesy of IES. |
Airborne observers during 0400-0700 on 21 March described a short eruptive fissure with fire fountaining from 10-12 vents reaching up to ~ 100 m height. Eruption tremor rose slowly until reaching a maximum at around 0700-0800 that day. No further lengthening of the fissure was detected. Lava was still limited to the immediate surroundings of the eruptive craters (runouts of less than few hundred meters). Minor ashfall occurred within a few kilometers W.
On 22 March, observations made from the ground showed lava extrusion from a series of closely-spaced vents. Prevailing E winds led to maximum scoria accumulation on a linear rim W of the NE-trending fissure. A'a lava flowed over the steep Hrunagil canyon rim creating spectacular 'lava falls.'
During 23-31 March, lava steadily issued at the initial craters, with gradual focusing towards fewer vents. Lava advanced N into the Hrunagil and Hvannárgil valleys, with continuation of intermittent lava falls (figures 6-8). Lava descending gullies generated zones of frothy rock. Extensive steam plumes occurred when advancing lava encountered water and snow. Two or three plumes were observed (one at the eruptive craters, others more pronounced in front of the advancing lava). Meltwater descended in batches into rivers valleys, and seismometers recorded relatively steady eruption tremor.
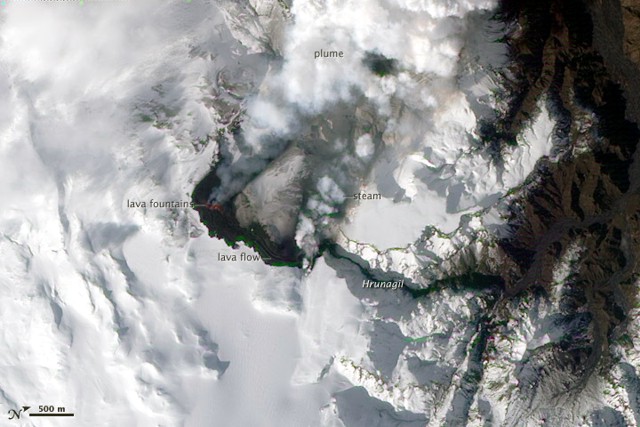 |
Figure 6. EO-1 ALI satellite image with annotations indicating path of lava flows from the Fimmvörðuháls vent, 24 March 2010. Note N arrow and scale at lower left. Courtesy of Robert Simmon, NASA Earth Observatory. |
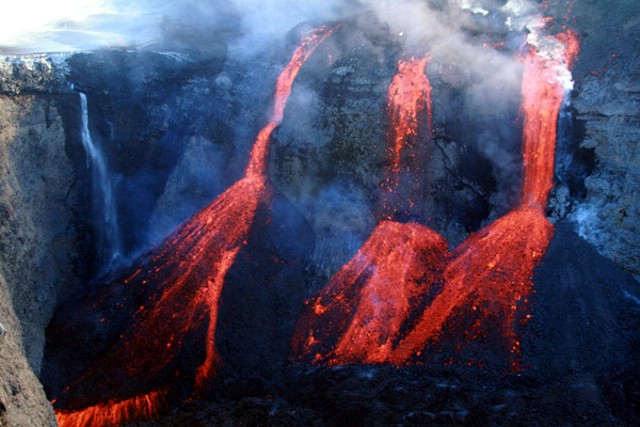 |
Figure 7. Photo showing lava falls developed when lava flows encountered steep canyon walls, 1 April 2010. Courtesy of Sigrún Hreinsdóttir, IES. |
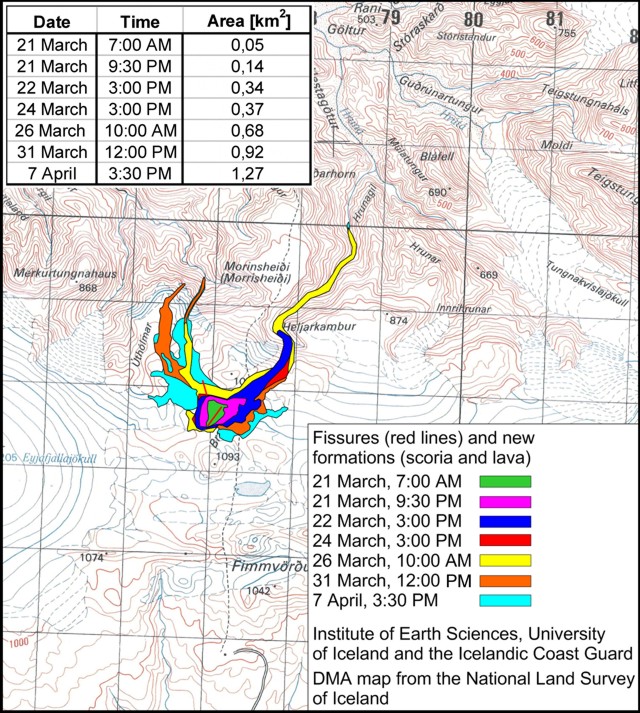 |
Figure 8. Map showing Fimmvörðuháls fissures and the distribution of new scoria and lava at various points in time during 21 March-7 April 2010. Table indicates cumulative areal extent of the deposits. Courtesy of EIS and Icelandic Coast Guard. |
On the evening of 31 March, scientists noted the opening of a new short fissure immediately N of the previous one. This change may have been a response to changes at shallow depth in the feeder channel. Eruption tremor remained unchanged. During 31 March-6 April, lava discharged in both the old and new eruptive craters in a manner similar to before. Pronounced 'lava falls' returned to Hvannárgil valley.
During 1-2 April 2010 a team from the Italian Instituto Nazionale di Geofisica e Vulcanologia (INGV) working in collaboration with the scientists from IES conducted gas measurements at Fimmvörðuháls (Burton and others, 2010). Three measurement techniques were used: open-path FTIR (Fourier transform infrared spectroscopy), DOAS (differential optical absorption spectroscopy), and a sulfur dioxide (SO2) imaging system. The FTIR spectrometer uses infrared radiation emitted from the erupting lavas as a source for absorption spectrometry of gases emitted from the explosive vents. Spectra are analyzed using a single-beam retrieval, which allows pathlength estimates of H2O, CO2, SO2, HCl, and HF. Favorable wind conditions allowed traverse measurements under the gas plume with a DOAS spectrometer for SO2 flux estimates.
The investigators found that the SO2 gas flux was ~ 3,000 metric tons per day. Approximately 70% of the SO2 flux was produced by the fissure that opened 31 March, with ~ 30% emitted by the fissure that had opened on 21 March. The overall HF flux was ~ 30 tons per day. Gas compositions emitted from the two fissures were broadly similar and rich in H2O (over 80% by mole), less than 15% CO2, and less than 3% SO2. The SO2/HCl ratio varied at the 31 March fissure on 1 and 2 April (25% and 5%, respectively).
On 5 April, eruption tremor (at 1-2 Hz recorded at the nearest seismic station, Godabunga) began to gradually decline. By 7 April lava emissions had stopped from the original craters, but continued at the 31 March fissure.
When IES surveyed the new landscape on 7 April (figure 9), they found 1.3 km2 of new lava, an average thickness of new lava there of 10-12 m, and an estimated volume of eruptive material of 22-24 x 106 m3. From this they computed an average emission rate of ~ 15 m3/s. The tallest new cone reached an elevation 1,067 m, ~ 82 m above the previous ground surface. Another cone with a rim at 1,032 m elevation was 47 m above the previous surface and the vent area glowed red.
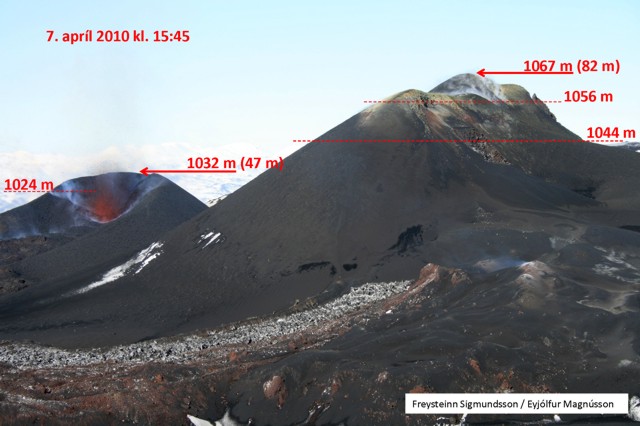 |
Figure 9. The Fimmvörðuháls as surveyed and photographed by Freysteinn Sigmundsson and Eyjólfur Magnússon on 7 April 2010. Values shown are elevations and those in parentheses refer to the approximate net gain in elevation due to fresh deposits on the pre-eruption surface. Courtesy of IES. |
By 9 April, after little change in deformation rates during the eruption, time series at continuous GPS stations N of the volcano showed sudden change, partly jumping back to pre-eruptive levels. On 11 April, eruption tremor also approached pre-eruptive levels, but visual observation revealed eruptive activity in late afternoon. Seismic tremor on 12 April reached a minimum.
Eruption from the summit caldera. The second, more explosive eruptive phase, began on 14 April 2010 at the subglacial, central summit caldera. This phase was preceded by an earthquake swarm from around 2300 on 13 April to 0100 on 14 April. Meltwater started to emanate from the icecap around 0700 on 14 April and an eruption plume was observed later that morning. The exact conditions at the summit were unknown due to cloud cover obscuring the volcano, but on 15 April an overflight imaged the erupting caldera using radar (figure 10).
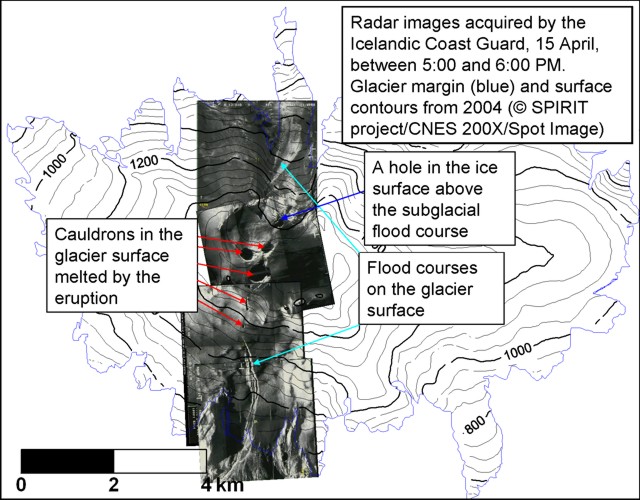 |
Figure 10. This 15 April radar image of the Eyjafjallajökull eruption depicts the otherwise hidden scene at the cloud-covered summit caldera. The glacial snow and ice had deformed and melted, forming circular depressions (ice cauldrons) in the icecap's surface. Flooding from the melting glacier had led to the various features on and below the glacier to the N and S (illustrated by labels). The data were acquired via aircraft by the Icelandic Coast Guard during 1700-1800 on 15 April 2010. The glacier margin and surface contours came from a 2004 investigation. Courtesy of Icelandic Coast Guard and IES. |
The 15 April radar image helped depict a series of vents along a 2-km-long, N-oriented fissure. Both on top of and from below, meltwater flowed down the N and S slopes. Jokulhlaups (floods of meltwater also carrying considerable debris) reached the lowlands around the volcano with peak flow around noon on 14 April, causing destruction of roads, infrastructure, and farmlands. Residents had earlier been evacuated from hazardous areas. Tephra fall began in SE Iceland. That evening, a second jokulhlaup emanated from the icecap down the Markarfljot valley, which trends E-W along the N margin of the volcano and contains extensive outwash from surrounding glaciers.
On 15 April the ash plume reached a maximum altitude of over 8 km. E-blown ash began to arrive over mainland Europe closing airspace over the British Isles and large parts of Northern Europe. Ash generation continued at a similar level. Meltwater emerged from the glacier in pulses. Debris-charged jokulhlaups were seen in the evening.
Chemical analyses of mid-April ash samples revealed fluorine-rich intermediate eruptive products with silica content of ~ 58%. The initial lavas erupted at Fimmvörðuháls had silica contents of ~ 48% (table 1).
References. Burton, M., Salerno, G., La Spina, A., Stefansson, A., and Kaasalainen, H., 2010, Gas composition and flux report, IES web site.
Laursen, L., 2010, Iceland eruptions fuel interest in volcanic gas monitoring: Science, v. 328, no. 5977, p. 410-411.
Sigmarsson, O., Óskarsson, N., Þórðarson, Þ., Larsen, and G., Höskuldsson, Á, 2010, Preliminary interpretations of chemical analysis of tephra from Eyjafjallajökull volcano (report on the IES website).
Wall, R., and Flottau, J., 2010. Out of the ashes: Rising losses and recriminations rile Europe's air transport sector: Aviation Week & Space Technology, v. 172, no. 16, p.23-25.
Further References. Dahm, T., and Brandsdóttir, B., 1997, Moment tensors of micro-earthquakes from the Eyjafjallajökull volcano in South Iceland: Geophysical Journal International, v. 130, no.1, p. 183-192, DOI:10.1111/j.1365-246X.1997.tb00997.x.
Guðmundsson, M.T., and Gylfason, A.G., 2004, H?ttumat vegna eldgosa og hlaupa frá vestanverðum Mýrdalsjökli og Eyjafjallajökli. Háskólaútgáfan og Ríkislögreglustjórinn [Volcanic risk assessment run from Mýrdalsjökli and Eyjafjallajökull measurements]: University of Iceland and the National Police, 230 p.
Hjaltadottir, S., K. S. Vogfjord and R. Slunga, 2009, Seismic signs of magma pathways through the crust at Eyjafjallajokull volcanoe, South Iceland: Icelandic Meteorological Office report, VI 2009-013 (http://www.vedur.is/media/vedurstofan/utgafa/skyrslur/2009/VI_2009_013.pdf).
Hooper, A., Pedersen, R., and Sigmundsson, F., 2009, Constraints on magma intrusion at Eyjafjallajökull and Katla volcanoes in Iceland, from time series SAR interferometry, p. 13-24 in Bean, C.J., Braiden, A.K., Lokmer, I., Martini, F., and O'Brien, G.S., eds., The VOLUME project - Volcanoes: Understanding subsurface mass movement: School of Geological Sciences, University College Dublin.
Larsen, G., 1999, Gosi í Eyjafjallajökli 1821-1823 [The eruption of the Eyjafjallajökull volcano in 1821-1823]: Science Institute Research Report RH-28-99, Reykjavík, 13 p.
Pedersen, R., Sigmundsson, F., and Einarsson, P., 2007, Controlling factors on earthquake swarms associated with magmatic intrusions; Constraints from Iceland: Journal of Volcanology and Geothermal Research, v. 162, p. 73-80.
Pedersen, R., and Sigmundsson, F., 2004, InSAR based sill model links spatially offset areas of deformation and seismicity for the 1994 unrest episode at Eyjafjallajökull volcano, Iceland: Geophysical Research Letters, v. 31, L14610 doi: 10.1029/2004GL020368.
Pedersen, R., and Sigmundsson, F., 2006, Temporal development of the 1999 intrusive episode in the Eyjafjallajökull volcano, Iceland, derived from InSAR images: Bulletin Volcanology, v. 68, p. 377-393.
Sigmundsson, F., Geirsson, H., Hooper, A. J., Hjaltadottir, S., Vogfjord, K. S., Sturkell, E. C., Pedersen, R., Pinel, V., Fabien, A., Einarsson, P., Gudmundsson, M. T., Ofeigsson, B., and Feigl, K., 2009, Magma ascent at coupled volcanoes: Episodic magma injection at Katla and Eyjafjallajökull ice-covered volcanoes in Iceland and the onset of a new unrest episode in 2009: Eos (Transactions of the American Geophysical Union), v. 90, no. 52, Fall Meeting Supplement, Abstract V32B-03.
Sturkell, E., Einarsson, P., Sigmundsson, F., Hooper, A., Ófeigsson, B.G., Geirsson, H., and Ólafsson, H., 2009, Katla and Eyjafjallajökull volcanoes, p. 5-12 in Schomacker, A., Krüger. J., and Kjr, K.H., eds., The Mrdalsjökull Ice cap, Iceland - Glacial processes, sediments and landforms on an active volcano: Developments in Quaternary Sciences, v. 13.
Geological Summary. Eyjafjallajökull (also known as Eyjafjöll) is located west of Katla volcano. It consists of an elongated ice-covered stratovolcano with a 2.5-km-wide summit caldera. Fissure-fed lava flows occur on both the E and W flanks, but are more prominent on the western side. Although the volcano has erupted during historical time, it has been less active than other volcanoes of Iceland's eastern volcanic zone, and relatively few Holocene lava flows are known. An intrusion beneath the S flank from July-December 1999 was accompanied by increased seismic activity. The last historical activity prior to an eruption in 2010 produced intermediate-to-silicic tephra from the central caldera during December 1821 to January 1823.
Information Contacts: Nordic Volcanological Center, Institute of Earth Sciences, University of Iceland, Sturlugata 7, Askja, 101 Reykjavík, Iceland (URL: http://www.earthice.hi.is/page/ies_volcanoes) [contributors:Páll Einarsson, ásta Rut Hjartardóttir, Magnus Tumi Gudmundsson, Freysteinn Sigmundsson, Niels Oskarsson, Gudrun Larsen, Sigrun Hreinsdottir, Rikke Pedersen, Ingibjörg Jónsdóttir]; Icelandic Meteorological Office (IMO), Bústaðavegur 9, 150 Reykjavík, Iceland (URL: http://en.vedur.is/) [contributors:Steinunn Jakobsdóttir, Kristin S. Vogfjord, Sigurlaug Hjaltadottir, Gunnar B. Gudmundsson, Matthew J. Roberts]; The Environment Agency of Iceland, Sudurlandsbraut 24, 108 Reykjavik, Iceland (URL: http://english.ust.is/); NASA Earth Observatory (URL: http://earthobservatory.nasa.gov/); London Volcanic Ash Advisory Centre, Met Office, FitzRoy Road, Exeter, Devon EX1 3PB, United Kingdom (URL: http://www.metoffice.gov.uk/aviation/vaac/).