Report on Chaiten (Chile) — November 2011
Bulletin of the Global Volcanism Network, vol. 36, no. 11 (November 2011)
Managing Editor: Richard Wunderman.
Edited by Robert Dennen.
Chaiten (Chile) Declining vigor; magma ascent rate; disaster recovery in the town of Chaitén
Please cite this report as:
Global Volcanism Program, 2011. Report on Chaiten (Chile) (Dennen, R., and Wunderman, R., eds.). Bulletin of the Global Volcanism Network, 36:11. Smithsonian Institution. https://doi.org/10.5479/si.GVP.BGVN201111-358041
Chaiten
Chile
42.8349°S, 72.6514°W; summit elev. 1122 m
All times are local (unless otherwise noted)
The previous report on Chaitén volcano, Chile (BGVN 35:12) noted that a second new lava dome was reported on 4 November 2008. The Alert Level remained at Red (the highest of the alert level system) from the onset of the eruption on 2 May 2008 through April 2010. This report will chronologically summarize the growth of the new lava domes and major eruptive events. In general, a gradual decline in activity occurred during November 2008-September 2011. The Alert Level stood at Yellow during May 2010-May 2011, and was then lowered to Green, where it remained through the end of 2011. Most of the information in this report comes from weekly to monthly reports from the Observatorio Volcanológico de los Andes del Sur-Servicio Nacional de Geología y Minería (OVDAS-SERNAGEOMIN) with collaboration from the Oficina Nacional de Emergencia - Ministerio del Interior (ONEMI). Finally, the current status of the town of Chaitén (which was abandoned by all but a handful of residents who continued to live there without electricity or running water) will be discussed. The potential hazards from dome-collapse-generated block-and-ash flows and lahars from remobilized volcanic deposits were persistent throughout the reporting period.
Portions of this report were initially synthesized and edited by Nick Legg (covering November 2008-March 2009) and Eduardo Guerrero (covering April 2009-July 2009), as part of a graduate student writing assignment in a volcanology class at Oregon State University under the guidance of professor Shan de Silva.
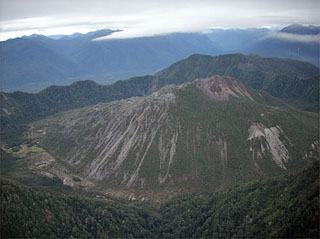
New lava domes observed. Initially occupying the caldera of Chaitén was the lava dome ('old dome') that existed prior to the 2 May 2008 eruption (and for the ~ 9,400 years since the previous eruption). A lava dome ('Dome 1') first observed on 21 May 2008 and a new lava dome ('Dome 2') confirmed on 4 November 2008 during an overflight (BGVN 35:12) were extruded on top of the old dome (figures 22 and 23). A third phase of dome extrusion ('Dome 3') was observed on 29 September 2009.
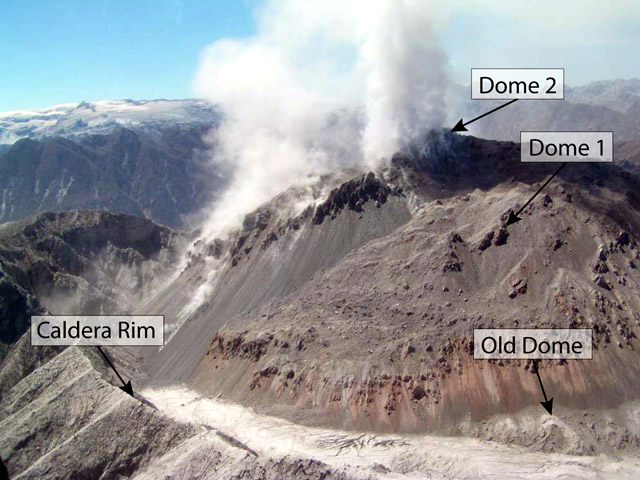 |
Figure 22. December 2008 aerial photograph of the Chaitén dome complex taken looking approximately SE into the caldera. The domes were emplaced on top of the old dome, emplaced ~9,400 years ago. Courtesy of OVDAS-SERNAGEOMIN. |
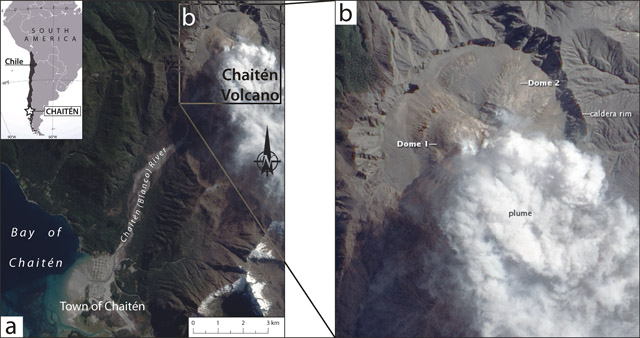 |
Figure 23. Satellite photograph of Chaitén and surroundings, acquired on 30 September 2009. (a) Chaitén volcano (top right corner), Chaitén (Blanco) River, and their proximity to the town of Chaitén (bottom left). Note the significant lahar deposits at the mouth of the Chaitén river and cutting through the town of Chaitén. Inset index map shows Chaitén's location in Southern Chile. (b) Enlarged, annotated view of Chaitén volcano. Dome 1 is in the W side of the caldera and Dome 2 is in the NNE part. Dome 3 is not visible in this photograph. Satellite photograph courtesy of NASA Earth Observatory; index map modified from MapsOf.net. |
November 2008-April 2010 (Red Alert). Following the confirmation of the existence of Dome 2 on 4 November 2008, a lateral explosion occurred on 17 November, directed WSW. The explosion was not constrained to either Dome 1 or 2 alone, but was associated with a collapse resulting from continued dome extrusion. By 6 December 2008, both active domes had exceed the height of the caldera rim (Dome 1 by ~ 250 m and Dome 2 by ~ 350 m). SERNAGEOMIN reported an increase in the growth of Dome 2, corresponding to a temporally slight increase in both hybrid (HB) and volcano-tectonic (VT) earthquakes.
Plumes continued to vary in color, indicating varying contributions of steam and ash from both new domes. By 9 January 2009, an observational overflight revealed that the inner caldera had been filled by Domes 1 and 2, and growth of sharp spines or pinnacles was reported.
On 19 January, a major collapse of the Dome 2 summit spines occurred, producing block-and-ash flows that traveled down the SE and E flanks of Chaitén. After the collapse, observers noted a decrease in seismicity and slowed dome extrusion.
During a flyby facilitated by ONEMI and the Chilean Air Force on 21 January 2009, researchers from the University at Buffalo-State University of New York (UB-SUNY) and the University of Chile acquired thermal images of the dome complex (figure 24). The thermal images indicated that, while Dome 1 still had areas of elevated temperature, the highest temperatures (greater than 150°C) corresponded to the pinnacles at the summit of Dome 2 (figure 24a). Images of pyroclastic flow and rockfall deposits resting within the E part of the caldera disclosed elevated temperatures there as well (higher than 80°C in places, figure 24b). Their research on thermal imaging of Chaitén will be showcased in an upcoming publication.
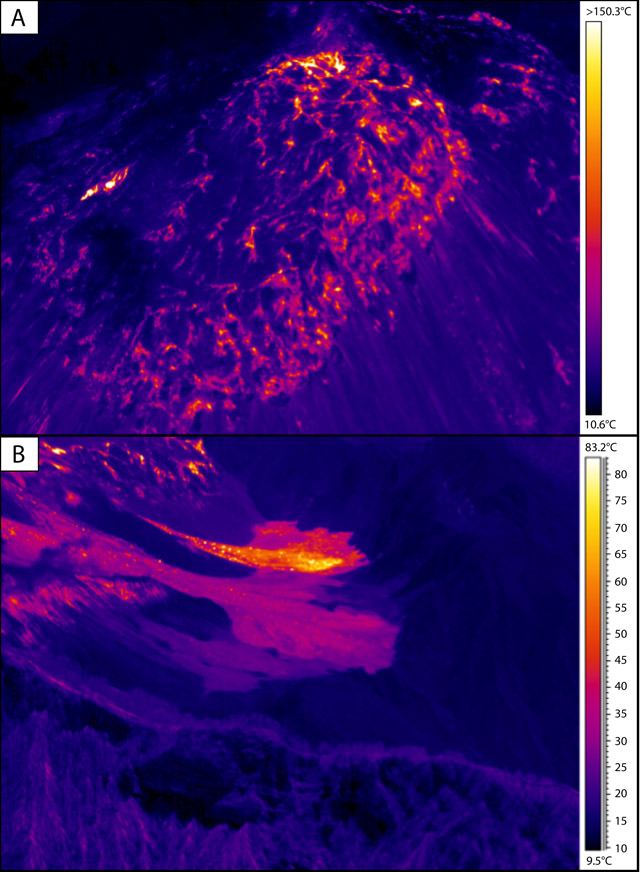 |
Figure 24. Thermal images of the dome complex of Chaitén acquired on 21 January 2009. (a) The summit of Dome 2, where the highest temperatures were recorded; the same area corresponded to the pinnacles and the area of the most rapid growth of Dome 2. (b) Pyroclastic flow and rockfall deposits within the E part of the caldera, emplaced just prior to 21 January, that were still elevated in temperature. The colors are scaled uniquely for both images with the temperature scales shown at right. The flyby was facilitated by ONEMI and the Chilean Air Force, the images were acquired by Patrick Whelley (UB) and Andrés Paves (University of Chile), and processing was performed by Marc Bernstein (UB); use of the thermal camera was courtesy of Eliza Calder under the UB-SUNY Research Foundation. |
By 9 February 2009, a new high-standing pinnacle atop Dome 2 indicated the return of rapid dome growth. This did not coincide with significant increases in seismicity.
On 19 February, a large partial collapse generated pyroclastic flows that traveled down the Chaitén River towards the town of Chaitén (see annotated photo below). This event produced a plume reaching 9.1 km altitude according to the Buenos Aires Volcanic Ash Advisory Center (VAAC). The plume was white (indicating high water vapor content) at the top, and contained abundant ash at the base. The collapse created a scarp measuring approximately 500 m by 500 m. Increased seismicity occurred on the same day; background volcanic tremor occurred from 1028 until 1346, and swarms of earthquakes ranging from M 3.6-4.2 originated at depths of 3-5 km. Due to the amount of material deposited from the collapse (~10 x 106 m3), SERNAGEOMIN reported a significantly higher than normal danger of lahars.
On 25 February 2009, dome growth focused on Dome 1, although seismicity had gradually decreased in frequency (excluding the outstanding events of mid-February discussed above) compared to November-December 2008 values. Despite the decrease, on the afternoon of 3 March, dome collapses occurred every ~ 40 minutes. Within the next few days, SERNAGEOMIN reported that "VT's almost disappeared." A gradual decrease in seismicity continued until 24 March, when the frequency of HB earthquakes increased briefly, but they decreased again by early April.
On 6 April, a prominent spine of lava was observed on the S part of Dome 1 (figure 25). It indicated that dome growth was still concentrated in the W part of the caldera (Dome 1). The next week, the same spine was reported to have a wider base, and the crater reportedly glowed at night. In early May, an aerial photograph captured a close view of a very fractured central lava spine of the dome complex (figure 26).
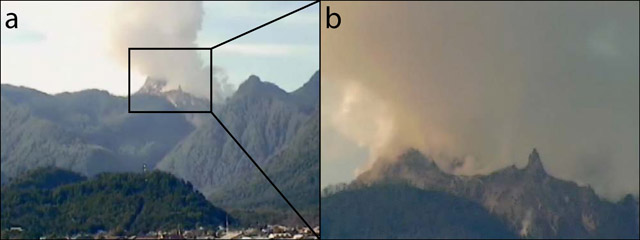 |
Figure 25. Images taken by Dirección General de Aeronáutica Civil (DGAC) and a Channel 13 cameraman on 6 April 2009 showing a prominent spine of lava that had grown in the S area of Dome 1. Courtesy of OVDAS-SERNAGEOMIN. |
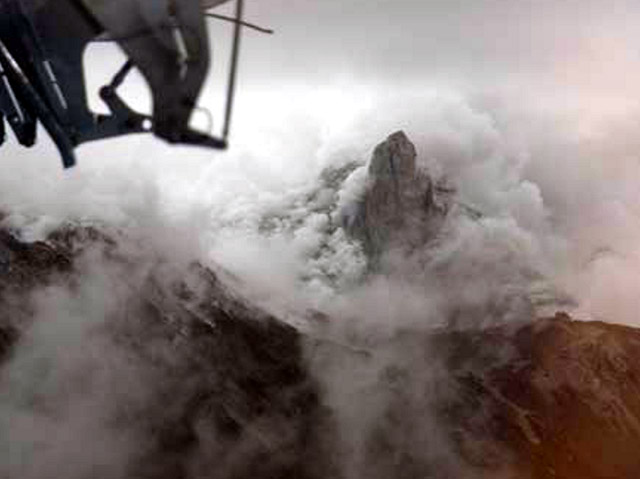 |
Figure 26. Aerial view of the dome complex in early May 2009 showing a very fractured central pinnacle. Courtesy of Javier Romero. |
In the later parts of May 2009, dome growth and seismicity continued to be focused on the W part of the caldera, associated with Dome 1. Although there was no significant increase in seismicity until a slight increase in June, witnesses in the town of Chaitén reporting feeling tremors in May. Otherwise, activity through August consisted of continuous ash-and-steam emissions, small collapses of unstable portions of the domes, and resulting block-and-ash flows. Seasonal precipitation remobilized previously erupted material and lahars reached the town in July.
Seismicity remained slightly elevated (relative to April and May) through September. On 14 September, a surveillance camera captured a plume as wide as the caldera reaching ~ 1.5 km high. This plume was significantly wider than plumes in the previous months. On 29 September, witness reports prompted SERNAGEOMIN to fly past the caldera, and obervers saw evidence of a significant recent collapse.
SERNAGEOMIN's 29 September observation flight provided stunning views of the dome complex leading to the detection of a new dome, Dome 3, that had filled the 19 February 2009 collapse scar (figures 27 and 28). Dome 3 had a depression in its N sector and small central pinnacles (figure 28). The central pinnacle of the whole complex had disappeared, and a large active depression, elongated to the NNW, had formed E of Dome 3. This depression reportedly resulted from either a lateral explosion or a relatively slow and structurally controlled internal collapse.
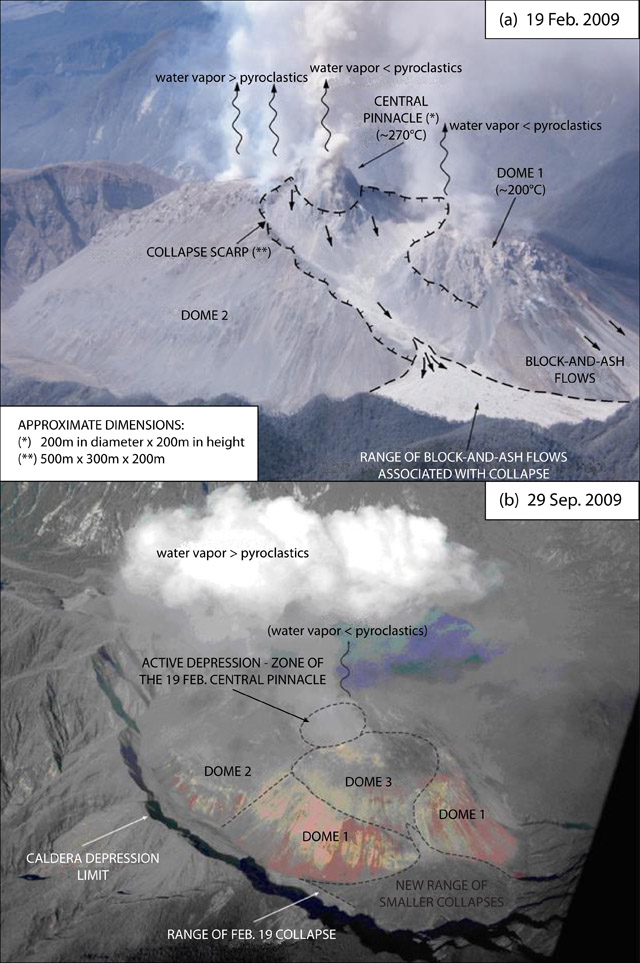 |
Figure 27. Aerial views of Chaitén’s dome complex taken following the partial collapses of (a) 19 February and (b) 29 September 2009. (a) The dome complex following the 19 February partial collapse. Dimensions of the central pinnacle (*) and the collapse scarp (**) are given at the lower left. (b) The dome complex following the 29 September partial collapse, showing the first observation of Dome 3. Labels in all capital letters indicate structures or deposits, and labels in all lowercase indicate relative amounts of water vapor and ash in emitted plumes. Courtesy of OVDAS-SERNAGEOMIN; (a) photo by Paul Duhart, (b) photo and interpretation by Jorge Muñoz. |
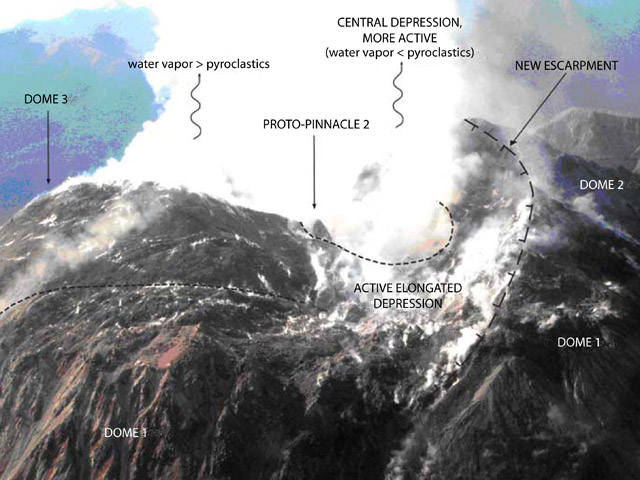 |
Figure 28. Aerial view of the center of Chaitén's dome complex on 29 September 2009. The then-newly ob served central depression is the most active area in the photograph, and a small new pinnacle, Proto-pinnacle 2, is seen near this area. Labels in all capital letters indicate structures or de pos its, and labels in all low er case indicate relative amounts of water vapor and ash in emitted plumes. Courtesy of OVDAS-SERNAGEOMIN; photo and interpretation by Jorge Muñoz. |
Following the events of September, no major outstanding activity was reported through the rest of 2009. In late January 2010, two new telemetered seismic stations were added to the monitoring network, increasing the number of seismic stations around Chaitén to ten. A new observation camera was also installed ~ 800 m from the dome complex.
During the end of 2009 and January 2010, the growth rate of the dome complex slowed, and seismicity declined significantly, with larger earthquakes (stronger than M 3.5) being absent through at least March (figure 29). Following a few months of relatively calmer activity at Chaitén, and after at least a month without emissions of ash, the Alert Level was lowered to Yellow on 1 May 2010.
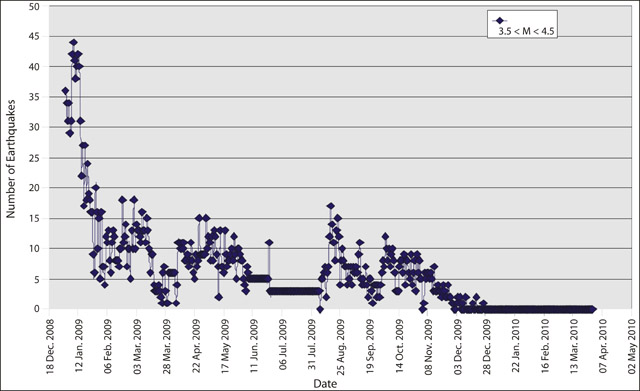 |
Figure 29. Daily earthquakes between M 3.5 and M 4.5 at Chaitén, from the onset of the eruption on 2 May 2008 to 1 April 2010 (a month prior to the lowering of the Alert Level to Yellow). Courtesy of OVDAS-SERNAGEOMIN. |
1 May 2010-2 May 2011 (Yellow Alert). During the period of Yellow Alert, reported plume heights remained below 2.1 km altitude (Buenos Aires VAAC); compared to the prior, more active period when plumes regularly reached 3-4 km in height, this was a significant decline. Over this period, the Buenos Aires VAAC reported occasional emissions that included ash (table 2). OVDAS-SERNAGEOMIN began recording mainly VT events (interpreted as relating to rock fracturing) and long period (LP) events (interpreted as related to fluid dynamics in and beneath the volcanic edifice). Both types of seismicity remained low throughout the remainder of 2010 and into 2011. However, incandescence of the lava dome surface was observed at night in late January 2011.
Table 2. Emissions from Chaitén's lava dome complex during the period of Yellow Alert (1 May 2010-2 May 2011); '--' indicates information that was not reported. Courtesy of the Buenos Aires VAAC.
| Date | Altitude | Drift distance | Drift direction |
| 14 May 2010 | 1.8 km | -- | NE |
| 24 Jul 2010 | -- | 70 km | SSE |
| 30 Jul 2010 | -- | 20 km | NNE |
| 30 Jul 2010 | -- | 45 km | ESE |
| 21 Oct 2010 | 2.1 km | -- | ENE |
| 04 Nov 2010 | 1.8 km | 25 km | NE |
| 13 Nov 2010 | 1.5 km | 40 km | SE |
| 15 Nov 2010 | 1.8-2.1 km | -- | E |
3 May 2011-September 2011 (Green Alert). On 2 May 2011, the Alert Level was lowered to Green due to lower levels of activity since January 2011, including (1) seismicity remaining at low levels of occurrence and magnitude; (2) no significant emissions of ash; (3) a lack of dome growth and associated partial collapses; and (4) a lack of visual observations suggesting restlessness.
Since 3 May 2011, ash-free plumes rose no higher than 0.5 km; the exception was one plume in late May or early June. Seismicity remained low, with daily counts averaging fewer than 2 for LP events, less than 10 for VT events, and less than 1 for HB events.
Magma ascent prior to 2 May 2008 eruption. Wicks and others (2011) stated that "Because of the historically rare and explosive nature of rhyolite eruptions and because of the surprisingly short warning before the eruption of the Chaitén volcano, any information about the workings of the magmatic system at Chaitén, and rhyolitic systems in general, is important from both the scientific and hazard perspectives." There were only about 24 hours between the first felt seismicity in the town of Chaitén and the onset of the eruption. Such a short precursory period has been recorded for basaltic eruptions (e.g. Hekla volcano, Iceland; Soosalu and Einarsson, 2002), but not for silicic eruptions such as Chaitén (Castro and Dingwell, 2009).
Castro and Dingwell (2009) used petrological experiments to constrain the temperatures and decompression rates of the magma erupted explosively at Chaitén on 2 May 2008. Their results suggested that the magma rose from depths of at least 5 km in about four hours, shorter than the roughly 1-day period of seismicity that was felt in the town of Chaitén.
Wicks and others (2011) interpreted radar interferometry observations to indicate that the rapid ascent (as reported by Castro and Dingwell, 2009) of the Chaitén magma was controlled by pre-existing faults in the crust beneath Chile (figure 30). Specifically, they modeled a large, dipping, sill-like body (their "reservoir") residing under Minchinmávida volcano (~ 20 km E of Chaitén, "M" on figure 30) and rising towards the surface to the W of Chaitén (Morro Vilcún, "MV" on figure 30). The magma followed a path that intersected an inferred vertical conduit feeding Chaitén. They interpreted the rhyolitic reservoir as originating from either 1) a combination of tectonic stresses and magmatic overpressure draining rhyolitic magma from a mafic reservoir beneath Minchinmávida, or 2) an event similar to the M 9.5, 1960 Chilean earthquake creating permeability and a pressure gradient, allowing the overpressured magma to migrate to beneath Chaitén.
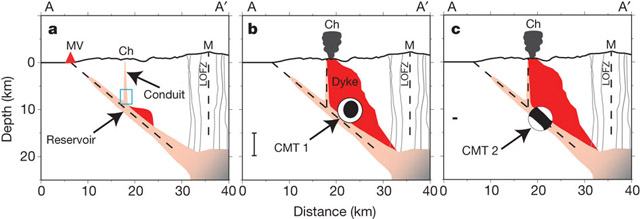 |
Figure 30. Cross-sectional model of the magmatic system that ultimately erupted at Chaitén (Wicks and others, 2011). The profile A-A' is approximately W-E; Morro Vilcún (MV), Chaitén (Ch), and Minchinmávida (M) are plotted at their relative positions on the surface. Stages a, b, and c are illustrated by a series of model cartoons. (a) The sill-like body (Reservoir) extends to the W, towards the surface, from the magma chamber beneath Minchinmávida; the dike (red body) begins propagation upwards, but at this stage has not intersected Chaitén's conduit. (b) Diking leads to an injection-caused earthquake (inflational, shown by the moment tensor solution "beachball diagram" where black indicates compression and white indicates tension) which occurred 2 hours before the 2 May 2008 eruption began. (c) As the eruption progressed and drained the shallow storage beneath Chaitén, the sill-like reservoir collapsed (shown by the moment tensor solution diagram). In all frames, the Liquiñe-Ofqui Fault Zone (LOFZ) is indicated beneath Minchinmávida volcano. CMT 1 refers to the centroid mean solution (CMT) of a moment magnitude 5.2 earthquake that occurred 2 hours prior to the main eruption on 2 May 2008. CMT 2 refers to an earthquake of magnitude 5.0 that occurred 19 hours after the onset of eruption. From Wicks and others (2011). |
Restoring the town and damaged infrastructure. On 9 April 2011, the Chilean government reported that President Sebastián Piñera had announced the "North Chaitén Solution" plan. After restoring basic services (e.g. electricity) to the town of Chaitén in the first months of 2011, President Piñera stated that "everything will be definitively restored, electricity and light has already returned and ... all of the electricity poles are new." He also announced plans to dredge the harbor a second time (necessary due to the amount of remobilized volcanic material deposited in the bay) to allow boats to dock, a plan to install a floating dock, ongoing surveying for new paved roads to other surrounding cities, and plans for the town's school and aerodome.
References. Castro, J.M., and Dingwell, D.B., 2009, Rapid ascent of rhyolitic magma at Chaitén volcano, Chile: Nature, v. 461, p. 780-784 (DOI:10.1038/nature08458).
Soosalu, H., and Einarsson, P., 2002, Earthquake activity related to the 1991 eruption of the Hekla volcano, Iceland: Bulletin of Volcanology, v. 63, p. 536-544.
Wicks, C., de la Llera, J.C., Lara., L.E., and Lowenstern, J., 2011, The role of dyking and fault control in the rapid onset of eruption at Chaitén volcano, Chile, Nature, v. 478, pp. 374-377 (DOI:10.1038/nature10541).
Geological Summary. Chaitén is a small caldera (~3 km in diameter) located 10 km NE of the town of Chaitén on the Gulf of Corcovado. Multiple explosive eruptions throughout the Holocene have been identified. A rhyolitic obsidian lava dome occupies much of the caldera floor. Obsidian cobbles from this dome found in the Blanco River are the source of artifacts from archaeological sites along the Pacific coast as far as 400 km from the volcano to the N and S. The caldera is breached on the SW side by a river that drains to the bay of Chaitén. The first recorded eruption, beginning in 2008, produced major rhyolitic explosive activity and building a new dome and tephra cone on the older rhyolite dome.
Information Contacts: Observatorio Volcanológico de los Andes del Sur-Servico Nacional de Geologia y Mineria (OVDAS-SERNAGEOMIN), Avda Sta María No. 0104, Santiago, Chile (URL: http://www.sernageomin.cl/); Oficina Nacional de Emergencia - Ministerio del Interior (ONEMI), Beaucheff 1637 / 1671, Santiago, Chile (URL: http://www.onemi.cl/); NASA Earth Observatory (URL: http://earthobservatory.nasa.gov/); MapsOf.net (URL: http://mapsof.net/); Marc Bernstien, Eliza Calder, and Patrick Whelley, University at Buffalo, State University of New York, 411 Cooke Hall, Buffalo, NY 14260; Andrés Paves, University of Chile, 2002 Blanco Encalada, Santiago, Chile; Buenos Aires Volcanic Ash Advisory Center (VAAC), Servicio Meteorológico Nacional-Fuerza Aérea Argentina, 25 de mayo 658, Buenos Aires, Argentina (URL: http://www.smn.gov.ar/vaac/buenosaires/productos.php); Javier Romero, Dirección de Vialidad - Ministerio de Obras Públicas, Puerto Montt; Gobierno de Chile, Santiago, Chile (URL: http://www.gob.cl/ or http://www.gob.cl/english/).