Report on Katla (Iceland) — November 2011
Bulletin of the Global Volcanism Network, vol. 36, no. 11 (November 2011)
Managing Editor: Richard Wunderman.
Edited by Robert Dennen.
Katla (Iceland) Jökulhlaup and elevated seismicity in 2011; filming sparks eruption fears
Please cite this report as:
Global Volcanism Program, 2011. Report on Katla (Iceland) (Dennen, R., and Wunderman, R., eds.). Bulletin of the Global Volcanism Network, 36:11. Smithsonian Institution. https://doi.org/10.5479/si.GVP.BGVN201111-372030
Katla
Iceland
63.633°N, 19.083°W; summit elev. 1490 m
All times are local (unless otherwise noted)
Microseismicity preceded and accompanied a jökulhlaup (a glacier-outburst flood) on 9 July 2011, as reported by the Iceland Met Office (IMO). The jökulhlaup escaped from under Mýrdalsjökull, the glacier that rests above Iceland's Katla volcano, its 10 x 14 km caldera, and environs (figure 4). IMO reported that microseismicity was registered near several ice cauldrons in the caldera for a few weeks prior to the event (figure 5). Peak harmonic tremor on 8 July coincided with rising water levels and increased water conductivity, as measured by the main flood gauge (figure 6; gauge is at red triangle on figure 4).
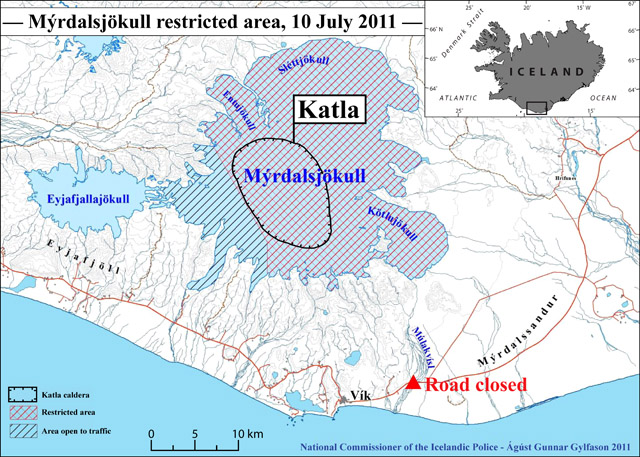 |
Figure 4. A map of road closures and restricted areas of Mýrdalsjökull glacier resulting from the 9 July 2011 jökulhlaup at Katla (see key, lower left). The town of Vík is shown near the bottom (in black), and the main road through the area is shown in red; the trace of Katla caldera is shown in black and labeled. The main flood gauge was on the bridge across the Múlakvísl river; both were destroyed in the jökulhlaup event (red triangle). Inset shows the geographic location of Katla and Mýrdalsjökull in the S of Iceland. Restricted areas map modified from ágúst Gunnar Gylfason of the National Commissioner of the Icelandic Police-Department of Civil Protection and Emergency Management; index map modified from Ginkgo Maps. |
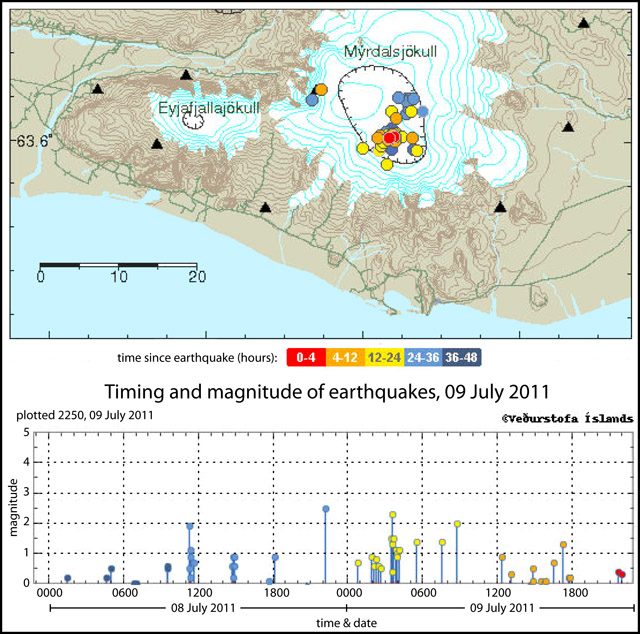 |
Figure 5. Map (top) and plot (bottom) of the seismicity recorded during 8-9 July 2011 at Katla. Colors indicate the timing of epicenters and their respective plotted magnitudes, recorded as late as 2250 on 9 July 2011, according to the scheme shown below the map. Black triangles indicate seismic monitoring stations. Courtesy of Iceland Met Office (IMO). |
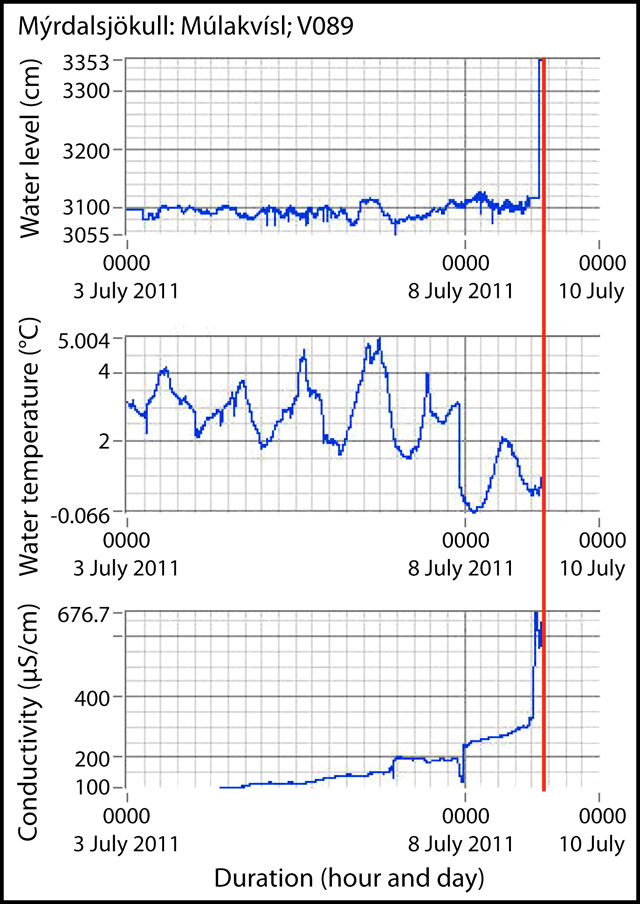 |
Figure 6. Running plots of (a) water level, (b) water temperature, and (c) water conductivity at the main flood gauge of the Múlakvísl river during 3-9 July 2011. The plots show rising water level and conductivity that were coincident with peak harmonic tremor. The plots stop abruptly (red vertical line) when the gauge was destroyed along with the bridge crossing the Múlakvísl river. Courtesy of Iceland Met Office (IMO). |
IMO reported that, on the same day, the main flood gauge was damaged when flood waters reached the instrument near midnight; another station, normally not in the water, started recording rising water around 0400 on 9 July, and the water level there rose 5 m within 5 minutes (figure 7). When the flood reached the main road approximately one hour later, the main bridge over the Múlakvísl river was destroyed and the road was closed (red triangle, figure 41).
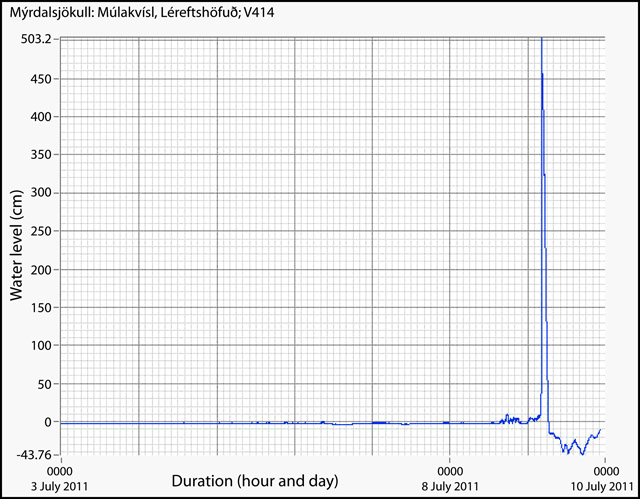 |
Figure 7. A running plot of water level at the second flood gauge (normally not submerged). The plot shows a significant rise in water level (5 m within 5 minutes). Courtesy of Iceland Met Office (IMO). |
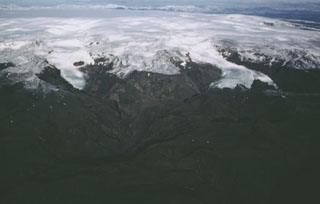
According to the news source Morgunblaðið, 200 people were safely evacuated, and allowed to return to their homes by that afternoon. Morgunblaðið reported that analysis of the flood waters indicated that the flood was caused by geothermal water, but that a sub-glacial eruption at Katla could not be ruled out. IMO stated that the harmonic tremor declined on 9 July, following the jökulhlaup event. After observational flights, new cracks and cauldrons were reported in the ice of Mýrdalsjökull glacier (figure 8).
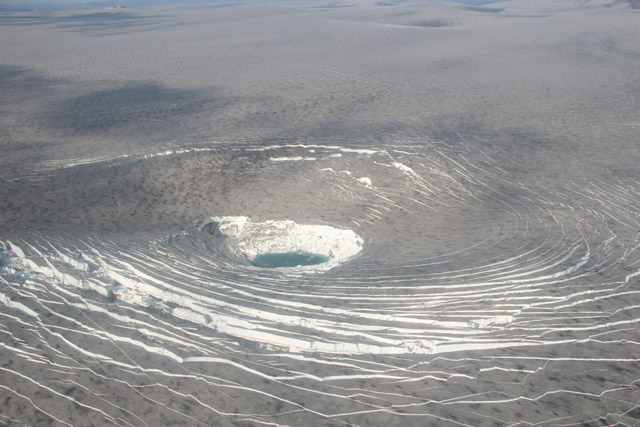 |
Figure 8. Cracking and subsidence of the Mýrdalsjökull glacier around an ice cauldron above the Katla caldera. Widespread gray tephra deposited on the ice surface is due to the 2010 Eyjafjallajökull eruption (BGVN 35:03, 35:04). Courtesy of the Icelandic Coast Guard. |
By 16 July, the National Commissioner of Icelandic Police in the Department of Civil Protection and Emergency Management reported that a new bridge had been built to replace the bridge destroyed in the jökulhlaup (figure 9).
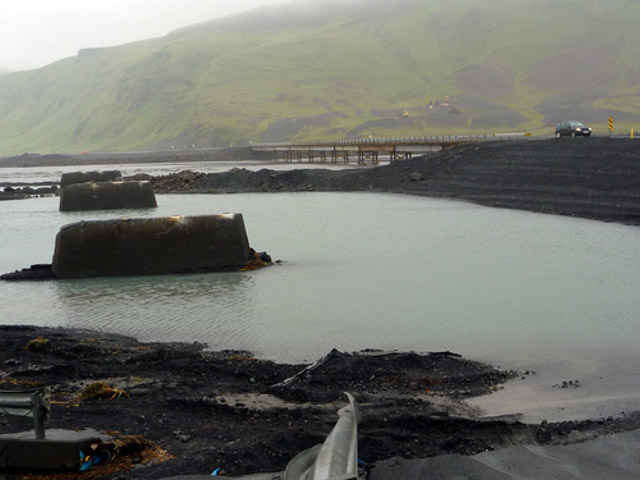 |
Figure 9. Photograph of the remains of the bridge crossing of the Múlakvísl river, destroyed in the jökulhlaup event on 9 July 2011. The new bridge, constructed by the 16 July 2011, can be seen in the background. Courtesy of John A. Stevenson. |
August-December seismicity. IMO reported increased seismicity under Mýrdalsjökull in October (figure 10). They reported that 512 earthquakes occurred, with ~ 380 originating within the Katla caldera; a large portion (nearly 100) of those 512 earthquakes occurred on one day near the beginning of October (figure 11). The largest reported earthquake was M 4, with seven being larger than M 3. On 8 November, an M 3.2 earthquake that originated in the S most part of the caldera was felt by residents in the town of Vík.
Overall, following the July 2011 jökulhlaup event, seismicity has increased above background levels of the past year. The seismic peak is noticeable with respect to the number of earthquakes, their largest magnitudes, and the clustering under Katla (figures 10 and 11). The largest earthquakes were as large, or slightly larger, than the other earthquakes of M 3 or greater in earlier episodes of unrest (i.e., 1999 and 2002-2004, figure 10). The bulk of the 2011 seismic increase occurred over a shallow depth range (within 4 km of the surface, figure 12).
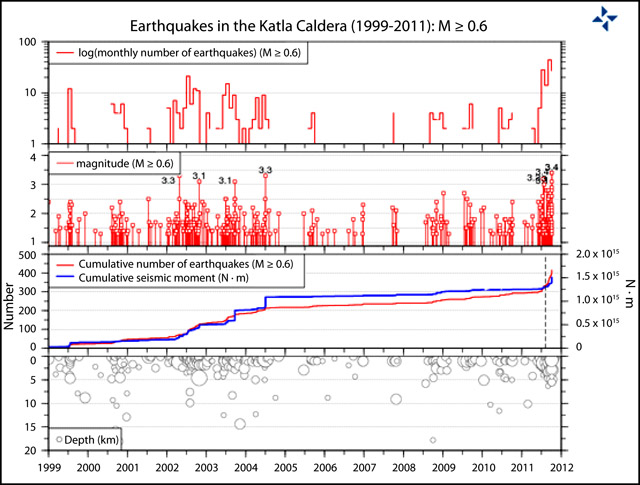 |
Figure 10. Plots of seismicity (greater than M 0.6) at Katla since 1999, showing the October 2011 seismicity in comparison with past episodes of non-eruptive unrest, such as in 1999 (sub-glacial eruption is uncertain in the GVP database) and 2002-2004. Plots (from the top) show: the monthly number of earthquakes (log scale); the magnitudes of earthquakes; cumulative number of earthquakes (red) and cumulative seismic moment (blue); and the focal depths of the located earthquakes. Courtesy of Iceland Met Office (IMO). |
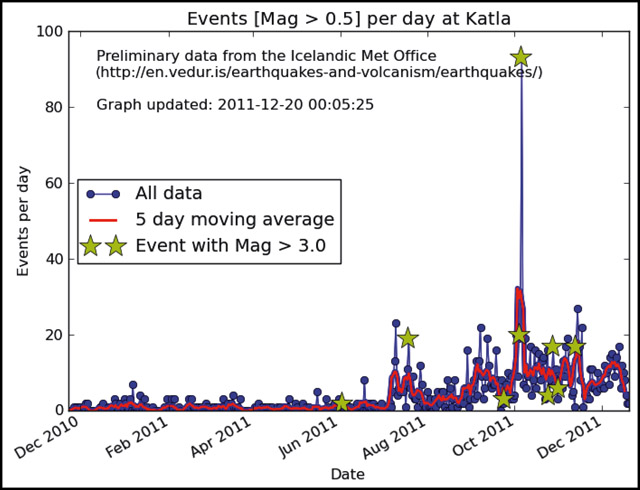 |
Figure 11. Seismic events (stronger than M 0.5) per day at Katla during December 2010-December 2011. Raw data is shown in blue, the 5 day moving average is shown in red, and events stronger than M 3.0 are indicated by gold stars. These trends highlight the increased seismicity of August-December 2011. Courtesy of the University of Edinburgh School of Geosciences. |
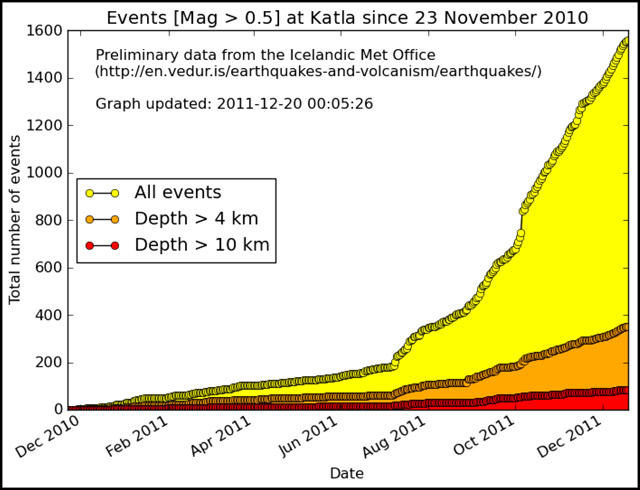 |
Figure 12. Cumulative number of seismic events (stronger than M 0.5) at Katla since 23 November 2010. All events are shown in yellow, and events originating at depths greater than 4 and 10 km are shown in orange and red, respectively. During the August-December 2011 increase in seismicity, the majority of the recorded events originated from shallow depths (less than 4 km). Courtesy of the University of Edinburgh School of Geosciences. |
Television filming sparks eruption fears. The Iceland Review reported that, in the early morning of 9 December, the Icelandic emergency hotline received calls from residents reporting bright lights on the slopes of Mýrdalsjökull. Callers feared that an eruption had started at Katla. The bright lights had also been noticed on a webcam by observers in Norway, who also enquired if there was an eruption. When the glacial slopes were inspected to find the cause of the lights, it was discovered that they were from film crews for the HBO series "Game of Thrones", who were filming in the early morning to capture the desired light conditions.
Geological Summary. Katla volcano, located near the southern end of Iceland's eastern volcanic zone, is hidden beneath the Myrdalsjökull icecap. The subglacial basaltic-to-rhyolitic volcano is one of Iceland's most active and is a frequent producer of damaging jökulhlaups, or glacier-outburst floods. A large 10 x 14 km subglacial caldera with a long axis in a NW-SE direction is up to 750 m deep. Its high point reaches 1380 m, and three major outlet glaciers have breached its rim. Although most recorded eruptions have taken place from fissures inside the caldera, the Eldgjá fissure system, which extends about 60 km to the NE from the current ice margin towards Grímsvötn volcano, has been the source of major Holocene eruptions. An eruption from the Eldgjá fissure system about 934 CE produced a voluminous lava flow of about 18 km3, one of the world's largest known Holocene lava flows. Katla has been the source of frequent subglacial basaltic explosive eruptions that have been among the largest tephra-producers in Iceland during historical time and has also produced numerous dacitic explosive eruptions during the Holocene.
Information Contacts: Einar Kjartansson, Iceland Met Office (IMO), Bústaðavegi 9, 150 Reykjavík, Iceland (URL: http://en.vedur.is/); National Commissioner of the Icelandic Police-Department of Civil Protection and Emergency Management, Skúlagata 21, 101 Reykjavík, Iceland (URL: http://www.almannavarnir.is/); Ginkgo Maps (URL: http://ginkgomaps.com/); Morgunblaðið, Hádegismóum 2, 110 Reykjavík, Iceland (URL: http://mbl.is/); Icelandic Coast Guard, Skógarhlíð 14, 105 Reykjavík, Iceland (URL: http://www.lhg.is/); John A. Stevenson (URL: http://all-geo.org/volcan01010/); The University of Edinburgh School of Geosciences (URL: http://www.ed.ac.uk/schools-departments/geosciences); The Iceland Review, Borgartúni 23, 105 Reykjavík, Iceland (URL: http://www.icelandreview.com/).