Report on Mauna Loa (United States) — May 2012
Bulletin of the Global Volcanism Network, vol. 37, no. 5 (May 2012)
Managing Editor: Richard Wunderman.
Edited by Robert Dennen.
Mauna Loa (United States) 2004-2010 deformation trends; intrusive bodies modeled
Please cite this report as:
Global Volcanism Program, 2012. Report on Mauna Loa (United States) (Dennen, R., and Wunderman, R., eds.). Bulletin of the Global Volcanism Network, 37:5. Smithsonian Institution. https://doi.org/10.5479/si.GVP.BGVN201205-332020
Mauna Loa
United States
19.475°N, 155.608°W; summit elev. 4170 m
All times are local (unless otherwise noted)
Mauna Loa has remained non-eruptive since April 1984. We previously reported on an April-October 2004, deep, long-period (LP) earthquake swarm and associated brief period of contraction (BGVN 29:09). After that and through 2010, deformation continued at variable rates and with brief pauses. During 2004-2010, HVO reported little variation in gas emissions at Mauna Loa.
The material in this report is drawn from monitoring data collected by the USGS Hawaiian Volcano Observatory (HVO) and, in particular, Interferometric Synthetic Aperture Radar (InSAR) data provided by HVO's Mike Poland. A subsection below discusses the use of deformation data as a basis for modeling inferred magma bodies in the subsurface at Mauna Loa (Amelung and others, 2007).
Slowed edifice inflation. Increased rates of inflation following the April-October 2004 deep LP earthquake swarm continued through 2007, when HVO reported that GPS and InSAR-based inflation rates had slowed substantially. Comparison of radar interferograms covering two intervals (11 October 2003-19 November 2005 and 24 March 2007-17 April 2010) highlights the slowed deformation rates during the latter interval (figure 24). To better understand the technique used to observe the slowed rate of deformation at Mauna Loa, see the next section.
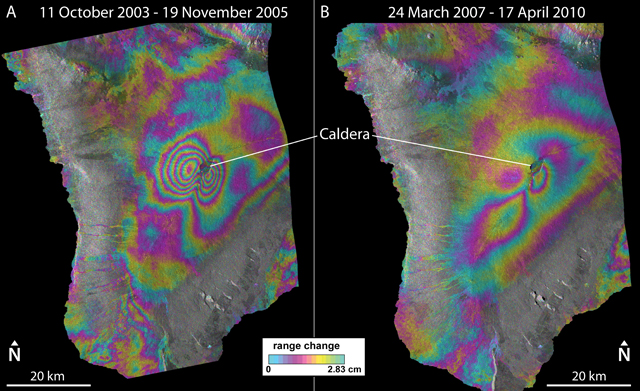 |
Figure 24. Radar interferograms of Mauna Loa covering the time intervals of (a) 11 October 2003-19 November 2005 and (b) 24 March 2007-17 April 2010. These interferograms highlight the slowing of inflation during the latter interval. The large number of color bands ('fringes') in (a) indicates an increased rate of inflation compared to the fewer number of fringes in (b). As depicted in the scale bar (bottom center), concentric and cyclical sets of fringes indicate a ground movement of 2.83 cm towards the satellite's line-of-sight during the time interval shown in each image. The images were produced from data acquired by the European Space Agency's Environmental Satellite (ENVISAT), with an incidence angle of 25° from the ground, looking W to E. Courtesy of Michael Poland, USGS-HVO. |
InSAR technique to monitor deformation. A technique has emerged that enables scientists to create an image of where and how much displacement occurred over a ground or glacial (ice) surface (e.g., Rosen and others, 2000). The technique's spatial coverage is variable from hundreds of square meters to hundreds of square kilometers. Measurements of the component of deformation along the instrument's line-of-sight typically have centimeter-scale precision. While the precision may be less than some other deformation techniques (i.e., GPS monitoring or tilt measurements), the broad coverage can pinpoint particularly interesting patterns and help define areas for collateral studies, including further modeling of the causes of deformation (see next section).
The image, which is called a radar interferogram, compares two separate 'snapshots' acquired at distinct points in time. The snapshots are radar images of the topography of the ground surface in the area of interest (figure 25) acquired by an instrument mounted on an airplane or satellite. The images are generated by transmitting radar waves to the earth's surface; the radar waves then reflect (backscatter) and are measured upon their return to the instrument. To make one interferogram, two such images taken at different times are compared. Variations in the phase of the coherent radar signal in the two snapshots disclose areas where displacement occurred along the instrument's line-of-sight (example radar waves A-E, figure 25). In some cases scientists collect and process enough data to enable them to make a time series of interferograms, for example, annual interferograms that enable yearly comparisons of the ground surface over a decade of time.
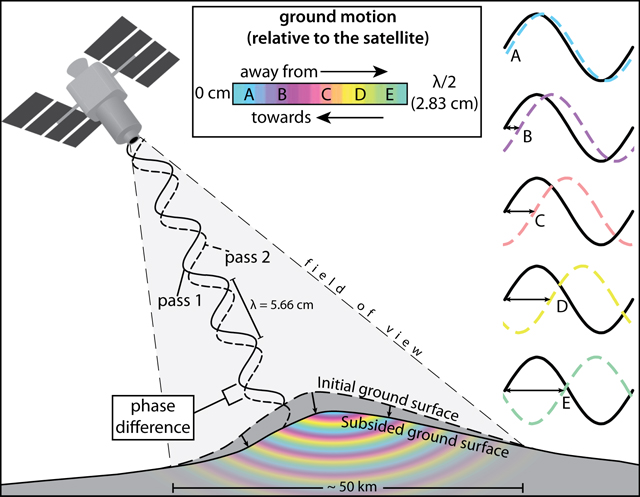 |
Figure 25. A cartoon representation of the basic principles of radar interferometry. As the satellite makes its first pass over a ground surface ('Initial ground surface'), it collects radar waves reflected off of the ground surface (solid wave, 'pass 1'). During a subsequent orbit (often months to years later), when the satellite again passes over the same ground surface, another collection is made from very nearly the same orbital location (dashed wave, 'pass 2'). If the ground surface deformed during the time between data collections (e.g., 'Subsided ground surface'), then the collected radar waves of the second pass will be out of phase compared to those collected during the first pass (example waves A-E, at right). The phase difference of the waves is then converted into the component of ground motion along the line-of-sight of the satellite (either towards or away from the satellite), and is represented by a color as part of a full color cycle. Since the technique is based on the phase difference of multiple waves, the accuracy is constrained by detectable fractions of the radar wave's wavelength. In figure 24, C-band radar (wavelength = 5.6 cm) was used. Image not drawn to scale. Image created by GVP staff. |
On the interferograms, interference patterns appear as full color cycles, or 'fringes', indicating how far out of phase the radar waves are when they return to the satellite (figure 25); one fringe indicates a line-of-sight ground offset equivalent to one half of the radar waves' wavelength. An increased number of fringes at a specific area within an image thus indicates increased deformation during the time between images, allowing estimation of deformation rates over the time period analyzed. Our discussion of this technique has omitted various assumptions, sources of error, and corrections used to process and interpret the data.
Magma chamber and dike modeling. Amelung and others (2007) assessed measured ground deformation at Mauna Loa from InSAR data. They modeled the size, location, and geometry of inferred intrusive bodies beneath Mauna Loa that led to the observed surface deformation. Their modeling suggested a spherical magma chamber of 1.1 km radius, centered under the SE caldera margin at 4.7 km depth below the summit (0.5 km below sea level), and a vertical dike with most of its inflation occurring along an 8-km-long zone at depths of 4-8 km (Figure 26). The dike's direction of opening was normal to its inferred planar orientation. An HVO model, fit to ground-based GPS measurements, agrees with the model of Amelung and others (2007).
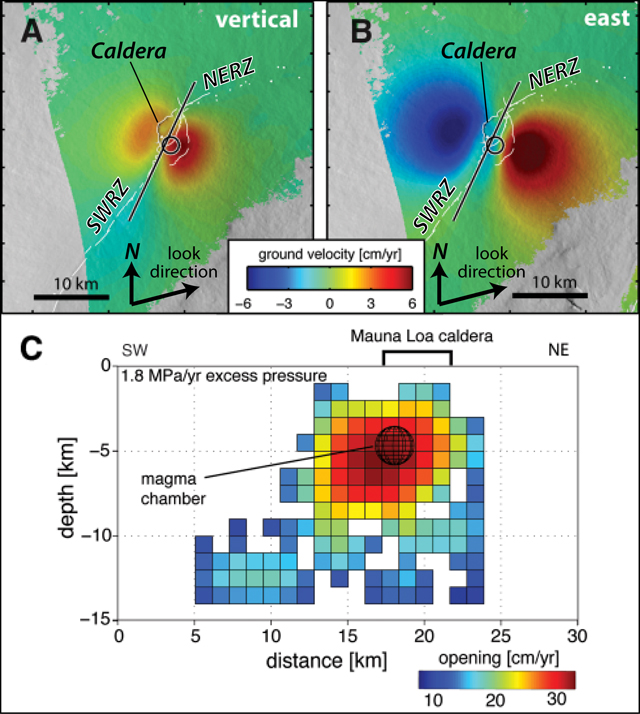 |
Figure 26. (a) Vertical and (b) East components of ground-velocity measured at Mauna Loa during 2002-2005, determined from RADARSAT-1 InSAR data, and (c) the resultant model of the subsurface along a vertical cross-section oriented NE-SW. The satellite looked towards the E ('look direction') and had an incidence angle of ~45° from the ground. The white lines indicate the NE and SW rift zones (NERZ and SWRZ, respectively) that branch off of the caldera. The black line and circle in (a) and (b) indicate the map location of the modeled dike and magma chamber, respectively, also shown in cross-section view in (c). The location and span of Mauna Loa's summit caldera is indicated at the top of (c). The modeled spherical magma chamber and dike beneath the summit are shown in (c), indicating modeled opening rates of the dike (shown by the colored squares, with scale at bottom right). The dike opening rates are based on a uniform excess-magma pressure model of 1.8 Mpa/year, and are modeled to fit the measured ground-velocities shown in (a) and (b). Modified from Amelung and others (2007). |
References. Amelung, F., Yun, S.H., Walter, T.R., Segall, P., and Kim, S.W. (2007) Stress Control of Deep Rift Intrusion at Mauna Loa Volcano, Hawaii. Science, 316 (5827), pg. 1026-1030 (DOI: 10.1126/science.1140035).
Rosen, P.A., Hensley, S., Joughin, I.R., Li, F.K., Madsen, S.N., Rodriguez, E., and Goldstein, R.M. (2000) Synthetic aperture radar interferometry, Proc. IEEE, 88, 333- 382.
Geological Summary. Massive Mauna Loa is a basaltic shield volcano that rises almost 9 km from the ocean floor to form the world's largest Holocene volcano. Flank eruptions typically occur from the lengthy NE and SW rift zones, and from the Moku'aweoweo summit is caldera, which is within an older and larger 6 x 8 km caldera. Two of the youngest large debris avalanches documented in Hawaii traveled nearly 100 km from Mauna Loa; the second of the Alika avalanches was emplaced about 105,000 years ago (Moore et al., 1989). Almost 90% of the surface of the volcano is covered by lavas less than 4,000 years old (Lockwood and Lipman, 1987). Beginning about 1,500 years ago, a series of voluminous overflows from a summit lava lake covered about 25% of the volcano's surface. Over the last 750 years, from shortly after the formation of Moku'aweoweo caldera until the present, an additional 25% of the volcano has been covered with lava flows, mainly from summit and NW rift zone vents.
Information Contacts: Michael Poland, Hawaiian Volcano Observatory (HVO), U.S. Geological Survey, PO Box 51, Hawai'i National Park, HI 96718, USA (URL: https://volcanoes.usgs.gov/observatories/hvo/); Christelle Wauthier, Department of Terrestrial Magnetism, Carnegie Institute of Washington, Washington, DC.