Report on Purace (Colombia) — September 2012
Bulletin of the Global Volcanism Network, vol. 37, no. 9 (September 2012)
Managing Editor: Richard Wunderman.
Edited by Julie A. Herrick.
Purace (Colombia) Expanded monitoring efforts and persistent seismicity in 2012
Please cite this report as:
Global Volcanism Program, 2012. Report on Purace (Colombia) (Herrick, J.A., and Wunderman, R., eds.). Bulletin of the Global Volcanism Network, 37:9. Smithsonian Institution. https://doi.org/10.5479/si.GVP.BGVN201209-351060
Purace
Colombia
2.3095°N, 76.3948°W; summit elev. 4650 m
All times are local (unless otherwise noted)
Our previous report on Puracé (BGVN 25:05) described elevated seismicity and swarms from February through April 2000. The Popayán Observatory, part of the Instituto Colombiano de Geología y Minería (INGEOMINAS), released geochemical, geophysical, and visual observations of the volcano since our last report. Here we present the results from their field investigations focused on fumarolic sites, hot springs, and SO2 emissions. Low levels of seismicity persisted at Puracé during January-April 2008 and January 2010-August 2012, but tornillo and tremor events were frequently detected; elevated seismicity was detected in March 2012. Available maps include those for volcanic hazards, monitoring networks, and geomorphology. From January 2008-August 2012, the Alert Level for Puracé has remained at VI (Green; "volcanic behavior is in a typical background, noneruptive state"), the lowest level on a VI-I scale.
Hazard map for the Puracé region. A hazard map has been developed by INGEOMINAS for the Puracé region (figure 2). Three zones encompass the entire volcanic chain and one of the zones (delineating potential ashfall) reaches the town of Popayán (28 km NW).
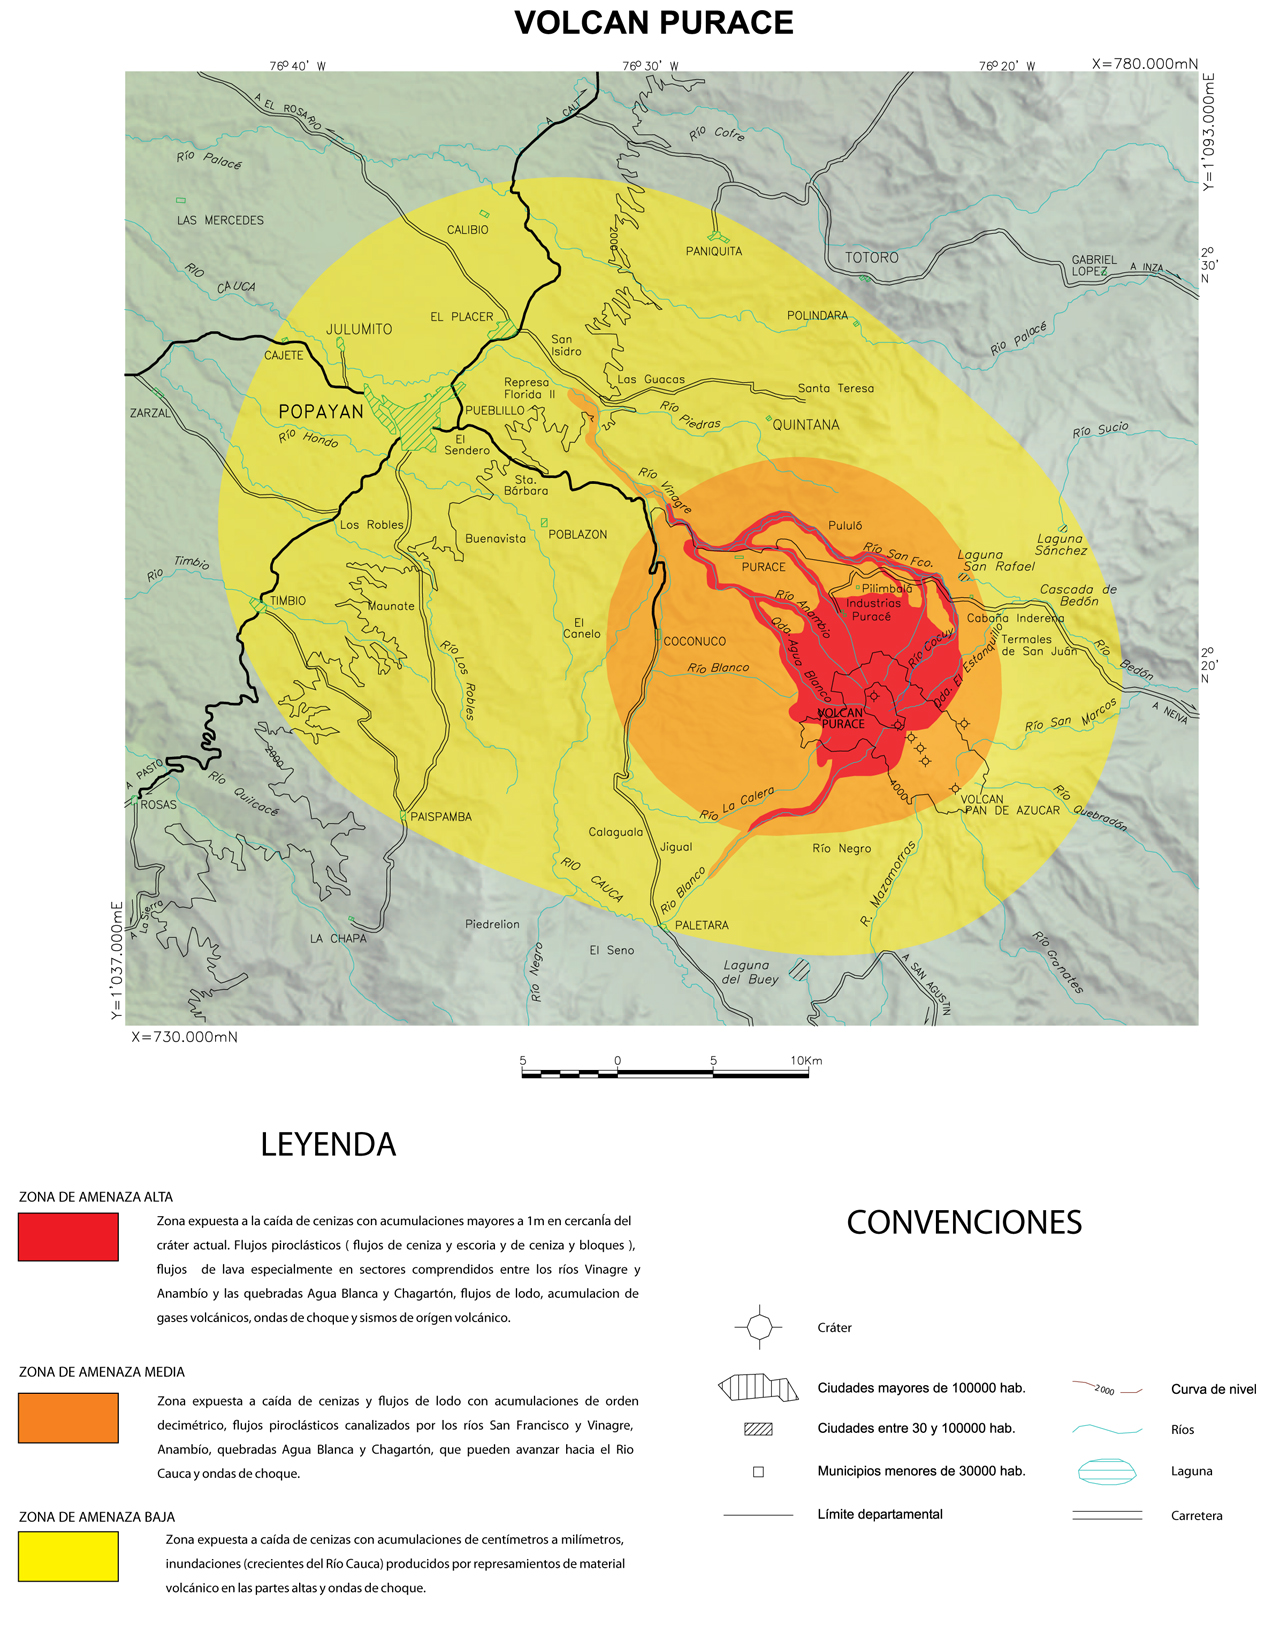 |
Figure 2. This hazard map delineates three zones around Puracé volcano (see text). The highest risk area (red) includes the volcanic centers Puracé and Curiquinga and also follows major drainages N and S. The moderate risk area (orange) includes most of the Coconucos volcanic chain and extends NW to include the town of Puracé. The lowest risk area (yellow) extends NW (including Popayán) and as far S as the town of Paletará. Courtesy of INGEOMINAS. |
The red zone (highest risk area) indicates areas where lava flows may occur in the future, with inferred events including more than 1 m of ash fall and ballistic ejecta, lahars, volcanic gases, and elevated seismicity. Drainages surrounding the town of Puracé and the sulfur mine (Industrias Puracé) location are within the red zone.
The orange zone (moderate risk) would, in future eruptions, likely experience ashfall on the order of decimeters; pyroclastic flows could reach this region as well as lahars. The towns Coconuco, Puracé, and Pululó are within the orange zone; ~7 km SE of Purace volcano, the peak of Pan de Azúcar is at the boundary between the orange and yellow zones (figure 3).
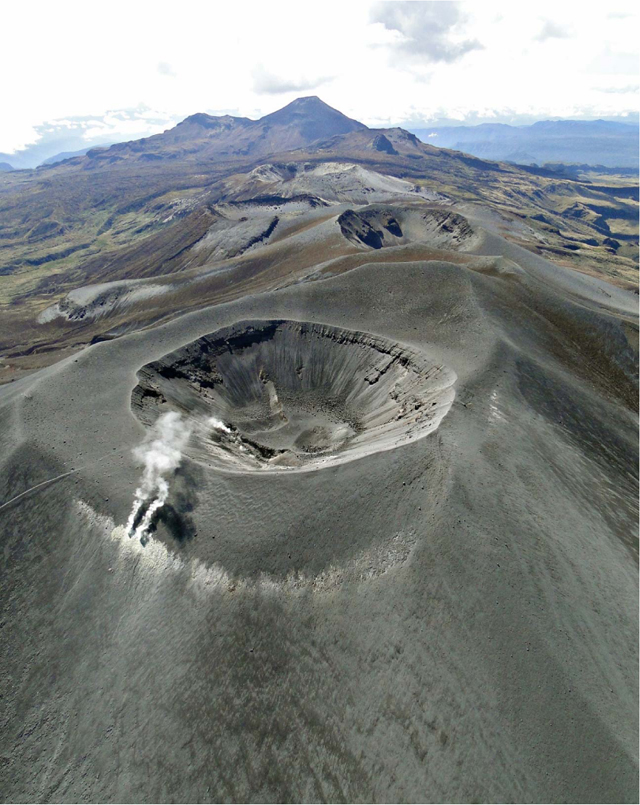 |
Figure 3. An aerial view looking SE along the Coconucos volcanic chain taken on 22 October 2011. Puracé is in the foreground and several craters are aligned in the distance. The tallest peak in the background is Pan de Azúcar. Courtesy of INGEOMINAS. |
The yellow zone (low risk) distinguishes the largest hazard zone and encompasses Paletará, Paispamba, Timbio, Popayán, El Placer, Calibio, Paniquita, Polindara, Quintana, and other towns. This zone may experience centimeters to millimeters of ashfall in future eruptions. Flooding along rivers could also occur within this zone if volcanic material accumulated during an eruption. INGEOMINAS also noted that shock waves from a large eruption could be experienced within all three zones.
Ground deformation monitoring 1999-2012. In 1999, INGEOMINAS monitored deformation with an electronic tilt station located 1.24 km N of the crater (Guañarita station, 4,248 m a.s.l., GUAI). During January-April 2008, significant changes were absent. From January 2010-October 2011, the tiltmeter network was expanded to include two more electronic tiltmeters (figure 4), however, no major trends in ground deformation were noted during that time. INGEOMINAS noted a decreasing trend between October 2011 and April 2012 at the Lavas Rojas station (LAVI, 2.4 km WNW of the summit, 4,046 m a.s.l.). They calculated -90 µrad in total deflation from the N component and -70 µrad from the E component. At the Guañarita station (GUAI), deflation also began in October 2011 and continued through August 2012.
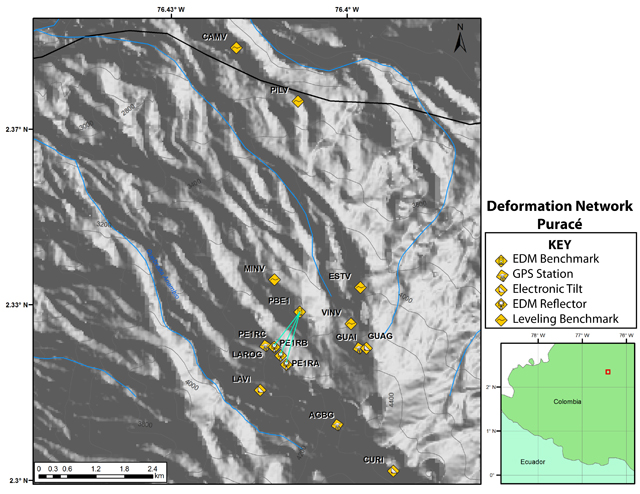 |
Figure 4. The geophysical monitoring network for Puracé volcano in 2012 included electronic tiltmeters, GPS stations, line leveling benchmarks, and an EDM network concentrated NW of the edifice. In the lower-right-hand corner, three craters are visible (Puracé, Curiquinga, and Calambas). Courtesy of INGEOMINAS. |
In August 2011, two permanent Global Positioning System (GPS) stations were installed on the flanks of Puracé located 1.24 km N (Guañarita, GUAG) and 2.48 km NW (Lavas Rojas, LAROG). A third GPS station, Agua Blanca (AGBG), was added to this network in November 2011, located 0.7 km W of the crater. During October 2011, deflation trends were observed with electronic tiltmeters; GPS and electronic distance measurement (EDM) campaigns showed few variations.
A magnetometer was installed near the Puracé edifice in December 2010 and, in January 2011, INGEOMINAS reported successful real-time transmissions to the Popayán Observatory (26 km NE of Puracé). The site location of the new instrument was 1.6 km N of the volcano in an area of andesitic lava flows emplaced during pre-Puracé development that remains undated. INGEOMINAS reported daily fluctuations in the magnetometer data and also identified anomalous solar activity that was confirmed with global datasets. Data sent from this station reported stable conditions persisting from January 2011 through August 2012.
Investigations at other volcanoes globally have shown successful correlations between magnetic fluctuations and magma intrusions, demonstrating the benefits of magnetometers in early warning systems. A basic unit of magnetism in the SI system is the tesla ("T"); this is a measure of magnetic field strength (a variable frequently denoted as B). [1 tesla = 1 weber/m2 = 1 newton/amp-m = 104 gauss = 109 gamma. Also, 1 nanotesla = 1 gamma (Sheriff, 1982)]. Hurst and others (2004) described examples:
"For instance, the basaltic andesite volcano Poas in Costa Rica showed changes of nearly 200 nanoTesla (Rymer and others, 2000), whereas the basaltic Japanese volcano Izu-Oshima showed changes of only tens of nanoTeslas in 1986 (Sasai and others, 1990). The latter case was one of the few in which magnetic changes clearly occurred before the volcanic activity started, a more marginal case was Unzen, where magnetic changes were recorded in the very early stages of an eruption (Tanaka, 1995)."
Geochemical monitoring. Between 1982 and 1993, INGEOMINAS carried out intermittent site visits to the fumaroles and hot springs located near the flanks and summit crater of Puracé (figure 5). Since 1994, they conducted periodic geochemical monitoring to evaluate the variations in fluid compositions from the hot springs and established a baseline of activity and characteristics.
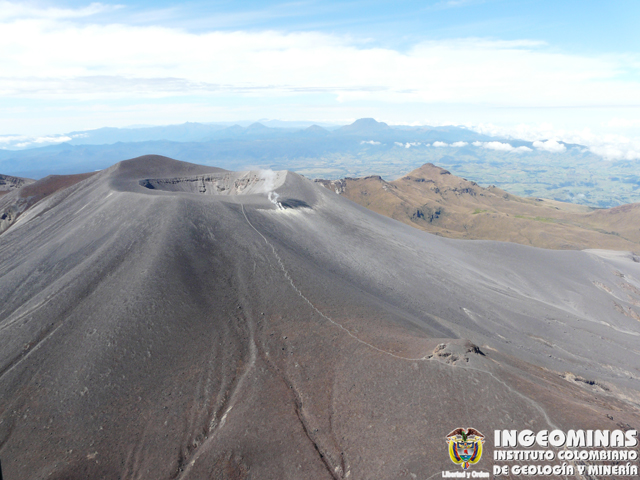 |
Figure 5. Photographed on 22 October 2011, a view of the N flank and crater rim of Puracé. Small, white plumes of gas rise from the fumarolic field located on the outside edge of the crater. The rugged peak of Chagarton, considered a pre-Puracé structure, is in view to the right of Puracé's summit (middle ground). In the background on the horizon is the tall, wide peak of Sotará volcano located ~32 km SW. Courtesy of INGEOMINAS. |
On 16 April 2008, INGEOMINAS visited three sites located along the lower flanks of Puracé to determine radon-222 emissions: Agua Tibío, Tabío, and Agua Hirviendo. Relative to past records, values obtained from the soil at Agua Hirviendo were slightly higher: 2,035 pico Curies per Liter (pCi/L). Tabío and Agua Tibío respectively measured 323 and 790 pCi/L.
On 14 September 2011, INGEOMINAS scientists walked the crater rim to collect differential optical-absorption spectroscopy (DOAS) measurements to determine SO2 flux. The mobile DOAS campaign confirmed the concentration of gas was located within the fumarolic area on the N rim (figure 6). With a wind speed of 5.0 m/s from the W, total flux was 0.5 metric tons per day.
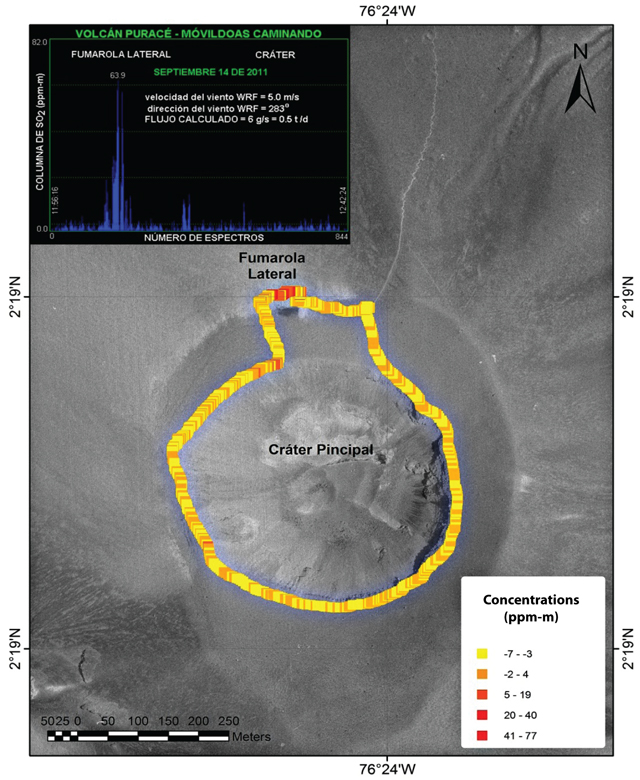 |
Figure 6. The path traversed with a mobile DOAS instrument on 14 September 2011 around the crater rim of Puracé (note color coding). The background photo was taken by Colombia's national mapping agency, IGAC, in 1976. Courtesy of INGEOMINAS. |
A field campaign to detect sulfur dioxide emissions was also conducted on 29 August 2012. Using a mobile Flyspec, a team of INGEOMINAS scientists focused on the Pozo Azul hot spring located ~8 km SW of the crater (also called PAFT in figure 7). This ultraviolet spectrometer sampled continuously for approximately five minutes while the scientists traversed the area around the hot spring (figure 7). There were four locations along the pathway where SO2 concentrations measured greater than 6.6 ppm-m. INGEOMINAS reported the total SO2 flux was 1.1 tons/day (windspeed of 7.7 m/s from the W).
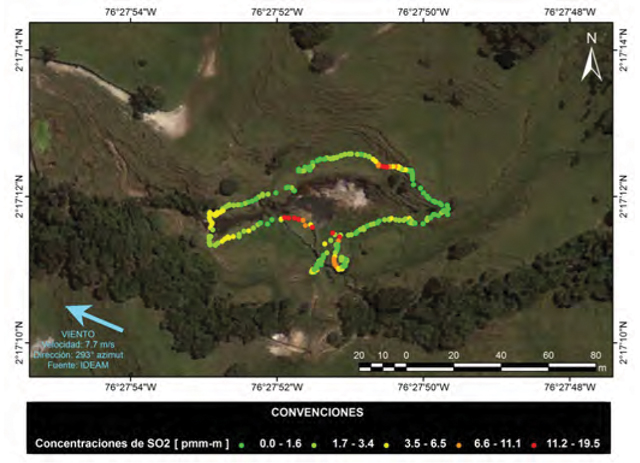 |
Figure 7. INGEOMINAS conducted a Flyspec traverse and calculated sulfur dioxide concentrations for the area around Pozo Azul, located ~8 km SW of Puracé's crater. Courtesy of INGEOMINAS. |
Radon emissions had been monitored by INGEOMINAS from May 2011 through August 2012. Regular measurements were obtained from 13 stations located at sites around the volcanic edifice up to 12 km away (figure 8). Month-to-month variations tended to show rare correlations except for March-April 2012. In their monthly report from April 2012, INGEOMINAS highlighted this time period as significant for both seismic and radon assessments. Volcano-tectonic (VT) seismicity had been notably elevated during that time (an average of 116 earthquakes per month) and events were frequently occurring directly below the edifice. Long-period seismicity was also higher in March and April (an average of 290 earthquakes per month). Tremor, tornillo, and hybrid earthquakes occurred more frequently during these months compared with seismicity from the past two years.
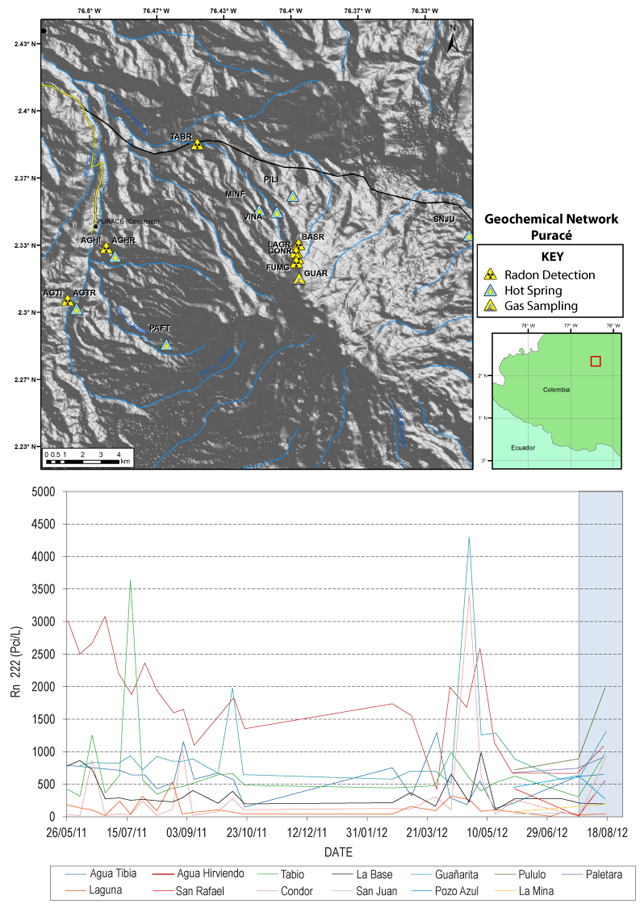 |
Figure 8. The geochemical monitoring network in August 2012 included radon emission detectors, hot spring sampling sites, and gas-sampling sites around the flanks of Puracé. (Top) This map shows the entire length of the Coconucos volcanic chain and sites within the monitoring network. (Bottom) Radon emissions were continuously monitored from 26 May 2011 through 18 August 2012, however, few datapoints were available between 23 October 2011 and February 2012. Courtesy of INGEOMINAS. |
INGEOMINAS reported in their online August 2012 bulletin that field investigations of fumaroles and hot springs detected stable conditions without significant variations in geochemistry or temperatures. Continuous temperature readings from an in situ thermocouple were available from April 2012 to August 2012. This system was installed for monitoring changes in the fumarolic area located on the NW flank of the volcano in September 2011. Due to equipment problems related to equipment corrosion (a common problem in these extreme environments), the data was only successfully telemetered starting on 14 April 2012.
From January 2010 through August 2012, webcameras frequently captured images of the active fumarolic area located on the NW edge of the crater; small white plumes regularly rose from the fumaroles. During an overflight on 22 October 2011, INGEOMINAS observed small plumes of vapor from a crack in the crater floor and the fumarolic field (figure 9).
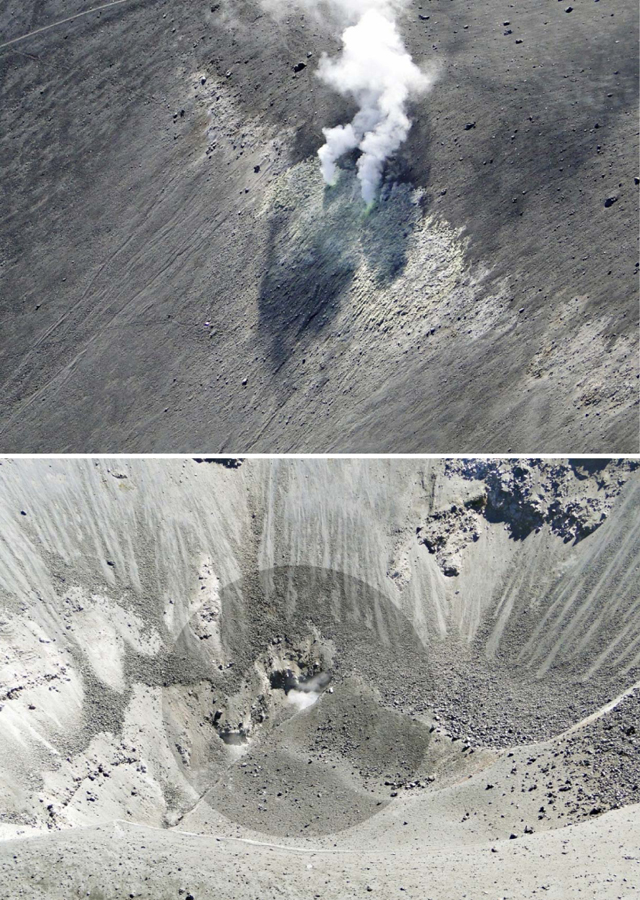 |
Figure 9. Close-up views of vapor plumes observed during an overflight of Puracé on 22 October 2011. (Top) Two adjacent sources of steam merge into a single plume rising from a narrow fumarolic field located on the NW crater rim. Note the bright yellow surfaces where sulfur has precipitated. Past measurements of fumarole temperatures here had reached 128°C. (Bottom) INGEOMINAS noted white vapor rising from a crack within the crater floor. Vapor plumes within the crater were too small to rise above the rim and had not been visible with webcameras. Both features, the fumarolic field outside of the crater and the crack along the crater floor, trend roughly E-W. Courtesy of INGEOMINAS. |
Overview of seismicity. Table 2 summarizes available seismic data for 2008-2012. More discussion appears in chronological subsections below.
Table 2. Seismicity at Puracé volcano during January-April 2008 and from January 2010 through August 2012. Volcano-tectonic (VT), long-period, tornillo, hybrid, and tremor events are reported per month. Depths and magnitudes (local magnitudes, ML) of VT events are mainly reported as ranges of dominant activity, however, many magnitudes are the largest events that occurred per month. Courtesy of INGEOMINAS.
| Month | Volcano-tectonic | VT Depths (km) | VT Magnitude (ML) | Long-period | Tornillo | Hybrid | Tremor |
| Jan 2008 | 246 | 1-20 | -0.89-2.27 | 243 | 13 | 1 | 2 |
| Feb 2008 | 95 | 1-24 | -0.62-2.4 | 113 | 17 | 5 | 0 |
| Mar 2008 | 91 | 1-6 | -0.89-2.27 | 123 | 15 | 1 | 2 |
| Apr 2008 | 51 | 1-4 | -0.4-1.25 | 88 | 15 | 0 | 1 |
| Jan 2010 | 77 | 1-15 | 1.7 | 167 | 0 | 0 | 0 |
| Feb 2010 | 29 | 1-17 | 1.3 | 127 | 0 | 0 | 0 |
| Mar 2010 | 76 | 1-15 | 2.0 | 182 | 30 | 7 | 0 |
| Apr 2010 | 70 | 1-12 | 2.2 | 91 | 61 | 0 | 0 |
| May 2010 | 54 | 1-15 | 2.04 | 85 | 45 | 0 | 0 |
| Jun 2010 | 58 | 0.8-18 | 1.4 | 89 | 21 | 0 | 0 |
| Jul 2010 | 33 | 0.8-2 | 1.14 | 113 | 37 | 0 | 0 |
| Aug 2010 | 13 | 0.8-5 | 1.1 | 83 | 34 | 2 | 0 |
| Sep 2010 | 49 | 5-15 | 1-4.4 | 81 | 28 | 0 | 0 |
| Oct 2010 | 22 | 3-18 | 0.3-1.3 | 122 | 31 | 0 | 0 |
| Nov 2010 | 112 | 1-7.5 | 0.2-2.1 | 157 | 31 | 0 | 0 |
| Dec 2010 | 76 | 0.3-4 | 2.7 | 247 | 9 | 0 | 15 |
| Jan 2011 | 49 | 0.7-4 | 1.8 | 210 | 7 | 0 | 10 |
| Feb 2011 | 34 | 1.2-16 | 1.5 | 177 | 20 | 0 | 3 |
| Mar 2011 | 68 | 1-12 | 1.6 | 152 | 17 | 0 | 3 |
| Apr 2011 | 63 | 1-12 | 1.3 | 137 | 21 | 0 | 1 |
| May 2011 | 45 | 1-15 | 1.7 | 197 | 19 | 0 | 2 |
| Jun 2011 | 31 | 1-15 | 1.7 | 143 | 9 | 0 | 3 |
| Jul 2011 | 26 | 1-13 | 2.4 | 116 | 13 | 0 | 13 |
| Aug 2011 | 32 | 2-3 | 1.8 | 125 | 13 | 0 | 2 |
| Sep 2011 | 15 | 1-2 | 1.5 | 154 | 1 | 0 | 2 |
| Oct 2011 | 25 | 1-15 | 2.1 | 151 | 17 | 2 | 2 |
| Nov 2011 | 25 | 1-4.5 | 1.3 | 125 | 15 | 2 | 2 |
| Dec 2011 | 45 | 1-4.5 | 1.0 | 116 | 28 | 7 | 5 |
| Jan 2012 | 67 | 0.8-5 | 0.1-1.8 | 184 | 54 | 17 | 4 |
| Feb 2012 | 86 | 1-17 | 1.4 | 248 | 20 | 19 | 4 |
| Mar 2012 | 143 | 1-3 | 2.2 | 332 | 46 | 30 | 32 |
| Apr 2012 | 90 | 1-12 | 1.7 | 248 | 67 | 40 | 26 |
| May 2012 | 31 | 1-12 | 1.9 | 219 | 29 | 4 | 8 |
| Jun 2012 | 57 | 1-12 | 1.8 | 190 | 51 | 22 | 11 |
| Jul 2012 | 33 | 1-12 | 1.5 | 181 | 35 | 7 | 2 |
| Aug 2012 | 28 | 1-12 | 2.1 | 165 | 48 | 15 | 11 |
Seismicity during January-April 2008. In January 2008, INGEOMINAS reported increased seismicity within 15 km of the Puracé edifice. There were two regions of activity, along the Moras fault system and within the immediate area of the volcano (figure 10). The Moras fault crosses beneath Puracé and was indicated by earthquake locations to the NE (in the San Rafael lake area) and to the SW (in Paletará Valley) (figure 11). These locations were sites for earthquake swarms in February and April 2000 (BGVN 25:05).
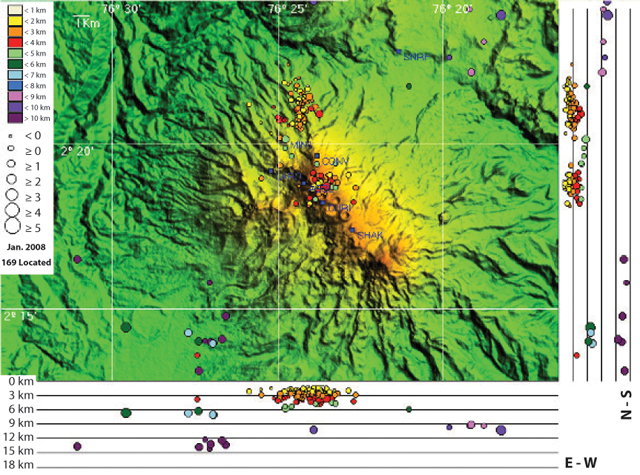 |
Figure 10. A map of epicenters for VT earthquakes located in the region of Puracé in January 2008. A total of 169 events were primarily located beneath the edifice and up to 5 km N in a sulfur mining district. The deepest and most distal earthquakes (to the NE and SW) were attributed to other portions of the Moras fault system, which also cuts through Puracé. Courtesy of INGEOMINAS. |
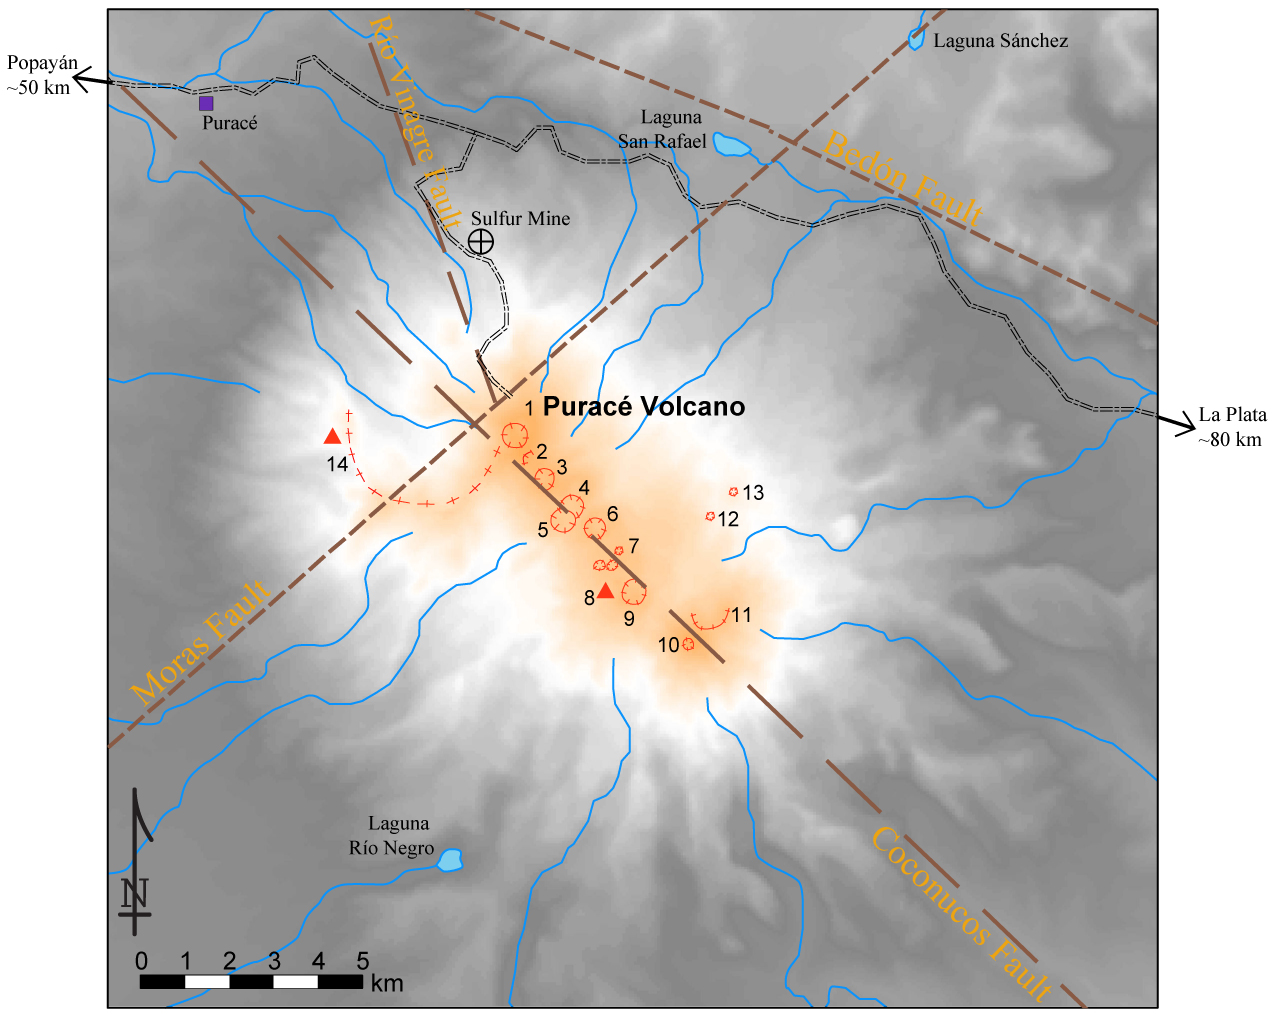 |
Figure 11. Puracé is the most active and northernmost volcano along the NW-SE trending Coconucos ridge. Numbers correspond to cones with craters (red hashed circles) and major peaks (red triangles): 1 Puracé volcano, 2 Piocollo, 3 Curiquinga, 4 Calambas, 5 Paletará, 6 Quintin, 7 Shaka (a cluster of craters with ponded water), 8 Killa, 9 Machangara (contains a small pond), 10 Pan de Azúcar (a prominent peak with a small summit crater), 11 Pukará, 12 Piki, 13 Amancay, 14 Chagartón (a large crater and peak has been attributed to this structure). Major regional faults are short dashed lines (brown); the local Coconucos fault and Río Vinagre fault zones are long-dashed lines (brown). The shaded terrain was derived from a 90 m SRTM (Shuttle Radar Topography Mission) digital elevation model. Highest elevations (greater than 4,000 m) are indicated by orange shading and reach a maximum of ~4,650 m; lowest elevations (gray shading) begin at 2,500 m. This map was compiled by GVP based on INGEOMINAS Popayán reports, maps, and aerial photos. Place names are from Arcila (1996), Cardona (1998), Kelsey (2001), and Monsalve and Pulgarín (1999). |
Another local structure, the 2-3 km wide Río Vinagre fault system, underlies Puracé and trends subparallel with the Coconucos fault. Sturchio and others (1993) described the thermal waters, gases and sulfur deposits from Puracé and concluded that sulfur precipitation was likely resulting from hot magmatic gas ascending through the Río Vinagre fault zone. The hot springs were attributed to descending meteoric water interacting with the magmatic system.
A total of 508 events were detected in January 2008, primarily volcano-tectonic (VT) and long-period (LP) earthquakes, 249 and 243 events respectively (table 2). Tornillo (13 in total), hybrid (1 identified), and tremor (2 events identified) were also detected that month. Magnitudes of VTs were in the range of -0.89 to 2.27 and magnitudes of LPs in the range of 0.09 to 1.59. Focal depths tended to be shallow for those events occurring beneath the edifice (1-6 km) and deeper elsewhere along the fault system (6-20 km).
From February through April 2008, INGEOMINAS reported that seismicity from Puracé was relatively low (table 2). Approximately 210 earthquakes were detected each month, primarily LP and VT earthquakes. Tornillo events were detected throughout this time period averaging ~15 per month. Few hybrid events were detected in February and March (1-5 events), and tremor was detected in March and April (1-2 events). Earthquake magnitudes were largest in February (up to ML 2.4 for VT and LP earthquakes) and depths of earthquake foci were characteristically shallow for those events beneath the volcanic edifice (1-7 km). In February, earthquakes (6-17 km deep) were detected within the Moras fault zone with events in a similar distribution to those located in January 2008 (figure 10).
Episode of seismicity in December 2008.On 13 December 2008, INGEOMINAS released a special report announcing a short period of elevated seismicity. Beginning on 12 December, 625 LP earthquakes were detected over 29 hours. These events were low-magnitude (M 0.5-1) and clustered within the sulfur mine area ~2.8 km N. While these earthquakes were very shallow (
Seismicity during January 2010-August 2012. In 2010 and 2011, seismicity detected at Puracé was generally relatively low (table 2). Magnitudes of VT events during 2010 rarely exceeded 2.0 and earthquake foci were rarely deeper than 15 km. Earthquakes deeper than 10 km were typically beyond the edifice and related to the local fault systems. LP events occurred more frequently than VT events; INGEOMINAS reported that 81-247 LP events were detected per month and 13-112 VT events per month. Up to 61 tornillo earthquakes were detected in April 2010, however, no tornillos were recorded in January and February and only nine were recorded in December. Hybrid and tremor events were also rare; several months passed without detecting these events. In March and August, hybrid earthquakes were detected, and tremor was only reported in December.
Seismicity remained low throughout 2011, however, tremor (1-13 events per month) and tornillo earthquakes (1-28 events per month) were detected every month. Hybrid earthquakes were only reported from October through December 2011. VT and LP events persisted, but at a lower rate compared with the previous year; magnitudes and depths were also in the same range.
From January through August 2012, seismicity was consistently higher than the previous eight months. VT and LP events were more numerous, at rates of 28-143 per month and 165-332 per month, respectively. Magnitudes and depths of earthquakes remained within similar ranges as previously recorded. Tremor and hybrid earthquakes were detected every month.
INGEOMINAS emphasized that seismicity was particularly high in March 2012, with more VT and LP events that month than in any month in the past two years. Numerous tornillo, hybrid, and tremor events were also reported (table 2). Seismicity was still comparatively elevated but less so in the five months that followed March 2012.
References. Arcila, M., 1996. Geophysical monitoring of the Puracé volcano, Colombia, Annali di Geofisica, vol. XXXIX, N. 2, pp. 265-272.
Cardona, C.E., 1998. Caracterización de fuentes sísmicas en el volcán Puracé, Geology thesis, Universidad de Caldas.
Hurst, A.W., Rickerby, P.C., Scott, B.J., and Hashimoto, T., 2004. Magnetic field changes on White Island, New Zealand, and the value of magnetic changes for eruption forecasting, Journal of Volcanology and Geothermal Research, 136, pp. 53-70.
Kelsey, M.R., 2001. Climber's and Hiker's Guide to the World's Mountains & Volcanoes, Kelsey Publishing, Provo, UT, 4th ed., p. 1248.
Monsalve, M.L. and Pulgarín, B., 1999. Cadena Volcánica de los Coconucos (Colombia): Centros eruptivos y producto recientes, Boletín Geológico, 37 (1-3): 17-51.
Sheriff, R.E., 1982. Encyclopedic Dictionary of Exploration Geophysics, Society of Exploration Geophysicists, Tulsa, OK, p. 266.
Sturchio, N.C., Williams, S.N., and Sano, Y., 1993. The hydrothermal system of Volcan Puracé, Colombia, Bulletin of Volcanology, 55, pp. 289-296.
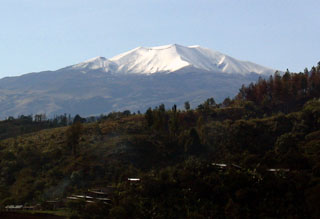
Geological Summary. Puracé is an active andesitic volcano with a 600-m-diameter summit crater at the NW end of the Los Coconucos Volcanic Chain. This volcanic complex includes nine composite and five monogenetic volcanoes, extending from the Puracé crater more than 6 km SE to the summit of Pan de Azúcar stratovolcano. The dacitic massif which the complex is built on extends about 13 km NW-SE and 10 km NE-SW. Frequent small to moderate explosive eruptions reported since 1816 CE have modified the morphology of the summit crater, with the largest eruptions in 1849, 1869, and 1885.
Information Contacts: Instituto Colombiano de Geologia y Mineria (INGEOMINAS), Observatorio Vulcanológico y Sismológico de Popayán, Popayán, Colombia.