Report on Cumbal (Colombia) — February 2013
Bulletin of the Global Volcanism Network, vol. 38, no. 2 (February 2013)
Managing Editor: Richard Wunderman.
Edited by Julie A. Herrick.
Cumbal (Colombia) Non-eruptive activity: swarms and increased emissions during 2011-2012
Please cite this report as:
Global Volcanism Program, 2013. Report on Cumbal (Colombia) (Herrick, J.A., and Wunderman, R., eds.). Bulletin of the Global Volcanism Network, 38:2. Smithsonian Institution. https://doi.org/10.5479/si.GVP.BGVN201302-351100
Cumbal
Colombia
0.95°N, 77.87°W; summit elev. 4764 m
All times are local (unless otherwise noted)
Our last report on Cumbal volcano (BGVN 19:07) highlighted fumarolic activity from the NE craters, and monitoring efforts by scientists collaborating with the Servicio Geológico Colombiano (SGC). The SGC (formerly known as Instituto Colombiano de Geología y Minería, “INGEOMINAS”) monitors the volcano from Pasto, ~72 km NE of Cumbal (figure 3). In this report we describe field observations during 2005-2012, significant new monitoring instruments installed during 2008-2012, and episodes of seismic unrest. Earthquake swarms during 2011 and 2012 accompanied increased fumarolic activity.
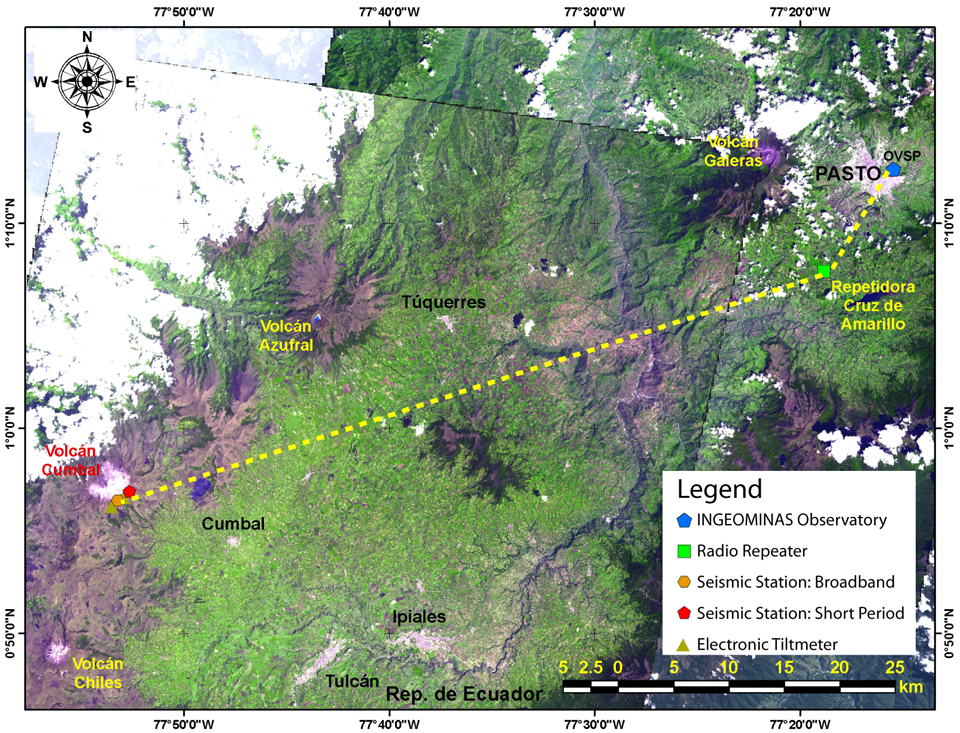 |
Figure 3. This 2008 map of the Cumbal region indicates locations of telemetered monitoring instruments (see legend), major towns (black labels), and nearby volcanoes (yellow text; red text for Cumbal). Yellow text is also used for the radio repeater at “Cruz de Amarillo” ~65 km ENE of Cumbal volcano. More instruments were added to the system later. Courtesy of SGC. |
SGC maintained Alert Level Green (Level IV, the lowest status on a 4-step system; figure 4) with two exceptions. Reduced monitoring during May-July 2010 caused the status to be unassigned during that time. Elevated seismicity and emissions noted in June 2012 raised the status from Green (Level IV) to Yellow (Level III) signifying detected “changes in behavior of the volcanic system.”
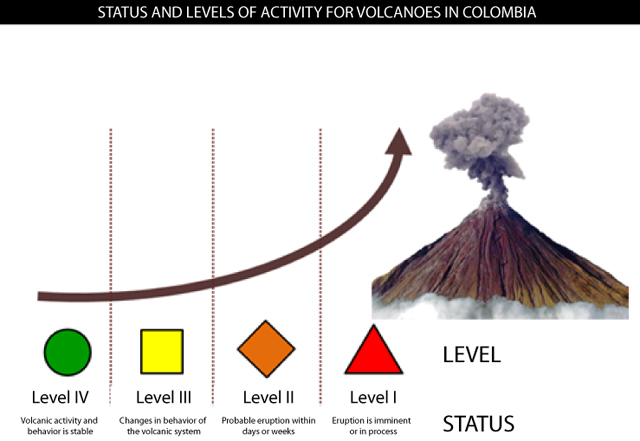 |
Figure 4. This pictogram describes the volcano Alert Levels used for communicating hazards in Colombia (translated from original in Spanish). This is a four-step system similar to the USGS volcanic activity alert-notification system (Gardner and Guffanti, 2006), except that each step is numbered in addition to having a color code: Green (Level IV), Yellow (Level III), Orange (Level II), and Red (Level I). All SGC observatories (based in Pasto, Popayán, and Manizales) apply this qualitative system. Courtesy of SGC. |
Local hazard map. SGC published a hazard map in 1988 for the region surrounding Cumbal (figure 5). The three asymmetrical hazard zones, high (red), medium (orange), and low (yellow), are at risk for ashfall and pyroclastic flows.
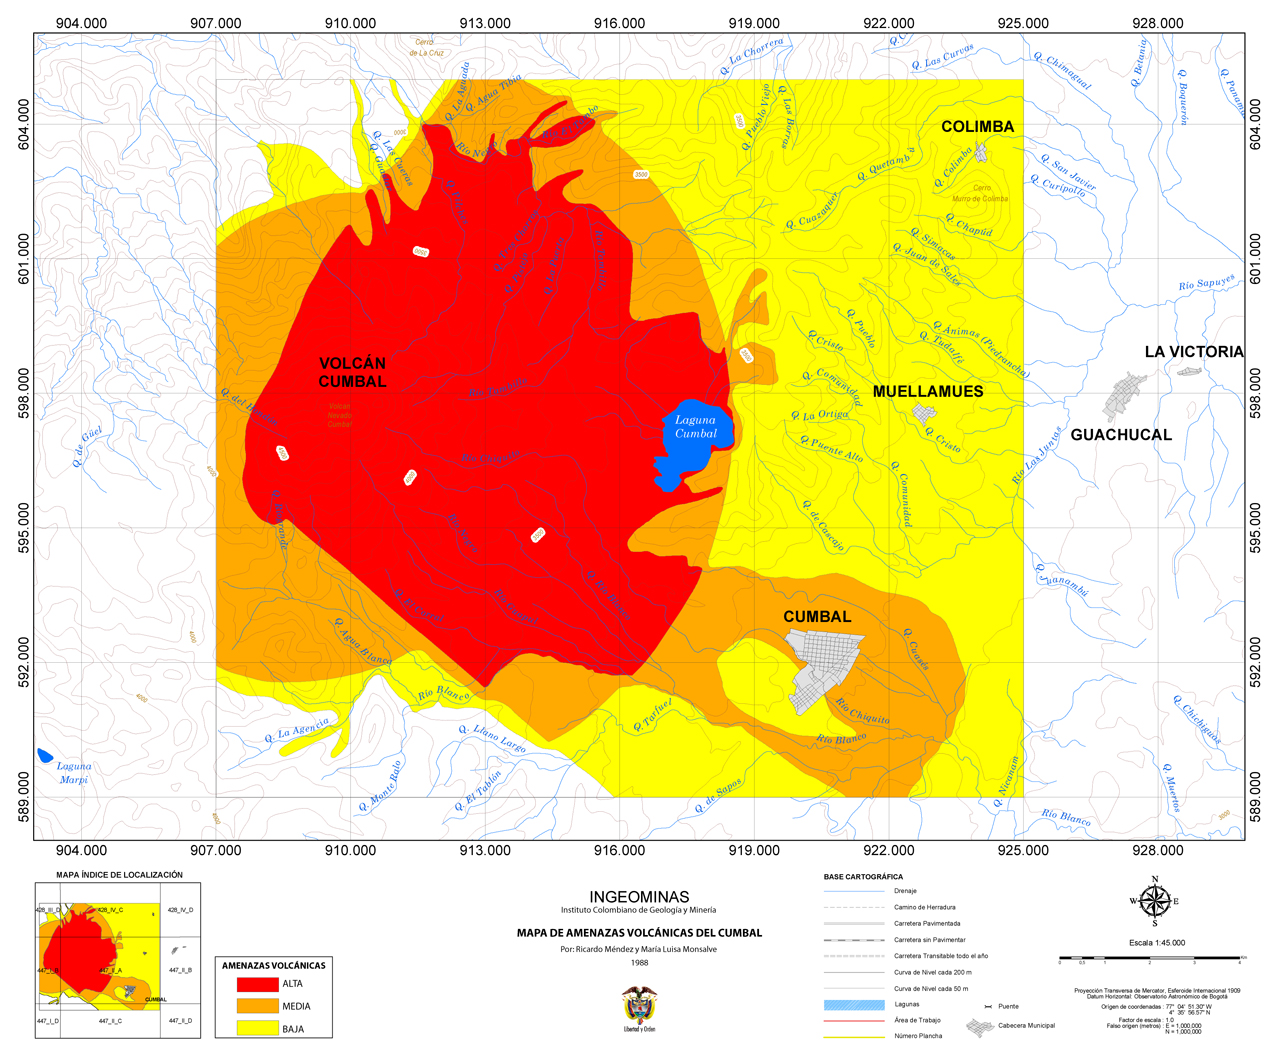 |
Figure 5. This hazard map for Cumbal volcano was developed in 1988 by Ricardo Méndez and María Luisa Monsalve of INGEOMINAS (now the Servicio Geológico Colombiano). Three major zones delineate high, medium, and low risk. Note that ashfall could occur in any of the three zones. Courtesy of SGC. |
Areas at highest risk, in the red zone, could be affected by lava and pyroclastic flows, especially within the narrow valleys of Chiquito, Blanco, and Río Grande. Ashfall, ballistics, mudflows, and gas emissions could also occur as far away as ~8 km from the summit. Areas at medium risk, the orange zone, could also be affected by pyroclastic flows, ashfall, and mudflows over an area extending up to 14 km SE from the summit, encompassing the town of Cumbal. Areas at lowest risk, yellow zone, is located primarily downwind of the volcano where pyroclastic flows and ashfall could occur; this zone extends beyond the view of the map.
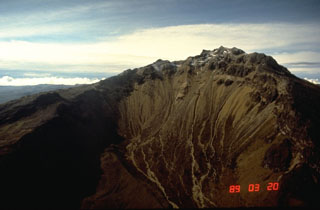
Monitoring efforts. Aerial investigations conducted since 2005 revealed persistent plumes rising from Cumbal’s NE craters, El Verde and La Plazuela (figure 6; see also figure 2 in BGVN 19:07 for an annotated sketch map of the summit craters). In their online Technical Bulletins, SGC emphasized the frequency of plumes from this region that were documented since at least 1988.
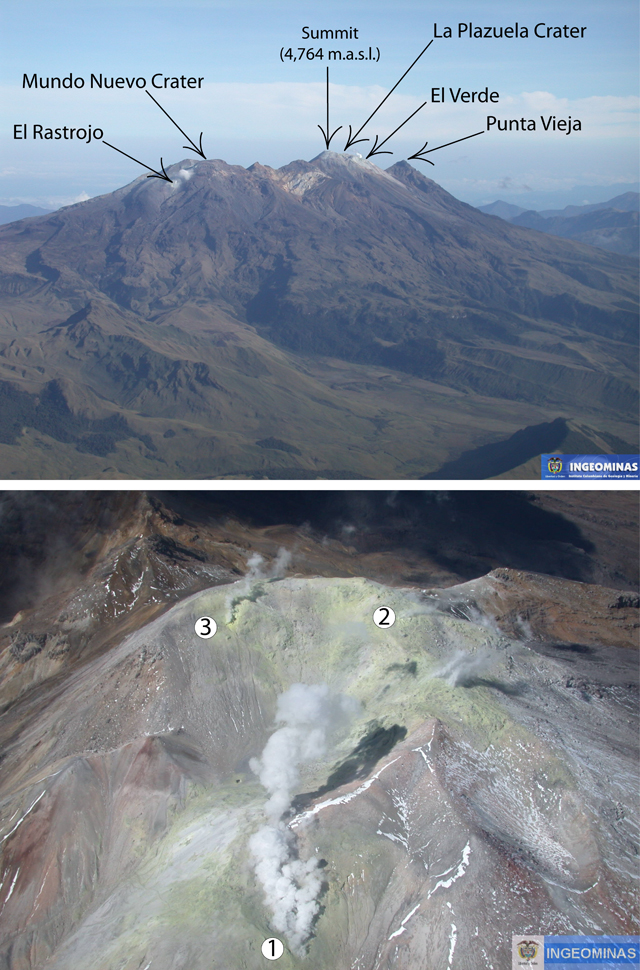 |
Figure 6. Cumbal is an elongate volcano with multiple peaks. In 2005 and 2007, clear conditions provided views of plumes rising from Cumbal’s summit craters, El Verde and La Plazuela. (top) On 29 January 2007, white plumes rose from the fumaroles El Verde and Rastrojo; the look direction is N. (bottom) On 29 December 2005, discrete plumes were visible from the fumaroles El Verde (1), El Tábano (2), and La Desfondada (3); the look direction is NNW. Some snow had collected along the ridges and a small pond of water was visible within La Plazuela crater that day. Courtesy of SGC. |
To help understand Cumbal’s state, SGC installed seismic and electronic tilt equipment in late 2008 (figure 3). The La Mesa (2.5 km ESE) and Limones (2 km SE) stations had electronic tilt and short-period seismic instrumentation (figure 7). During installation on 24 September 2008, technicians observed steam plumes rising from the fumarolic areas El Verde and La Plazuela (figure 8).
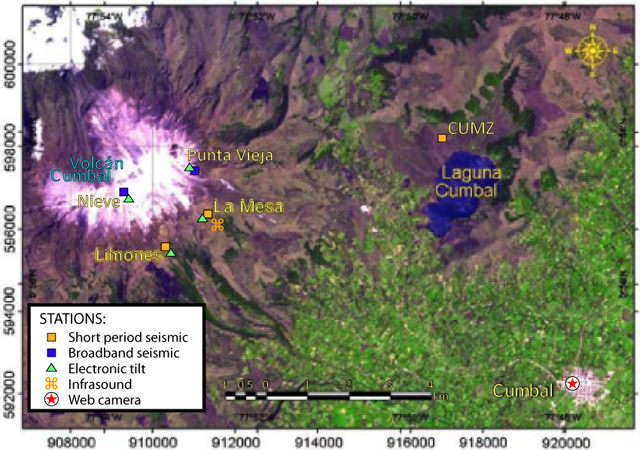 |
Figure 7. This satellite image-based map includes upgrades in Cumbal’s monitoring network as of 2012. Courtesy of SGC. |
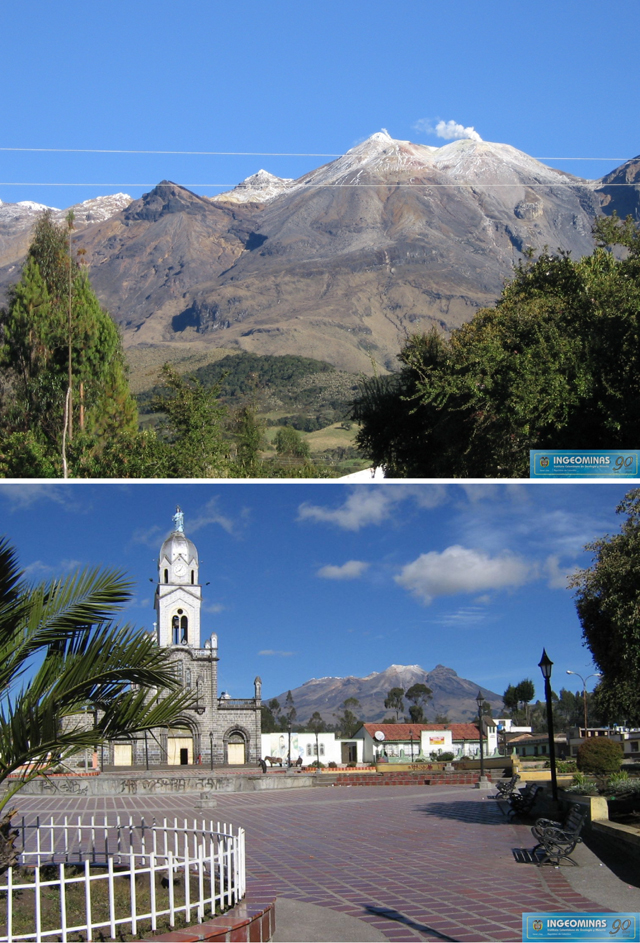 |
Figure 8. Clear conditions revealed the pale, fumarolic summit area of Cumbal during the mornings of two days in September 2008. (top) Two white plumes seen at 0704 on 24 September 2008; the smaller plume (center) rose from La Plazuela crater while the larger plume (to the right) rose from El Verde. Emissions from these sites have been noted since the late 1980s. This photograph was taken from a location ~6.5 km SE from the summit. (bottom) From the center of town, near the Cumbal Nariño Temple, the view NW toward Cumbal’s summit and fumarolic sites was clear on 25 September 2008. Courtesy of SGC. |
In June 2009, SGC installed a broadband seismometer at Limones station, upgrading from the short-period sensor. Unfortunately, monitoring capabilities were significantly reduced when, in December 2009, vandals stole station instrumentation at this site.
Data from the remaining station, La Mesa, was only acquired intermittently during January-June 2010 owing to radio repeater problems. From May to July, the Alert Level status went unassigned, but upon repair of the system, later returned back to Green (Level IV).
In August 2010 a short-period seismic station (CUMZ) came online (figure 7). This station was maintained by the National Seismological Network of Colombia (RSNC). The electronic tiltmeter at La Mesa was offline during August-November 2010 due to electronic malfunctions.
In November and December 2011, SGC collaborated with the Colombia Air Force (FAC) to conduct overflights of the volcanic complex. In addition to aerial photos and observations, a thermal camera was used to determine the hotspot distribution and measure temperatures for those sites (figure 9).
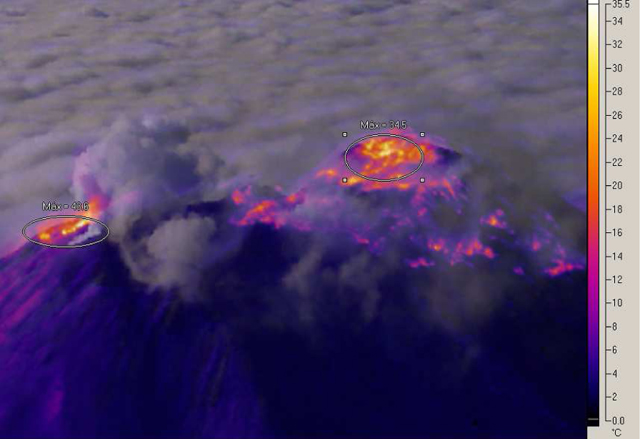 |
Figure 9. This thermal image was taken during an overflight of Cumbal’s summit on 27 November 2011. The look direction was approximately S with El Verde (43.6°C) and the highest part of La Plazuela’s rim (34.5°C) showing the highest temperatures. Steam plumes rising from the craters partly obscured the view. Courtesy of FAC and SGC. |
Monitoring capabilities were expanded when SGC installed an infrasound sensor at the La Mesa monitoring site in March 2012 and a webcamera was installed in the town of Cumbal (~11 km SE) in May (figure 10). During March-December 2012, white plumes were frequently observed rising from Cumbal’s fumarolic sites.
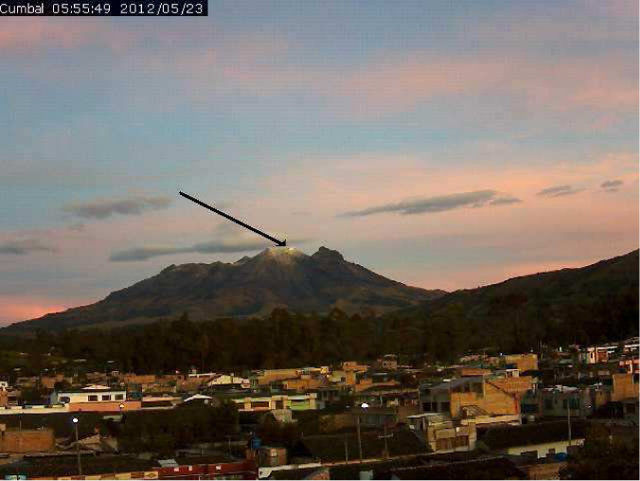 |
Figure 10. An image taken by the new Cumbal webcamera on 23 May 2012. The black arrow points to the source of the strongest plumes, El Verde crater. Courtesy of SGC. |
The Limones short-period seismometer was back online in October 2012. Additionally, two new stations, Nieve and Punta Vieja (figure 7), were added to the network in December; these stations had broadband seismic and electronic tilt equipment.
Summit fumarole monitoring. During 2010-2012, SGC conducted field campaigns to monitor Cumbal’s summit fumarolic sites. Three fumaroles (Desfondada, El Verde, and El Rastrojo) were visited during this time period with repeat observations and measurements. Lab analyses were conducted at the Manizales Volcanological and Seismological Observatory.
The Desfondada fumarole, located near the W rim of La Plazuela crater (see the sketch map in figure 2 in BGVN 19:07), was visited only once for sampling with the Giggenbach bottle method in August 2010; this site had a relatively high temperature, 278.4°C. The other sites were visited frequently and also sampled to determine gas species and condensates (table 1).
Table 1. Maximum temperatures measured from Cumbal's fumaroles during 2010-2012 at Desfondada, El Rastrojo, and El Verde. Site locations appear in figure 2 of BGVN 19:07, while the location of El Rastrojo is closest to the S-most crater of the complex, Mundo Nuevo. Courtesy of SGC.
| Date | Site | Temperature (°C) |
| Aug 2010 | Desfondada | 278.4 |
| Aug 2010 | El Rastrojo | 177.6 |
| Sep 2011 | El Rastrojo | 153.3 |
| Dec 2011 | El Rastrojo | 178.9 |
| Mar 2012 | El Rastrojo | 148.5 |
| Apr 2012 | El Rastrojo | 104.0 |
| Aug 2010 | El Verde | 313.0 |
| Mar 2012 | El Verde | 122.3 |
| Apr 2012 | El Verde | 115.6 |
The earliest measured temperature from El Verde (in August 2010) yielded the highest value of the three fumaroles (313°C). Compared with temperatures measured in 1994 (378°C, BGVN 19:07), El Verde’s values were slightly lower; however, the three available temperatures from 2010 and 2012 were within the measured range determined by SGC field campaigns conducted during previous years (BGVN 19:07).
The El Rastrojo site was located ~1.6 km SW of the summit (figure 11); this fumarolic area, on the outer edge of Mundo Nuevo crater regularly emitted plumes and had temperatures in the range 104-178.9°C.
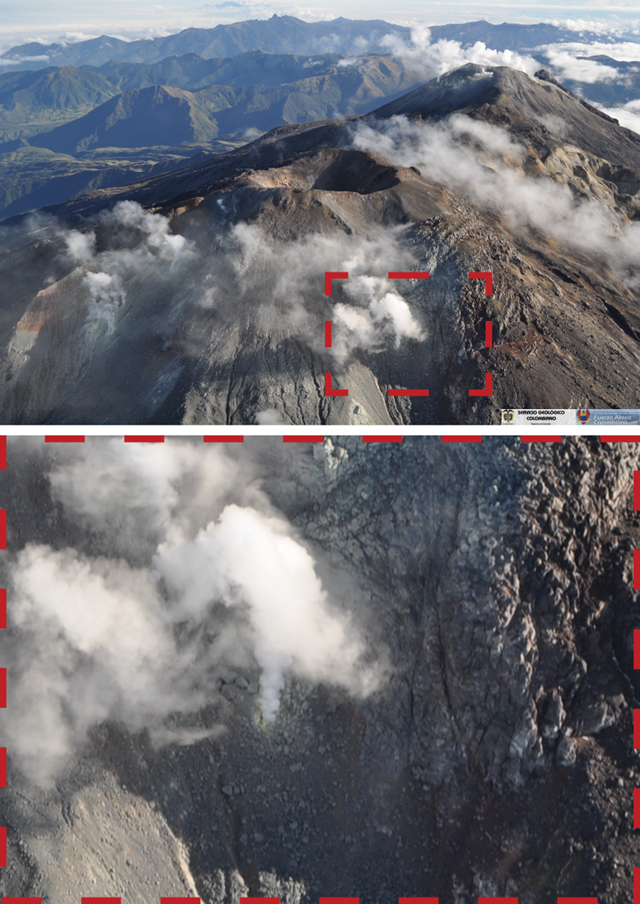 |
Figure 11. On 27 November 2011, white plumes were visible rising from fumarolic features along the ridge of Cumbal volcano. (top) This oblique view of Cumbal is centered on Mundo Nuevo crater, the SW crater of the ~2 km-long volcanic complex. The area highlighted in red shows the location of El Rastrojo, an active fumarolic site that frequently emitted white plumes and was monitored by SGC. White plumes also emerge from La Plazuela and El Verde craters in the middle-ground (near the right edge of the image). (bottom) In this zoomed image (clipped from the top image), a short column of white vapor rises from El Rastrojo fumarole. This area is a scree slope where several large boulders are discolored by yellow sulfur deposits. Courtesy of SGC. |
Hot spring investigations. Inferred magmatic compositions were detected from hot springs during 1988-1996 (Lewiki and others, 2000). Field investigators sampled from sites located within the central crater and from sites along the SE flank, up to 10 km from the summit and towards the town of Cumbal (figure 12). However, they concluded that “from 1995 to 1996, geochemical data show increasing hydrothermal signatures, suggesting a decline in magmatic volatile input.”
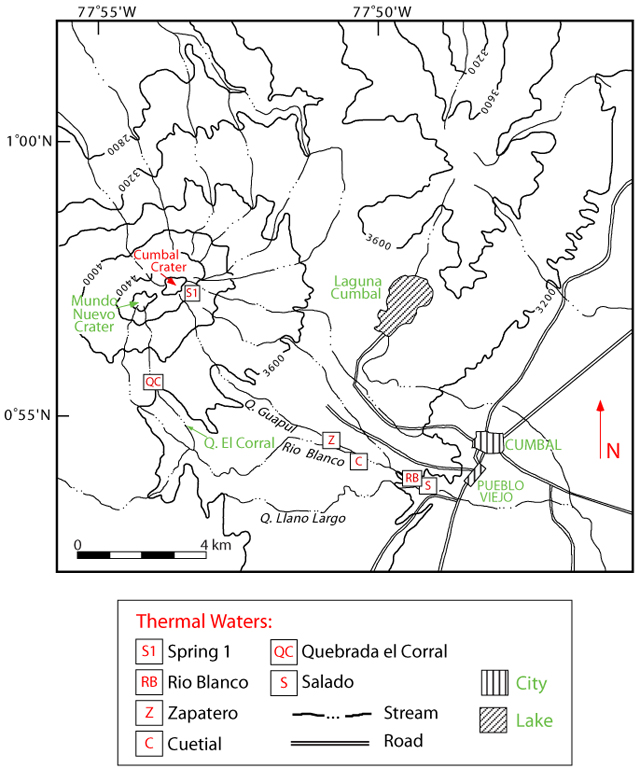 |
Figure 12. This sketch map of Cumbal and the surrounding area highlights the locations of hot springs. During 2010-2012, SGC monitored four of these sites: El Salado (“S”), Cuetial (“C”), El Zapatero (“Z”), and Hueco Grande (also known as Quebrada el Corral, “QC”). Note that the generalized name “Cumbal Crater” is assigned to the area of La Plazuela and El Verde craters. Modified from Lewiki and others (2000). |
During 2010, SGC monitored four hot springs for temperature and chemical changes. Results from sampling during May, August, and November 2010 determined chemical classifications for the springs El Salado, Cuetial, El Zapatero, and Hueco Grande (figure 13).
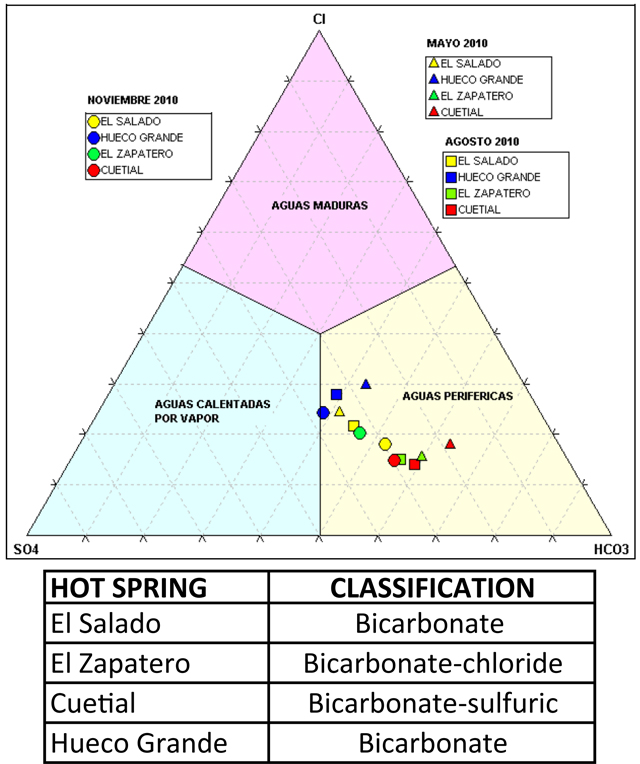 |
Figure 13. Based on geochemical results from investigations in May (triangles), August (squares), and November 2010 (circles), SGC scientists classified four of Cumbal’s hot springs. Within this ternary diagram, the datapoints were generally well within the “Periferal Water” (Aguas Periféricas, significant HCO3) class. Datapoints from Hueco Grande, approached the “Volcanic Water” (translated from Spanish “Aguas Calentadas por Vapor,” significant SO4) class than the others. No datapoints were within the “Mature Water” (Aguas Maduras, significant Cl) class. Courtesy of SGC. |
Sampling and analysis of the four hot springs continued during 2011-2012. SGC maintained a growing database of characteristics from these springs and released the results in online bulletins. In particular pH, temperature, conductivity, and concentrations of carbonates were repeatedly measured. During this time period, pH values measured from the hot springs were in the range of 5.9-7.3; temperatures were 26.4-34.4°C (the highest values were from Cuetial spring); conductivity values (Oxidation-Reduction Potential, “ORP”) ranged from 7.7-42.2 mV (highest values were from Cuetial and the lowest was from Hueco Grande springs); bicarbonate (HCO3) concentrations were 271.7-1,008.0 mg/L (the highest value was obtained from El Zapatero spring).
Cumbal seismicity. When the seismic stations Limones and La Mesa came online in late 2008, SGC began characterizing Cumbal’s seismicity based on the following interpretive scheme:
• Hybrid (HYB): Seismicity associated with signals characterizing fracturing and fluid movement.
• Long period (LPS): Seismicity associated with unsteady fluid movement (magma or hydrothermal fluids, for example).
• Tremor (TRE): Seismicity associated with fluid movement in which the source behaves in a sustained manner.
• Tornillo (TOR): Seismicity associated with fluid movement in which subterranean structures are linked with special conditions in such a manner that makes the cavities resonate. In their January 2009 online bulletin, SGC acknowledged that tornillo earthquakes have been an important indicator of eruptive activity at Galeras volcano, but the occurrence of the same signature at Cumbal volcano required additional analysis before associating specific unrest with this seismicity.
• Volcano-tectonic (VT): Earthquakes associated with brittle failure events caused by magma movement.
• Unclassified volcanic (VOL): Earthquakes from the region of Cumbal that do not correspond with the other classes; SGC stated that these events will be analyzed in more detail after more baseline data is collected. This category was also applied to seismic analyses of Doña Juana, a volcano that was instrumented around the same time (see report on Doña Juana in BGVN 38:01).
Seismicity in 2009. During 2009, as SGC began to establish baseline data for Cumbal’s seismicity, a wide range of earthquake classes was detected (figure 14). LPS and VT events dominated the records and TRE, HYB, and TOR earthquakes were also detected (in order of decreasing occurrence). TOR earthquakes occurred more frequently during August to early December. Due to vandalism, the 2009 record ended on 13 December 2009.
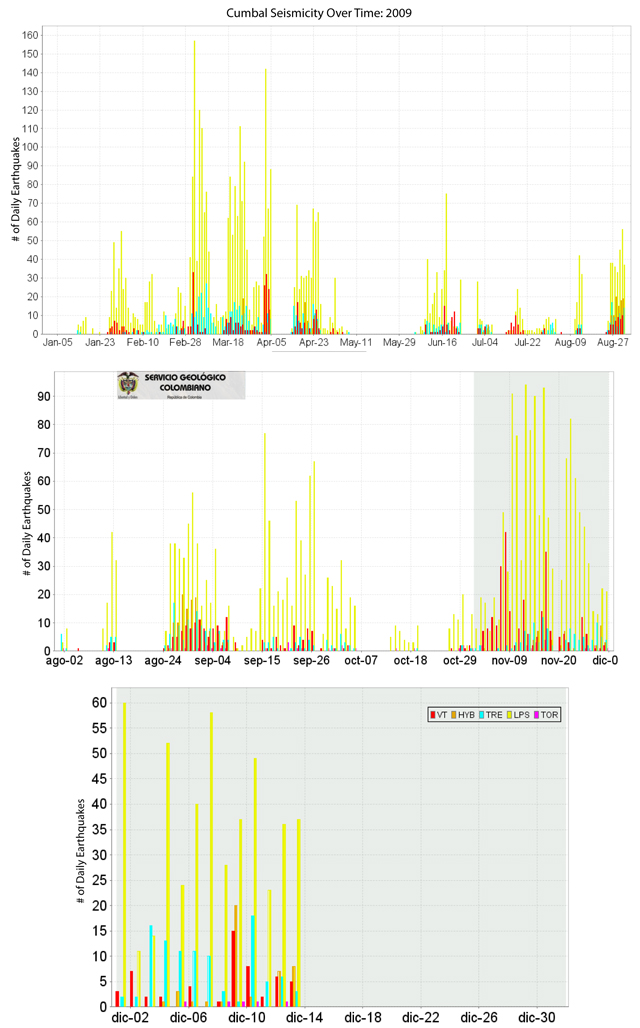 |
Figure 14. The daily seismicity detected from Cumbal during 2009 in three plots that display January-August, August-November, and 1-13 December. Five different classes of earthquakes were tallied daily (VT, HYB, TRE, LPS, and TOR). Data gaps are attributed to station outages and time periods requiring re-processing; gray regions signify the reporting period in which the plots appear. Courtesy of SGC. |
Seismicity in 2010. From January to July 2010, La Mesa station detected earthquakes intermittently and the Limones seismic station remained offline. When the network connection was re-established for La Mesa in late July, LPS earthquakes again dominated the records through the end of December (figure 15).
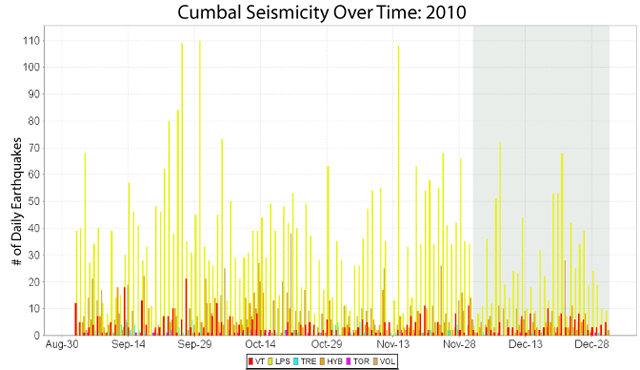 |
Figure 15. Daily seismicity from Cumbal during 1 September-31 December 2010 was dominated by LPS events. Six different classes of earthquakes were tallied daily (VT, LP, TRE, HYB, TOR, and VOL); the gray region highlights the month when the plot was released online. Courtesy of SGC. |
Seismicity in 2011. LPS, VT, and HYB events dominated seismicity at Cumbal for most of 2011; more VOL events occurred than HYB, but this category was described as temporary until more analysis is possible (table 2 and figure 16). Data quality enabled some events to be located and some swarms were apparently driving a several-fold increase in monthly counts. Until November 2011, TOR events were occurring ~5 times per month and TRE were occurring ~13 times per month. In November, seismicity increased significantly and SGC reported that several earthquake swarms had occurred; in particular, one event occurred on 18 November. A swarm of LPS earthquakes also occurred during 20-21 and on 31 December. Epicenters could not be calculated from the data and there were no reports of felt earthquakes.
Table 2. Monthly seismicity at Cumbal was tabulated by the occurrence of events: VT, LPS, TRE, HYB, TOR, VOL, and the overall total. Courtesy of SGC.
| Date | VT | LPS | TRE | HYB | TOR | VOL | Total | Notes |
| Jan 2011 | 165 | 906 | 14 | 109 | 8 | 111 | 1313 | -- |
| Feb 2011 | 188 | 453 | 5 | 5 | 5 | 104 | 760 | -- |
| Mar 2011 | 96 | 743 | 9 | 76 | 12 | 136 | 1072 | -- |
| Apr 2011 | 52 | 476 | 3 | 45 | 1 | 76 | 653 | -- |
| May 2011 | 80 | 575 | 10 | 37 | 5 | 38 | 745 | -- |
| Jun 2011 | 88 | 659 | 2 | 31 | 2 | 36 | 818 | -- |
| Jul 2011 | 76 | 726 | 9 | 29 | 4 | 30 | 874 | -- |
| Aug 2011 | 53 | 560 | 7 | 40 | 2 | 9 | 671 | -- |
| Sep 2011 | 75 | 524 | 8 | 70 | 7 | 47 | 731 | -- |
| Oct 2011 | 64 | 678 | 61 | 65 | 0 | 90 | 958 | -- |
| Nov 2011 | 300 | 1967 | 385 | 279 | 4 | 326 | 3261 | Swarms |
| Dec 2011 | 160 | 2028 | 453 | 228 | 4 | 130 | 3003 | Swarms |
| Jan 2012 | 103 | 1657 | 252 | 159 | 2 | 8 | 2181 | Swarms |
| Feb 2012 | 176 | 758 | 73 | 167 | 1 | 6 | 1181 | -- |
| Mar 2012 | 78 | 678 | 47 | 105 | 5 | 0 | 913 | -- |
| Apr 2012 | 80 | 619 | 32 | 60 | 0 | 1 | 792 | -- |
| May 2012 | 54 | 625 | 35 | 45 | 0 | 0 | 759 | Swarms |
| Jun 2012 | 56 | 858 | 29 | 34 | 5 | 0 | 982 | -- |
| Jul 2012 | 98 | 1306 | 29 | 54 | 5 | 0 | 1492 | Swarms, 13 EQs located |
| Aug 2012 | 101 | 855 | 46 | 42 | 4 | 0 | 1048 | Swarms, 11 EQs located |
| Sep 2012 | 117 | 1344 | 31 | 60 | 4 | 0 | 1556 | Swarms, 3 EQs located |
| Oct 2012 | 135 | 1080 | 62 | 51 | 14 | 0 | 1342 | Swarms, 92 EQs located |
| Nov 2012 | 235 | 1017 | 15 | 99 | 2 | 1 | 1369 | Swarms, 89 EQs located |
| Dec 2012 | 260 | 1001 | 10 | 180 | 3 | 24 | 1478 | Swarms, 97 EQs located |
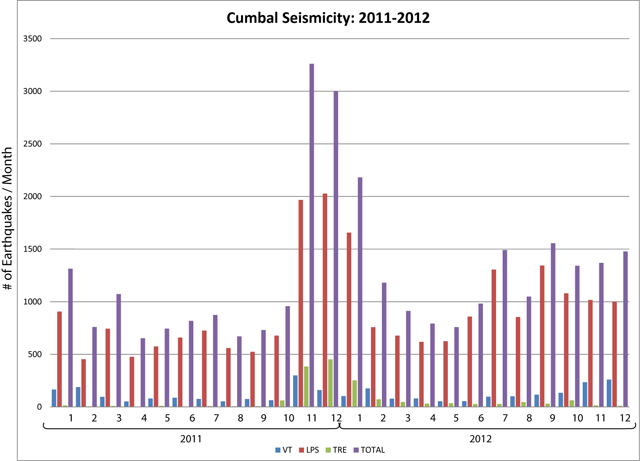 |
Figure 16. Cumbal earthquakes tallied by month based on event class during 2011-2012. Elevated seismicity persisted during November 2011-January 2012, particularly VT, LPS, and TRE. The “TOTAL” class is the sum of VT, LPS, TRE, HYB, TOR, and VOL earthquakes for each month (see table 2 for values). Courtesy of SGC. |
Seismicity in 2012. SGC reported that seismic swarms continued to occur in January 2012. The swarm that began at 2200 on 31 December 2011 continued until 1 January 2012 and a total of 211 LPS events were detected. Two more swarms occurred later that month, amounting to a total of 274 earthquakes. Seismicity declined during February-April but swarms reappeared: in May, one; in July, five; in August, two; in September, six; in October, six; in November, seven.
Due to elevated seismicity, persistent swarms, and observations of increased emissions from El Verde and La Plazuela, SGC announced on 10 July that the Alert Level was raised to Yellow (Level III). This status was maintained through December 2012. In their online July 2012 Activity Report, SGC noted that residents in the area had also reported notable gas emissions, seismicity, and possible noises associated with earthquakes.
Epicenters of Cumbal’s VT earthquakes were calculated during July-December 2012 and located on regional maps (table 3). Earthquake locations tended to be dispersed throughout the region, although some clustering was notable between 2 and 6 km of the summit region and at depths less than 12 km (as measured from the summit elevation) (figure 17).
Table 3. VT earthquakes from Cumbal during July-December 2012 tended to be low-magnitude events at shallow depths. This table compiles announcements from weekly activity reports; the date listed corresponds to the release date of the information. During the listed weeks, VT events were often clustered; SGC made special note of events that were clustered between La Plazuelas and Mundo Nuevo (“Cent.”) and events that were dispersed (“Disp.”). Depths were measured as km below the summit. Magnitudes were not available (“na”) during the week of 18 December. Courtesy of SGC.
| Date | Location | Magnitude | Depth |
| 31 Jul 2012 | SW | less than 2.1 | ≤ 10 |
| 06 Aug 2012 | N, S, Disp. | less than 1.3 | ≤ 6 |
| 16 Oct 2012 | ≤10 km N | less than 1.3 | ≤ 9 |
| 23 Oct 2012 | ≤ 2 km SE | less than 1 | ≤ 3 |
| 30 Oct 2012 | ≤ 4 km E | less than 1.2 | ≤ 4 |
| 06 Nov 2012 | ≤ 5 km SE | less than 0.2 | ≤ 9 |
| 13 Nov 2012 | ≤ 3 km E | less than 0.6 | ≤ 2 |
| 20 Nov 2012 | ≤ 3 km E | less than 1.9 | ≤ 6 |
| 04 Dec 2012 | ≤ 13 km Disp. | less than 1.6 | ≤ 12 |
| 11 Dec 2012 | ≤ 5 km Disp. | less than 0.6 | ≤ 10 |
| 18 Dec 2012 | ≤ 6 km Cent. | -- | less than 1 |
| 26 Dec 2012 | Cent. | less than 1.1 | less than 2 |
| 26 Dec 2012 | N | less than 1.1 | ≤ 9 |
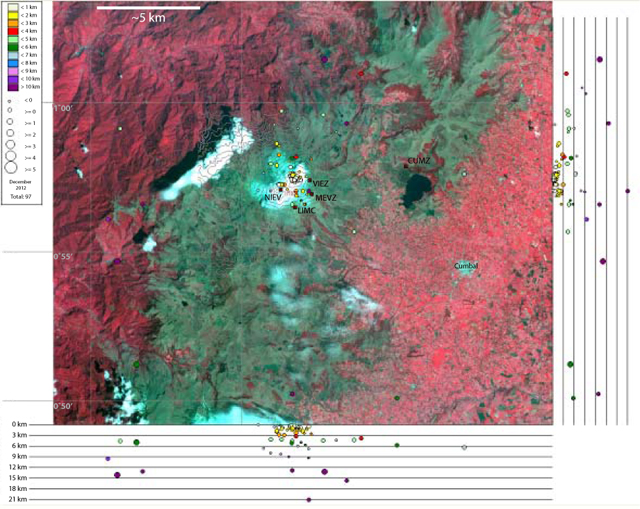 |
Figure 17. A total of 97 volcano-tectonic earthquakes were located during December 2012 within the region of Cumbal volcano. Five seismic stations (dark red squares) were online near the volcano: LIMC (Limones), MEVZ (La Mesa), NIEV (Nieve), VIEZ (Punta Vieja), and CUMZ (the RSNC Cumbal station). Earlier in the month, VTs were primarily dispersed in the region while later in the month, they were more clustered around the edifice and N (table 3). Courtesy of SGC. |
In September, October, and November 2012, during field investigations at various locations around Cumbal’s flanks, SGC scientists also noted increased emissions from the summit fumaroles. In particular, white plumes were strong from El Verde and El Rastrojo fumaroles.
Geodetic monitoring during 2009-2010. Electronic tilt data available during 2009 showed oscillations within the expected range of the instruments. During 2010, while instrumentation was reduced and electronic problems persisted, tilt records continued to show minor variations. In July, a decreasing trend was observed from the tangential component of La Mesa tiltmeter (figure 18). Unfortunately, the instrument was offline from August through November. When monitoring resumed in December, no deformation trends were noted.
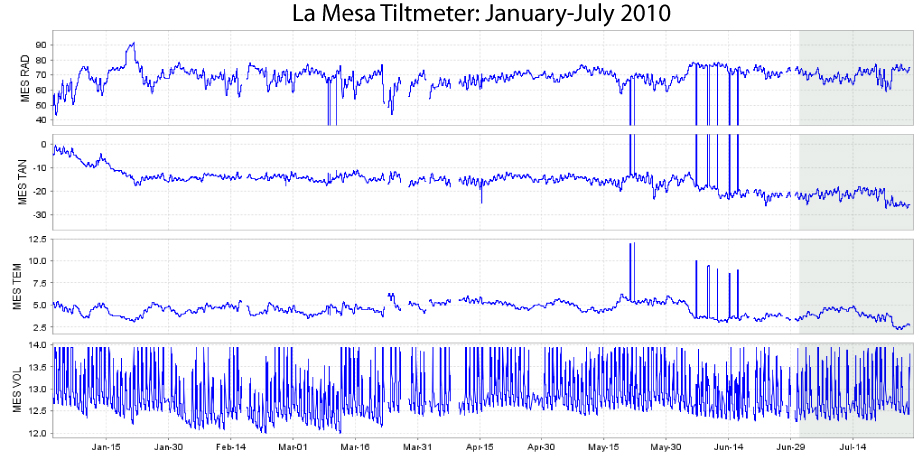 |
Figure 18. The two components of the La Mesa electronic tiltmeter recorded stable conditions from Cumbal’s SW flank (in the Mundo Nuevo region) during 1 January-31 July 2010. The four plots, from top to bottom, contain radial tilt component (in µrad), tangential tilt component (in µrad), temperature (°C), and voltage (V) data. Note that minor variations in temperature and daily variations in the voltage correspond to the recharging cycle controlled by the solar panels and consequent voltage drain at night. The gray shaded section represents the reporting period when the data was published online. Courtesy of SGC. |
Geodetic monitoring during 2011-2012. In their April 2011 Technical Bulletin, SGC highlighted the onset of a decreasing trend in La Mesa’s tangential data; the trend began on 30 April and continued to 30 June for a total decrease of ~25 µrad (figure 19); this trend ended in July. A period of increasing tilt began on 29 September and ended on 30 November 2011 (total increase was ~35 µrad). The signal from La Mesa station (effecting electronic tilt as well as seismic records) was intermittent in August. From December 2011 through December 2012, fluctuations persisted in the tilt data; however, stable conditions were characteristic of 2012 deformation.
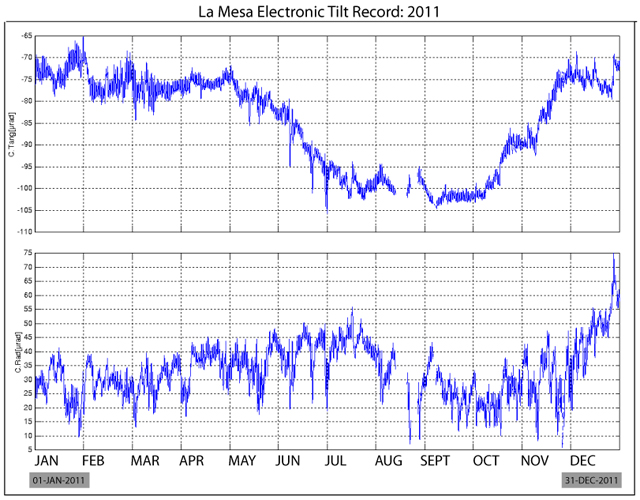 |
Figure 19. Tilt record of Cumbal during 2011 (tangential component on top plot, radial on bottom). In their Technical Bulletins, SGC highlighted several trends that became apparent in the tangential data from La Mesa station; a decreasing event began at the end of April reaching a total decrease of ~25 µrad by late June. The station detected an increase in tilt of equal magnitude in late September and ending by late November. Courtesy of SGC. |
References. Gardner, C.A., and Guffanti, M.C., 2006, U.S. Geological Survey’s Alert Notification System for Volcanic Activity, U.S. Geological Survey, Fact Sheet 2006-3139, Version 1.0.
Lewiki, J.L., Fischer, T., and Williams, S.N., 2000, Chemical and isotopic compositions of fluids at Cumbal Volcano, Colombia: evidence for magmatic contribution, Bulletin of Volcanology, 62: 347-361.
Geological Summary. Many youthful lava flows extend from the glacier-capped Cumbal volcano, the southernmost historically active volcano of Colombia. The volcano is elongated in a NE-SW direction and is composed primarily of andesitic-dacitic lava flows. Two fumarolically active craters occupy the summit ridge: the main crater on the NE side and Mundo Nuevo crater on the SW. A young lava dome occupies the 250-m-wide summit crater, and eruptions from the upper E flank produced a 6-km-long lava field. The oldest crater lies NNE of the summit crater, suggesting SW-ward migration of activity. Explosive eruptions in 1877 and 1926 are the only known historical activity. Thermal springs are located on the SE flanks.
Information Contacts: Servicio Geológico Colombiano (SGC), Observatorio Vulcanológico y Sismológico de Pasto, Pasto, Colombia (URL: http://www.SGC.gov.co/Pasto.aspx).