Report on Nevado del Tolima (Colombia) — June 2013
Bulletin of the Global Volcanism Network, vol. 38, no. 6 (June 2013)
Managing Editor: Richard Wunderman.
Edited by Julie A. Herrick.
Nevado del Tolima (Colombia) Non-eruptive during 2005-2012; hazard assessment and glacial retreat
Please cite this report as:
Global Volcanism Program, 2013. Report on Nevado del Tolima (Colombia) (Herrick, J.A., and Wunderman, R., eds.). Bulletin of the Global Volcanism Network, 38:6. Smithsonian Institution. https://doi.org/10.5479/si.GVP.BGVN201306-351030
Nevado del Tolima
Colombia
4.658°N, 75.33°W; summit elev. 5215 m
All times are local (unless otherwise noted)
During 2005-2012, Nevado del Tolima was non-eruptive and the Alert Level remained at IV (Green; "volcanically active with stable behavior") due to minimal seismicity and deformation. The Servicio Geológico Colombiano (SGC) monitored Tolima with a seismic network, tilt measurements, and regular field observations. The greatest changes at Tolima during this time period were related to the summit glacier that generated significant seismicity and surface activity. Volcano-tectonic (VT) and long-period (LP) earthquakes were also detected with the monitoring network, although these events were frequently too small to locate.
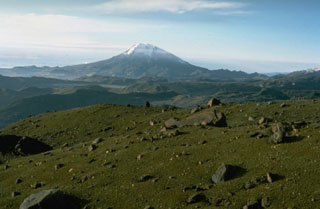
In this report, we also highlight geological hazards investigations by Thouret and others (1995); among the hazards, runout distances for lahars were determined as well as potential ash distribution areas. Further, we include the results of long-term studies focused on the summit glacier (figure 2); investigators noted significant retreat based on aerial photos and later, with Landsat image analysis.
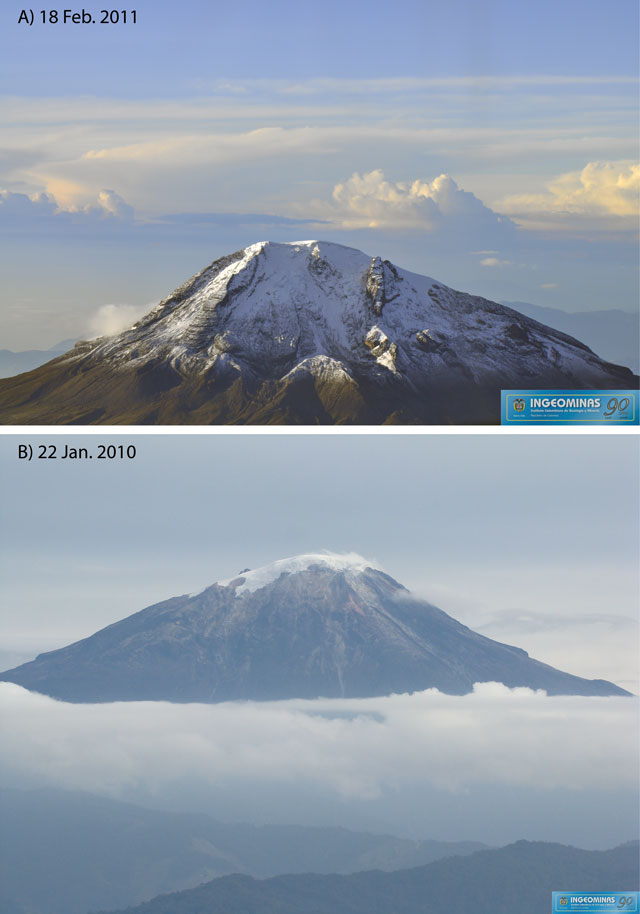 |
Figure 2. A) A view toward the S flank of the glacier-clad summit of Tolima taken on 18 February 2010. Fresh snowfall highlights the morphology that includes lava flows and debris fans. B) A view of the N flank taken on 22 January 2010. The extent of the glacier appears in bright contrast to the yellow-gray and red colors of the altered summit rock. Courtesy of SGC. |
Seismicity during March 2006 - December 2012. Based on volcano-tectonic (VT) and long-period (LP) earthquake counts, the SGC reported that low-level seismicity persisted during this reporting period (table 1). The occurrence of earthquakes was highest during 2006 when 22-90 VT and 5-20 LP events per month were recorded. From 2007 through 2012, VT and LP events occurred at a lower rate (0-73 VT per month and 0-17 LP per month).
Table 1. Monthly seismicity at Nevado del Tolima was tabulated by the occurrence of events: volcano-tectonic (VT), long-period (LP), Glacier & Rockfall, Unclassified, and Largest Earthquake magnitude. Events considered "Unclassified" are attributed to icequakes or rockfalls that do not fulfill the amplitude or duration parameters in order to be included in the SGC database. Note that these values have been corrected by the SGC database and differ from "Technical Bulletin" reports. Courtesy of SGC.
| Month | VT | LP | Glacier & Rockfall | Unclassified | Largest EQ |
| Mar 2006 | 48 | 17 | 1717 | 3295 | 1.58 |
| Apr 2006 | 22 | 20 | 1150 | 2572 | 0.64 |
| May 2006 | 35 | 17 | 1460 | 2331 | 0.95 |
| Jun 2006 | 43 | 8 | 675 | 1551 | 1.08 |
| Jul 2006 | 39 | 8 | 340 | 729 | 1.14 |
| Aug 2006 | 26 | 9 | 352 | 927 | 0.81 |
| Sep 2006 | 31 | 5 | 565 | 1254 | 1.01 |
| Oct 2006 | 81 | 7 | 904 | 1639 | 1.35 |
| Nov 2006 | 77 | 8 | 644 | 1735 | 1.53 |
| Dec 2006 | 90 | 9 | 632 | 2221 | 1.45 |
| Jan 2007 | 0 | 12 | 1218 | 2615 | 1.72 |
| Feb 2007 | 4 | 0 | 979 | 3825 | 1.65 |
| Mar 2007 | 7 | 1 | 1345 | 6513 | 0.64 |
| Apr 2007 | 1 | 1 | 1171 | 5939 | 1.01 |
| May 2007 | 21 | 0 | 1544 | 4129 | 1.02 |
| Jun 2007 | 5 | 0 | 615 | 2107 | 0.64 |
| Jul 2007 | 2 | 2 | 746 | 2165 | 1.14 |
| Aug 2007 | 6 | 0 | 524 | 1692 | 2.27 |
| Sep 2007 | 5 | 1 | 522 | 1472 | 0.7 |
| Oct 2007 | 4 | 1 | 472 | 1115 | 1.96 |
| Nov 2007 | 3 | 2 | 270 | 966 | 0.86 |
| Dec 2007 | 7 | 0 | 434 | 1080 | 1.73 |
| Jan 2008 | 3 | 0 | 318 | 968 | 0.55 |
| Feb 2008 | 2 | 0 | 210 | 805 | 0.73 |
| Mar 2008 | 1 | 0 | 275 | 1083 | -0.4 |
| Apr 2008 | 7 | 0 | 256 | 1453 | 1.62 |
| May 2008 | 5 | 0 | 265 | 1931 | 2.63 |
| Jun 2008 | 2 | 0 | 109 | 1207 | 0.88 |
| Jul 2008 | 6 | 0 | 125 | 1148 | 1.4 |
| Aug 2008 | 73 | 0 | 158 | 974 | 1.14 |
| Sep 2008 | 12 | 0 | 118 | 864 | 1.02 |
| Oct 2008 | 12 | 2 | 204 | 1157 | 0.81 |
| Nov 2008 | 2 | 0 | 263 | 1515 | 0.35 |
| Dec 2008 | 7 | 0 | 197 | 1242 | 0.45 |
| Jan 2009 | 7 | 0 | 185 | 1490 | 0.64 |
| Feb 2009 | 1 | 0 | 117 | 1017 | 0.45 |
| Mar 2009 | 3 | 0 | 257 | 2272 | 0.88 |
| Apr 2009 | 6 | 0 | 279 | 2245 | 1.3 |
| May 2009 | 8 | 0 | 275 | 2360 | 0.73 |
| Jun 2009 | 1 | 0 | 212 | 1846 | 0.88 |
| Jul 2009 | 10 | 0 | 100 | 1127 | 0.95 |
| Aug 2009 | 3 | 0 | 146 | 1881 | 2.2 |
| Sep 2009 | 8 | 0 | 127 | 1867 | 0.64 |
| Oct 2009 | 1 | 0 | 176 | 2757 | 0.23 |
| Nov 2009 | 0 | 0 | 329 | 1994 | 0 |
| Dec 2009 | 1 | 0 | 414 | 2055 | -0.21 |
| Jan 2010 | 4 | 0 | 678 | 1703 | 0.35 |
| Feb 2010 | 0 | 1 | 637 | 1551 | 0.75 |
| Mar 2010 | 6 | 1 | 698 | 1638 | 1.08 |
| Apr 2010 | 0 | 1 | 878 | 1344 | 0.43 |
| May 2010 | 1 | 2 | 742 | 1746 | 1.4 |
| Jun 2010 | 0 | 1 | 491 | 1307 | 0.91 |
| Jul 2010 | 0 | 1 | 505 | 1173 | 1.46 |
| Aug 2010 | 0 | 0 | 329 | 1337 | 0 |
| Sep 2010 | 0 | 1 | 425 | 860 | 0.7 |
| Oct 2010 | 0 | 1 | 204 | 434 | 0.1 |
| Nov 2010 | 5 | 2 | 314 | 1286 | 0.73 |
| Dec 2010 | 2 | 2 | 256 | 1075 | 1.3 |
| Jan 2011 | 0 | 0 | 197 | 1002 | 0 |
| Feb 2011 | 3 | 2 | 393 | 1805 | 0.81 |
| Mar 2011 | 1 | 3 | 978 | 443 | 1.45 |
| Apr 2011 | 0 | 1 | 1370 | 1043 | 0.91 |
| May 2011 | 1 | 4 | 1114 | 659 | 0.96 |
| Jun 2011 | 2 | 1 | 692 | 252 | 1.02 |
| Jul 2011 | 7 | 0 | 709 | 246 | 1.58 |
| Aug 2011 | 0 | 1 | 897 | 216 | 0.81 |
| Sep 2011 | 0 | 5 | 1404 | 388 | 1.22 |
| Oct 2011 | 1 | 0 | 1665 | 427 | 0.88 |
| Nov 2011 | 2 | 2 | 1890 | 601 | 0.73 |
| Dec 2011 | 3 | 2 | 1923 | 927 | 0.96 |
| Jan 2012 | 2 | 0 | 2033 | 740 | 0.55 |
| Feb 2012 | 2 | 0 | 1471 | 159 | 0.81 |
| Mar 2012 | 4 | 15 | 1348 | 95 | 0.75 |
| Apr 2012 | 9 | 17 | 1379 | 310 | 1.65 |
| May 2012 | 30 | 6 | 1740 | 417 | 1.58 |
| Jun 2012 | 2 | 0 | 1290 | 372 | 1.02 |
| Jul 2012 | 3 | 2 | 888 | 519 | 0.88 |
| Aug 2012 | 0 | 0 | 792 | 988 | 0 |
| Sep 2012 | 27 | 0 | 1077 | 847 | 1.45 |
| Oct 2012 | 3 | 4 | 1920 | 1359 | 0.64 |
| Nov 2012 | 2 | 4 | 1332 | 1289 | 1.08 |
| Dec 2012 | 12 | 1 | 1873 | na | 1.2 |
Seismic signals attributed to glacial changes ("icequakes") and rockfalls dominated the records during 2006-2012. Frequently, more than 1,000 events were recorded per month. During 2008-2010, such events were slightly less frequent; an average of 313 earthquakes occurred per month. Coincidentally, LP events were significantly less frequent during that time period as well (less than one event per month). From March 2006 to July 2007, rockfall signals were attributed to surface activity mainly occurring on the N flank and related to small avalanches of ice and rock. The SGC noted that the general summit area was the source of shallow seismicity from mid 2010 through 2012.
Because of sparse activity and low-magnitude events, hypocentral depths of VT earthquakes were rarely calculated during 2006-2012 (table 2). Five earthquakes were located in September 2012, the most to be located in a single month. Three of these earthquakes were located > 5 km of the summit (NW and SE), while 2 were within 1 km (figure 3). That month, seismicity was relatively high compared with previous months; the SGC reported 27 VT earthquakes and 1,077 "Glacier & Rockfall" signals.
Table 2. The number of located VT earthquakes from Tolima during 2011-2012. Located earthquake information was not available for 2006-2010. Courtesy of SGC.
| Date | Earthquakes | Depths (km) | Location from Summit |
| Mar 2011 | 1 | 2 | ~1 km, N |
| Jul 2012 | 1 | 4 | ~6 km, NW |
| Sep 2012 | 5 | 3 & 4 | -- |
| Oct 2012 | 2 | ~3.5 | -- |
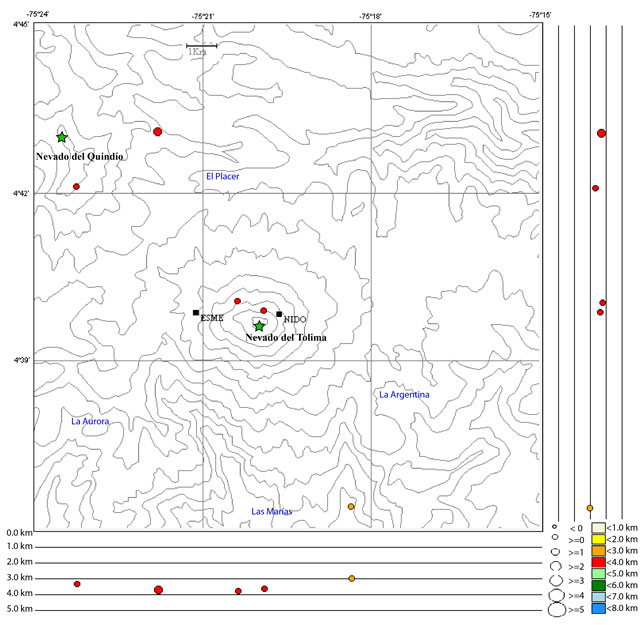 |
Figure 3. This map shows five located VT earthquakes in the region of Tolima during September 2012. Red and yellow circles indicate hypocenters and epicenters (colors relate to depths; circle size relates to event magnitude); black squares mark the locations of two seismic stations (ESME and NIDO); the summits of Nevado del Tolima and Nevado del Quindío (~10 km NW) are labeled and marked with green stars; approximate locations of towns are indicated by blue text. Courtesy of SGC. |
Surface deformation monitoring. An electronic tilt station was installed in 2011 and, by May 2011, data from the Esmeralda station (~2 km W) was being relayed to the SGC Manizales observatory (figure 4). Through the rest of 2011 and 2012, tilt data suggested the effects of local temperatures and fluctuations were within the expected range of the instrument. Changes of 70-95 and 75-100 μrad from the N and E components, respectively, were recorded on a monthly basis. During August-December 2012, fluctuations in tilt were associated with changes in the summit glacier's mass as well as variability due to local temperature changes.
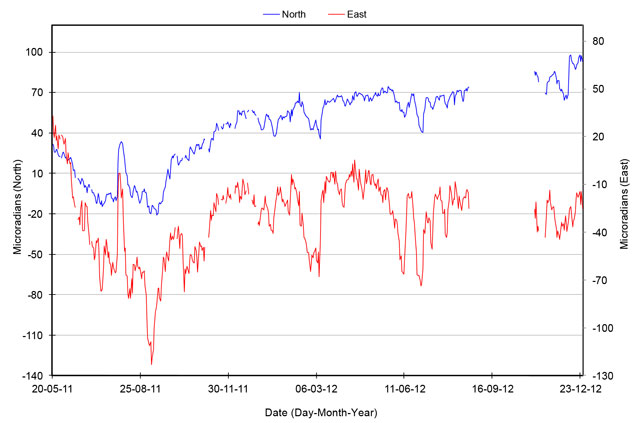 |
Figure 4. Tilt data from Nevado del Tolima was recorded from the Esmeralda (ESME) station during May 2011 through December 2012. Primary fluctuations in this data were caused by local temperature variations and changes in glacial mass; a data gap occurred during August-October 2012 due to network problems. Courtesy of SGC. |
Hazard assessment. Geologic mapping and a hazards analysis were conducted by Thouret and others (1995) (figure 5). They emphasized that they relied on the same appraisal methods as applied by Parra and others (1986) for Nevado del Ruiz. Three scenarios were developed based on three known events of different magnitudes (VEI 3, VEI 3-4, and VEI 4-5); the two plots within the lower left-hand inset map of figure 6 show the major characteristics of those scenarios.
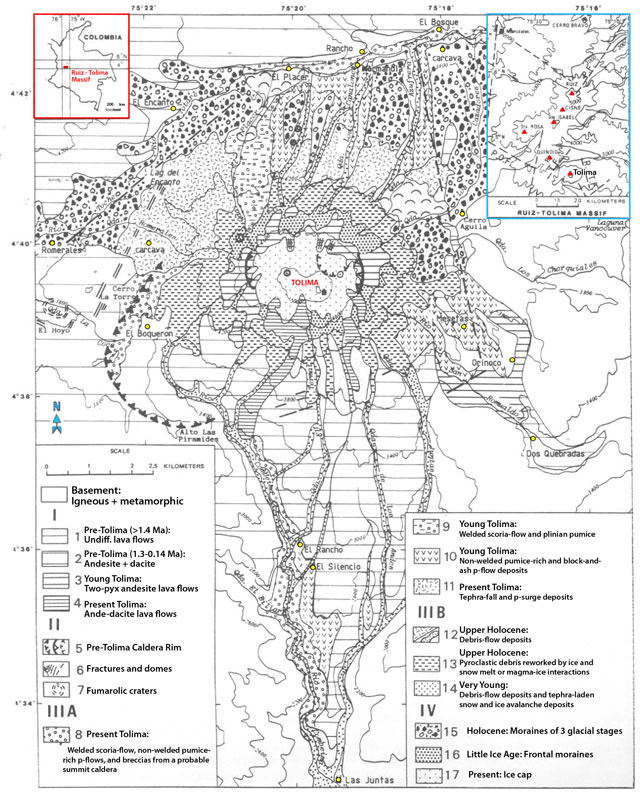 |
Figure 5. Stratigraphic, volcanic, and geomorphic map of Nevado del Tolima. Town locations are marked with yellow circles. Abbreviations of labeled faults within the blue-outlined inset map refer to the following: P.F.=Palestina Fault; O.-T.-F.=Otun-Pereira Fault; T.F.=Toche Fault; R.-T.F.=Recio-Tolima Fault. Modified from Thouret and others, 1995. |
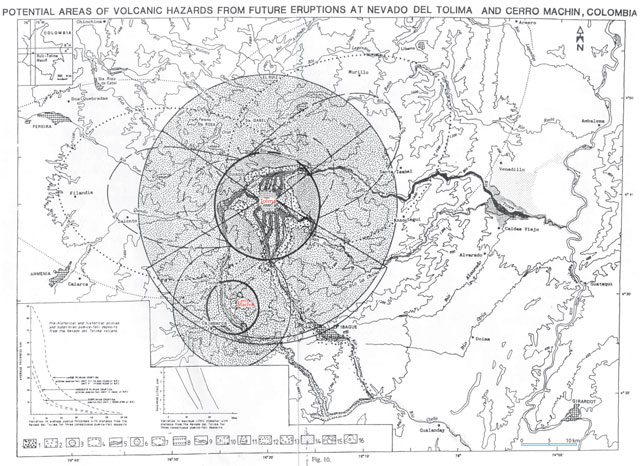 |
Figure 6. This hazard map for Nevado del Tolima also includes Cerro Machín (located ~20 km SSW). Based on the work by Thourest and others (1995), the small circles drawn around Nevado del Tolima and Cerro Machín encompass areas likely to be affected by subplinian ballistic ejecta, whereas larger circles encompass areas likely to be seriously affected by plinian tephra-fall. Modified from Thouret and others, 1995. |
Parameters for possible pyroclastic surges and ash-cloud surges were assessed for major valleys in the region, particularly Río Combeima, Río Totare and Río San Romualdo valleys, and the headwaters of Río Toche valleys (figure 6).
Rock or debris avalanches and lahars were also considered in the study; the authors stated that such events could be triggered by an earthquake or intrusion, and mobilized material had the likelihood of channelization within the deep Río Combeima gorge, a dangerous scenario due to the connectivity of the drainages that influence areas as distant as Ibague and Río Coello. Recent debris-flow deposits from volcanic and glacial sources dominated the aerial extent of the mapped region, particularly along the N slopes and within channels.
Thouret and others (1995) determined that lava flows would be the least hazardous phenomenon likely to occur; "extrusive activity [at Tolima] has been short-lived and is likely to produce block-lava flows such as those of young-Tolima age. Highly viscous and slow-moving block-lava flows could reach only 5-6 km when channeled, and likely move to the southeast or south. However, the very steep south flank would enable lava flows to travel more than 6 km if the chemical composition, physical properties, and hence viscosity of erupted magma changed."
Tolima glacial retreat. While hazards due to glacial ice interactions and volcanism were noted by some investigators (Thouret and others, 1995), other investigations of glaciers were conducted in this region due to interests in global climate change. An assessment conducted in 1976 concluded that five snowcapped volcanoes were present within the Parque Nacional de los Nevados: Tolima, Nevado del Ruiz (~25 km N of Tolima), Santa Isabel (~18 km NNW of Tolima), El Cisne (~20 km N of Tolima), and El Quindío (~10 km W of Tolima) (Hoyos-Patiño, 1998). According to Hoyos-Patiño (1998), El Cisne and El Quindío had almost lost their ice caps by 1976, maintaining less than 1 km2 of ephemeral snow- and ice-covered areas.
Glaciers and snowfields mapped by Landsat images of Tolima's summit in 1976 calculated a total area of 3.8 km2; aerial photo analysis from 1978 determined that 11 glaciers were present with a total area of 2.22 km2. Based on 2001 Landsat 7 image analysis by Morris and others (2006), the area of glacial extent was 1.26 km2; they calculated a loss of 43% from 1959 to 2001 (figure 7). For comparison, the largest ice loss from this region of Colombia occurred at Nevado del Ruiz, where ice coverage decreased from 21.4 km2 to 10.92 km2 during 1959-2001.
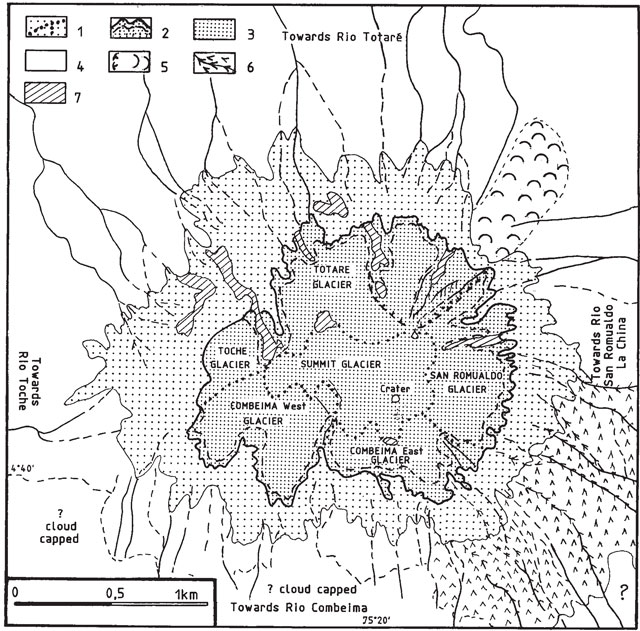 |
Figure 7. Glacier and generalized drainages of Tolima as drawn from 1959 aerial photography. Area 1 represents the total icecap area of 7 km2 as determined in 1959. Area 2 was thin ice that deglaciated between 1959 and 1987. Area 3 was glaciated during the Little Ice Age. Area 4 was Holocene and uppermost Pleistocene tephra incised by snowmelt-fed, narrow, deep gullies. Area 5 represents the prehistorical scar, mounds, and deposits resulting from a rockslide-debris avalanche off the NE flank. Area 6 includes young and deeply carved deposits from debris flows and tephra-laden ice-and-snow avalanches near the crater and on the SW flank. Area 7 includes high, steep, eroded intrusions, necks, and lava flows, from the pre-existing summit. From Thouret and others, 1995. |
References. Hoyos-Patiño, F., 1998: Glaciers of Colombia, p. I:11-30, in R. S. Williams and J. G. Ferrigno, eds: Satellite Image Atlas of Glaciers of the World: South America, U.S. Geological Survey Prof. Paper 1386-1, 1206 pp.
Morris, J.N., Poole, A.J., and Klein, A.G., 2006, Retreat of Tropical Glaciers in Colombia and Venezuela from 1984 to 2004 as Measured from ASTER and Landsat Images, 63rd Eastern Snow Conference, Newark, Delaware.
Thouret, J.C., Cantagrel, J-M., Robin, C., Murcia, A., Salinas, R., and Cepeda, H., 1995, Quaternary eruptive history and hazard-zone model at Nevado del Tolima and Cerro Machín volcanoes, Colombia. Journal of Volcanology Geothermal Research, 66 (1-4):397-426.
Geological Summary. The steep-sided, glacier-covered Nevado del Tolima volcano contrasts with the broad profile of Nevado del Ruiz to the north. The andesitic-dacitic younger Tolima formed during the past 40,000 years, rising above and largely obscuring a 3-km-wide late-Pleistocene caldera. The summit consists of a cluster of late-Pleistocene to Holocene lava domes associated with thick block-lava flows on the N and E flanks, and extensive pyroclastic-flow deposits. The summit contains a funnel-shaped crater 200-300 m deep. Holocene activity has included explosive eruptions ranging in size from moderate to Plinian, and the last major eruption took place about 3,600 years ago. Lava dome growth has produced block-and-ash flows that traveled primarily to the NE and SE. Minor explosive eruptions have been recorded in the 19th and 20th centuries.
Information Contacts: María Luisa Monsalve, Gloria Patricia Cortés, and Lina Constanza García, Servicio Geológico Colombiano (SGC), Volcanological and Seismological Observatory, Avenida 12 Octubre 15-47, Manizales, Colombia (URL: https://www2.sgc.gov.co/volcanes/index.html).