Report on Sangay (Ecuador) — July 2013
Bulletin of the Global Volcanism Network, vol. 38, no. 7 (July 2013)
Managing Editor: Richard Wunderman.
Edited by Julie A. Herrick.
Sangay (Ecuador) Ongoing thermal anomalies, ash fall and plumes continued through May 2013
Please cite this report as:
Global Volcanism Program, 2013. Report on Sangay (Ecuador) (Herrick, J.A., and Wunderman, R., eds.). Bulletin of the Global Volcanism Network, 38:7. Smithsonian Institution. https://doi.org/10.5479/si.GVP.BGVN201307-352090
Sangay
Ecuador
2.005°S, 78.341°W; summit elev. 5286 m
All times are local (unless otherwise noted)
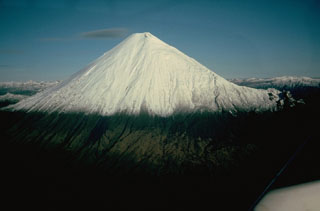
Previously reported activity from Sangay volcano (figure 11) included ash plumes and elevated temperatures (BGVN 36:01). In this report, we note that similar activity persisted during August 2011-May 2013. We highlight low-level unrest that was primarily detected with remote sensing instruments and pilot reports.
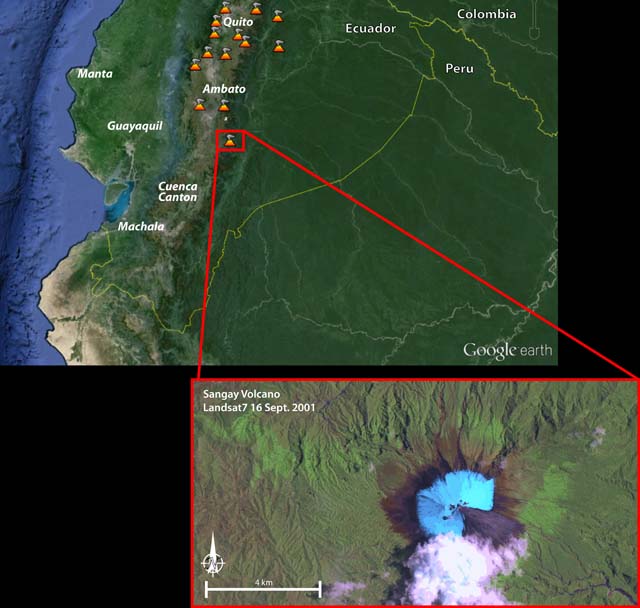 |
Figure 11. This Google Earth image of Sangay includes an inset (below) from Landsat 7 acquired on 16 September 2001. The exaggerated blue color distinguishes the snow-and-ice covered summit from regional clouds (white with magenta in locations where the cloud is thinning). Note the gray area in the SE sector, an eruptive event had recently occurred that covered (or potentially melted) the typically symmetrical snowcover. The scale bar is approximate. Courtesy of GoogleEarth and USGS/NASA. |
Ash plumes during 2011-2013. Notices from the Washington Volcanic Ash Advisory Center (VAAC) during this reporting period were primarily based on pilot reports and a weather station located in Guayaquil (MWO). There were seven significant plumes visible with satellite images; those plumes reached altitudes of altitudes 6-8 km a.s.l. (table 9). Ash plumes drifted to a maximum distance of 20 km from the summit.
A 25 January 2012 report from Instituto Geofísico-Escuela Politécnica Nacional (IG) (Special Report No. 01-2012) stated that activity at Sangay had intensified since 23 January. Pilot reports on 23 January were noted by the Washington VAAC with observations of ash moving SSE. Satellite images from 24 January noted thermal anomalies.
Table 9. Washington VAAC reports for Sangay during August 2011-May 2013. The following abbreviations are used: volcanic ash (VA) and meteorological watch observatory (MWO). No VAAC reports were released during June-August 2013, the remaining duration of this report. Courtesy of VAAC.
| Date | Type of plume | Altitude | Bearing | Remarks |
| 02 Aug 2011 | possible va emission | 6 km | -- | Pilot report of VA to 6 km altitude |
| 11 Oct 2011 | possible va emission | -- | -- | Guayaquil weather station |
| 25 Oct 2011 | ash plume | 6 km | E 9-19 km/h | Satellite images showed a plumes of gases and possible VA 19 km wide |
| 20 Nov 2011 | possible va emission | -- | -- | Pilot report and MWO OF VA |
| 08 Jan 2011 | possible va emission | -- | -- | Guayaquil weather station |
| 23 Jan 2012 | possible va emission | -- | -- | Pilot report and MWO of VA |
| 24 Jan 2012 | possible va emission | -- | -- | Weak hotspot in images |
| 22 Mar 2012 | possible va emission | -- | -- | Pilot report and MWO of VA |
| 23 Mar 2012 | possible va emission | -- | -- | Pilot report of VA |
| 11 May 2012 | possible va emission | -- | -- | Guayaquil weather station |
| 28 May 2012 | possible va emission | -- | -- | Guayaquil weather station |
| 04 Jun 2012 | possible va emission | 8 km | -- | Pilot report 8 km altitude and MWO of VA |
| 06 Jun 2012 | possible va emission | 6 km | -- | Pilot report 6 km altitude and MWO of VA |
| 10 Jun 2012 | possible va emission | -- | -- | Pilot report and MWO of VA |
| 11 Jun 2012 | possible va emission | -- | -- | Guayaquil weather station |
| 04 Jul 2012 | possible va emission | -- | -- | Pilot report of VA and MWO; a hotspot detected in multispectral imagery |
| 05 Jul 2012 | -- | -- | -- | Pilot report of VA; a hotspot visible in multispectral imagery |
| 06 Jul 2012 | -- | -- | -- | Weak hotspot in images |
| 20 Jul 2012 | possible va emission | -- | -- | Pilot report of VA |
| 21 Jul 2012 | possible va emission | -- | -- | Guayaquil weather station |
| 28 Jul 2012 | small emission | 7 km | W | Pilot report; in satellite images a small burst of gas through cloud layers was observed. |
| 25 Jan 2013 | possible va emission | -- | -- | Pilot report and MWO of VA; weak hotspot in images |
| 26 Jan 2013 | possible emission of gases and va | -- | -- | weak hotspot in images |
| 22 Feb 2013 | possible va emission | -- | -- | Pilot report and MWO of VA |
| 24 Feb 2013 | possible va emission | -- | -- | Pilot report and MWO of VA |
| 11 Apr 2013 | ash plume | 6 km | W | Visible satellite images showed a VA plume; event should dissipate over the next 3 hours. |
| 26 Apr 2013 | ash plume | 8 km | SW 9 km/h | A couple of weak VA emissions within 20 km of the summit; a hotspot was observed in images. |
| 23 May 2013 | possible va emission | -- | -- | Pilot report W at 8 km altitude and MWO of VA |
Elevated temperatures from the summit. Modvolc detected hotspots from February 2010 to early May 2013 (table 10). The elevated temperatures were detected around the summit area with as many as 3 pixels but typically one pixel per observation (figure 12). Hotspots were no longer visible after 4 May through August 2013.
Table 10. Hotspots from the region of Sangay were detected consistently during February 2010 through early May 2013. The Modvolc system uses the MODIS instrument on the Terra and Aqua satellites. Courtesy MODVOLC Thermal Alerts System.
| Date (UTC) | Time (UTC) | Pixels | Satellite |
| 25 Feb 2010 | 0345 | 1 | Terra |
| 15 Mar 2010 | 0330 | 1 | Terra |
| 30 Apr 2010 | 0345 | 1 | Terra |
| 16 May 2010 | 0345 | 1 | Terra |
| 03 Jun 2010 | 0330 | 1 | Terra |
| 12 Jul 2010 | 0340 | 1 | Terra |
| 18 Aug 2010 | 0655 | 1 | Aqua |
| 28 Sep 2010 | 0650 | 2 | Aqua |
| 30 Sep 2010 | 0335 | 1 | Terra |
| 02 Oct 2010 | 0325 | 1 | Terra |
| 07 Oct 2010 | 0345 | 1 | Terra |
| 11 Jan 2011 | 0345 | 1 | Terra |
| 02 Mar 2011 | 0330 | 1 | Terra |
| 06 Jun 2011 | 0330 | 2 | Terra |
| 29 Jun 2011 | 0635 | 1 | Aqua |
| 15 Jul 2011 | 0335 | 2 | Terra |
| 20 Jul 2011 | 0655 | 1 | Aqua |
| 07 Aug 2011 | 0345 | 1 | Terra |
| 14 Aug 2011 | 0350 | 1 | Terra |
| 23 Aug 2011 | 0640 | 1 | Aqua |
| 25 Aug 2011 | 0630 | 1 | Aqua |
| 05 Oct 2011 | 0620 | 1 | Aqua |
| 05 Oct 2011 | 1545 | 1 | Terra |
| 31 Oct 2011 | 0700 | 1 | Aqua |
| 29 Dec 2011 | 0640 | 1 | Aqua |
| 05 Jan 2012 | 0350 | 1 | Terra |
| 07 Jan 2012 | 0340 | 1 | Terra |
| 25 Jan 2012 | 0325 | 2 | Terra |
| 25 Jan 2012 | 0625 | 1 | Aqua |
| 08 Feb 2012 | 0635 | 1 | Aqua |
| 21 Feb 2012 | 0305 | 3 | Terra |
| 25 Mar 2012 | 0650 | 1 | Aqua |
| 10 Apr 2012 | 0350 | 1 | Terra |
| 12 Apr 2012 | 0335 | 1 | Terra |
| 25 May 2012 | 1835 | 1 | Aqua |
| 06 Jun 2012 | 0345 | 1 | Terra |
| 17 Jul 2012 | 0635 | 1 | Aqua |
| 26 Jul 2012 | 0330 | 1 | Terra |
| 29 Jul 2012 | 0400 | 2 | Terra |
| 17 Sep 2012 | 0645 | 1 | Aqua |
| 19 Sep 2012 | 0335 | 1 | Terra |
| 24 Feb 2013 | 0350 | 1 | Terra |
| 25 Mar 2013 | 0320 | 1 | Terra |
| 03 May 2013 | 0325 | 1 | Terra |
| 04 May 2013 | 0705 | 1 | Aqua |
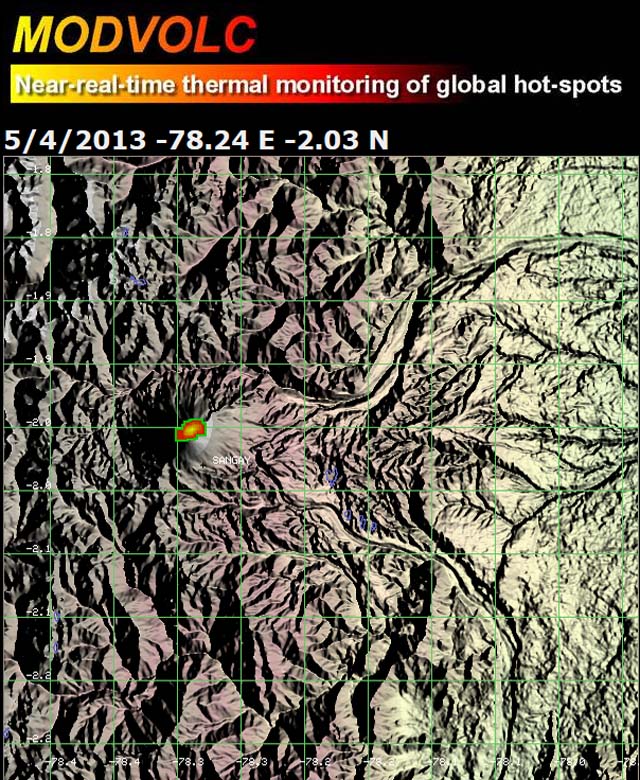 |
Figure 12. From 4 May 2013 to 4 May 2012, Modvolc detected 11 hotspots in the region of Sangay. These elevated temperatures were centered on and located within 3 km of the summit area. Courtesy of HIGP. |
Satellite images during 2012-2013. Significant cloudcover in the region of Sangay prohibited clear satellite views of volcanic activity. In Figure 13, four images were chosen for relatively unobstructed views, however, due to technical problems with a sensor onboard Landsat 7, black bands interfere with the images. Despite these challenges, bright snow is easily distinguished from the summit area and the disruptions of the typically white (altered to blue for higher contrast) summit suggest processes such as ashfall, lahars, or melting causing new exposures of underlying rock. Ash events were frequently documented as late as 23 May 2013 and it is clear in the 8 August 2013 image that the summit snow was no longer significantly disturbed.
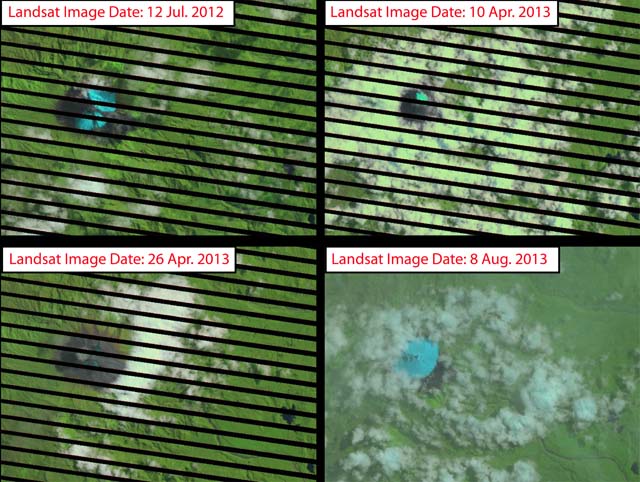 |
Figure 13. Satellite images from Landsat 7 (12 July 2012, 10 April 2013, and 26 April 2013) and Landsat 8 (8 August 2013) captured views of the changing conditions at Sangay. Snow and ice at the summit appears as bright blue while cloudcover is typically white with some magenta fringes; recent ashfall, lahars, or melting events have disrupted the symmetrical snow region in these images except for the image from 8 August 2013. Courtesy of USGS/NASA. |
References. NASA Landsat Program, 2001, Landsat ETM scene L71010061_06120010916, SLC-Off, USGS, Sioux Falls, Sept. 16, 2001.
NASA Landsat Program, 2012, Landsat ETM scene LE70100612012194ASN00, SLC-Off, USGS, Sioux Falls, July 12, 2012.
NASA Landsat Program, 2013, Landsat ETM scene LE70100612013100EDC00, SLC-Off, USGS, Sioux Falls, April 10, 2013.
NASA Landsat Program, 2013, Landsat ETM LE70100612013116EDC00, SLC-Off, USGS, Sioux Falls, April 26, 2013.
NASA Landsat Program, 2013, Landsat ETM scene LC80100612013220LGN00, SLC-Off, USGS, Sioux Falls, August 8, 2013.
Geological Summary. The isolated Sangay volcano, located east of the Andean crest, is the southernmost of Ecuador's volcanoes and its most active. The steep-sided, glacier-covered, dominantly andesitic volcano grew within the open calderas of two previous edifices which were destroyed by collapse to the east, producing large debris avalanches that reached the Amazonian lowlands. The modern edifice dates back to at least 14,000 years ago. It towers above the tropical jungle on the east side; on the other sides flat plains of ash have been eroded by heavy rains into steep-walled canyons up to 600 m deep. The earliest report of an eruption was in 1628. Almost continuous eruptions were reported from 1728 until 1916, and again from 1934 to the present. The almost constant activity has caused frequent changes to the morphology of the summit crater complex.
Information Contacts: Instituto Geofísico-Escuela Politécnica Nacional (IG), Casilla 17-01-2759, Quito, Ecuador (URL: http://www.igepn.edu.ec/); Washington Volcanic Ash Advisory Center (VAAC), Satellite Analysis Branch (SAB), NOAA/NESDIS E/SP23, NOAA Science Center Room 401, 5200 Auth Rd, Camp Springs, MD 20746, USA (URL: http://www.ospo.noaa.gov/Products/atmosphere/vaac/); and Hawai'i Institute of Geophysics and Planetology (HIGP) MODVOLC Thermal Alerts System, School of Ocean and Earth Science and Technology (SOEST), Univ. of Hawai'i, 2525 Correa Road, Honolulu, HI 96822, USA (URL: http://modis.higp.hawaii.edu/).