Report on Soufriere Hills (United Kingdom) — November 2013
Bulletin of the Global Volcanism Network, vol. 38, no. 11 (November 2013)
Managing Editor: Richard Wunderman.
Soufriere Hills (United Kingdom) By March 2014, an over 50-month-long decline in extrusion (Pause 5)
Please cite this report as:
Global Volcanism Program, 2013. Report on Soufriere Hills (United Kingdom) (Wunderman, R., ed.). Bulletin of the Global Volcanism Network, 38:11. Smithsonian Institution. https://doi.org/10.5479/si.GVP.BGVN201311-360050
Soufriere Hills
United Kingdom
16.72°N, 62.18°W; summit elev. 915 m
All times are local (unless otherwise noted)
A partial dome collapse took place at Soufrière Hills on 11 February 2010 (BGVN 35:03), an event followed by a lack of easily measured dome growth during an interval that continued into at least April 2014. Despite a lack of significant extrusion into the dome, pyroclastic flows continued, as did rockfalls and volcano-tectonic (VT) earthquakes. MVO describes intervals of this nature as extrusive pauses or more simply pauses. Pauses have been diagnosed as a prevalent behavior since they began following an extrusive phase starting in mid-1995. Our last issue (BGVN 36:08) covered part of the still-ongoing pause.
The various phases of activity at Soufrière Hills Volcano (SHV) during 1 January 1992 to 30 April 2013 are summarized in table 72. The table comes from a Montserrat Volcano Observatory (MVO) report providing a synthesis of activity during ~6 months ending in April 2013, and making authoritative and instructive comparisons to the overall eruption (table 72).
Table 72. Inventory of behavioral phases observed at SHV between 1 January 1992 and 30 April 2013. Pause 5 continued into at least April 2014. Taken from the MVO Scientific Report for Volcanic Activity between 13 October 2012 and 30 April 2013.
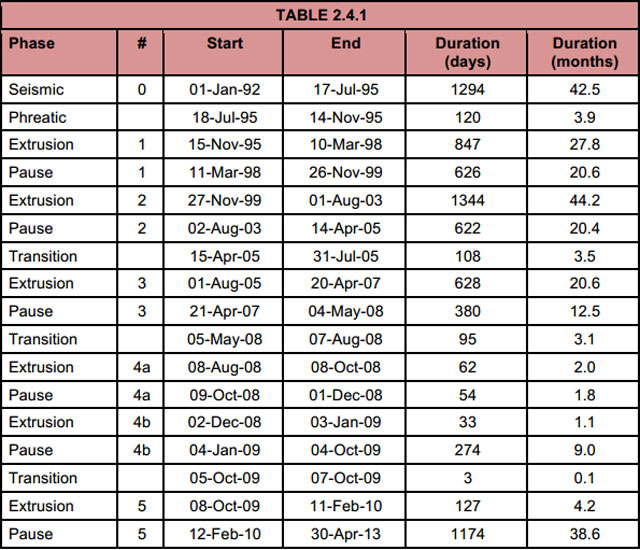 |
In brief, table 72 documents that an increase in seismicity occurred from 1992 to 1995, followed by a phreatic eruptive phase starting in mid-1995. That episode was followed by intervals of extrusion, transition, and pause. Extrusive phases included dome growth and frequent pyroclastic flows. During transition phases, dome growth slowed, but the risk to areas near the volcano continued.
As noted above, pauses are characterized by much slower dome growth (if at all), yet residual activity. The current pause is the longest yet recorded since the eruption began in 1995. Pause 5 began on 12 February 2010, and as of March 2014 was over 50 months long.
MVO established three criteria that indicate the potential for future activity. These criteria include low frequency seismic swarms and tremors, daily SO2 fluxes above 50 tons/day, and significant ground deformation. Most of the data reported in this Bulletin came from MVO Scientific Reports from 1 November 2011 to 30 April 2012, 1 May 2012 to 12 October 2012, and 13 October 2012 to 30 April 2013.
Short, intense swarms of VT earthquakes have occurred at Soufrière Hills since late 2007. The smaller swarms are often described by MVO as strings.
The most notable activity since September 2011 included intense Volcanic Tectonic (VT) earthquake swarms during 22-23 March 2012. Two small strings of VT events occurred in early August 2012, a brief VT string occurred on 24 December 2012, and a few VT strings of earthquakes took place during 4-6 February 2013.
The seismic events of 22-23 March 2012 and August 2012 were followed by ash venting. The venting in March resulted in the formation of two new craters. One developed inside the 11 February 2010 dome collapse scar; the other was outside the collapse scar to the (figure 91).
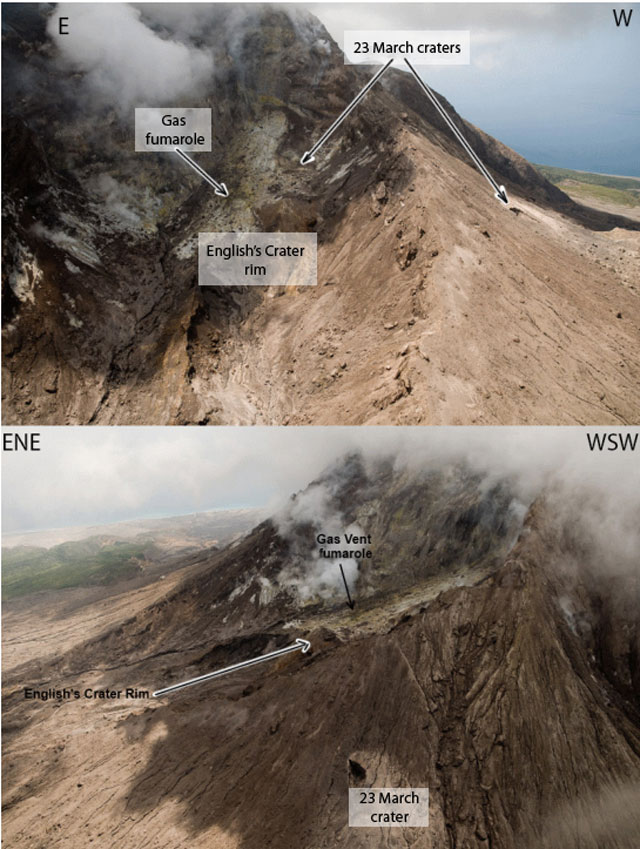 |
Figure 91. The craters at Soufrière Hills that formed following the intense VT earthquake swarms during 22-23 March 2012 are labeled in the above aerial photographs, taken by the Montserrat Volcano Observatory (MVO). The upper photo looks S into the 11 February 2010 collapse scar, and the lower photo looks E from above Gage's Mountain. Courtesy of MVO. |
On 20 November 2012, images of the S flank of the dome revealed a pervasively fractured area below the S rim of the explosion crater. That area was considered a potential source for large rockfalls or pyroclastic flows.
During the increased fumarole activity on 4-5 February 2013, a new crater was excavated around a gas vent on the floor of the 11 February 2010 collapse scar. This crater was 15 to 20 m across and 5 to 10 m deep.
The Hazard Level remained at 2, indicating daytime (0800 to 1600) access to Zone C and daytime-transit-only in maritime zone W (located W of the volcano; boats may sail through the zone but must not stop). A map of the zones on the island appeared in BGVN (22:05) and is found as figure 22 above.
Activity during 1 November 2011 to 30 April 2012. Throughout the entire reporting period, seismicity remained comparable to previous pauses in lava extrusion. Four strings of VT events, in this case referred to as "spasmodic bursts," occurred in the course of the interval 1 November 2011 to 30 April 2012. In early December 2011, 10 events were recorded in a 3 minute span; the largest in terms of local magnitude (ML, discussed further below) was 3.2. The 10 events were interpreted as a sequence of triggered events.
Two intense VT swarms occurred on 23 March 2012, with almost 50 VT earthquakes in each swarm. The largest VT earthquake ever recorded at Soufrière Hills, with ML of 3.9, was recorded during these swarms. The second more intense swarm was followed by mild ash venting, seven hybrid earthquakes, and three long-period (LP) earthquakes. Topics such as ML are discussed in a subsection below on seismicity.
On 30 March 2012, MVO detected unusually low-level VT seismicity sustained over several hours. This was atypical activity, as seismicity at Soufrière Hills is normally characterized by the occasional appearance of short bursts of VT strings.
November-December 2012. Seven lahars were seismically detected in the Belham Valley region during 1 November 2011 to 30 April 2012. Five took place during November-December 2011. They were associated with rainfall above 10 mm/hr.
A pyroclastic flow occurred in Gages Valley on 9 March 2012. The flow originated close to the summit of Chance's Peak and traveled 1.5 km down the W flank into Spring Ghaut. Although direct volume measurements couldn't be made, an empirical relationship between runout and flow volume suggested the pyroclastic flow deposit volume to be 104 m3.
A slight increase in rockfall activity occurred before the VT swarms of 23 March 2012. There were minor rockfalls on the steep N, E, SW and W sectors of the dome, averaging to less than one rockfall per day. The SW side of the dome above Gingoe's Ghaut was unstable with noticeable rockfall activity.
SO2 flux averaged 420 tons/day, a value below the multi-year eruption's average. Following the March VT swarms, a daily flux of 4,600 tons was observed, the third highest recorded by the optical spectrometer (DOAS) since its installation in 2002. After 2010, SO2 cycle fluctuations were dominated by variation with timescales on the order of weeks to months.
On 17 February 2012, a fumarole at the E base of the 2006-2007 dome was observed for the first time by MVO staff. An area with yellow and white sulfur deposits was also discovered on this cliff. Around January 2012, this site had temperatures near 60°C, but temperatures in February ranged from 90° to 275°C.
Ground deformation recorded by a GPS network continued to show a trend of ongoing inflation, a behavior similar to previous pauses.
Activity from 1 May 2012 to 12 October 2012. Among 21 bursts of small earthquakes, the most notable occurred on 11 September 2012. Over the course of 13 hours, a low amplitude VT swarm resulted in 17 events, with the maximum ML around 1.3. Eight rockfalls and two hybrid earthquakes were noted alongside typical seismic activity.
On 13 and 14 October 2012, tropical storm Rafael triggered eight seismically detected lahars in this region. The most noteworthy were those in the Belham Valley. Also, the SO2 flux was slightly decreased from the previous reporting period, with an average of 280 tons/day.
As of October 2012, the E and W flanks had been determined to be the most unstable areas of the edifice, based on the presence of fresh rockfall deposits and pyroclastic flows. A large pyroclastic flow from the W flank could travel into Plymouth, the former capital destroyed by previous pyroclastic flows.
On 29 August 2012, a large pyroclastic flow originated at the 2006-2007 dome. This has been the largest pyroclastic flow in Tar River since the end of Phase 5 extrusion. Another pyroclastic flow occurred on 19 September 2012 in Gage's Valley. It originated from the steep slope adjacent to Chance's Peak and traveled about 1 kilometer. The sources of these pyroclastic flows can be viewed in figure 92.
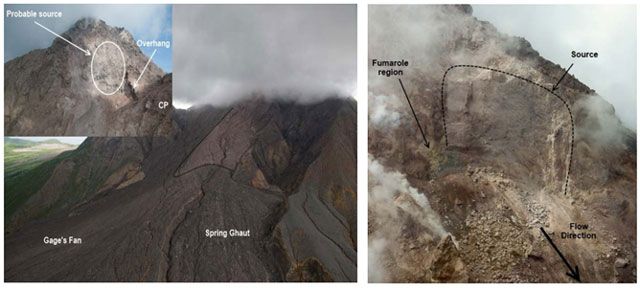 |
Figure 92. Two photographs showing features at Soufrière Hills. The photograph on the left shows the source of the 19 September 2012 pyroclastic flow. The photograph on the right shows the source and flow direction of the 29 August pyroclastic flow. Courtesy of MVO. |
A 10-minute exposure photo taken on 6 September 2012 determined no changes in location and number of incandescent areas on the N flank. However, the large fumarole in the floor of the 11 February 2010 collapse scar reached temperatures of ~300°C, and was the source of weak ash venting on 8 August 2012. Thermal IR camera imaging, showed the brightest point of incandescence, which reached temperatures over 400°C, originated from a hole in the rear of the collapse scar.
It should be noted that from August 2012 to November 2012, measurements at three local continuous GPS (cGPS) stations, AIRS, SPRI, and MVO1, had slight shortening of the radial distance between stations and vents, which may indicate short-term reversal of the long term inflation trend. Conclusions remain speculative without testing with more data.
Activity from 13 October 2012 to 30 April 2013. The largest of seven VT strings occurred on 30 November 2012. That swarm had a total of 23 earthquakes, with ML of 2.1 or less. As mentioned in the introduction, a brief VT swarm occurred on 24 December 2012, but the four swarms of main interest followed on 3-5 February 2013. The most intense, with a total of 36 events in 27 minutes, occurred on 4 February, with a maximum ML of 2.6. As a result, there was an increase in temperature of fumaroles residing on the 11 February 2010 collapse scar. This escalation continued until later in the evening, and at 1750 loud roaring sounds were heard, accompanied by minor ash venting. Activity and temperature returned to background levels the next day. This activity was noticeably similar to the events of 23 March 2012. Both were preceded by smaller VT strings, about 11 hours earlier, and the most intense phase had a 10-minute duration. There followed a VT string on 5 February associated with minor ash venting from the main gas vent in the floor of the 11 February 2010 collapse scar, as shown in figure 93.
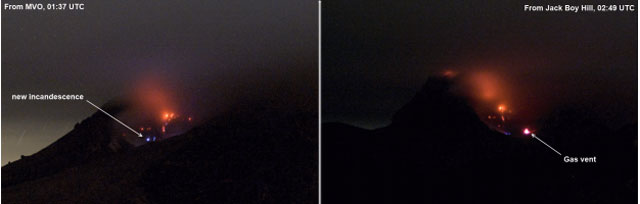 |
Figure 93. Two thermal images, viewed from MVO and Jack Boy Hill, show the source of the ash venting on 5 February 2013, as well as a newly observed incandescence. Courtesy of MVO. |
The next prominent seismic activity occurred on 15 and 19 April 2013. The earthquakes had ML of 3.0 and 2.9, respectively, and neither were part of a VT string. The last time isolated VT earthquakes occurred was 28 June and 9 October 2011. Beside VT strings, 15 low-frequency earthquakes, which encompassed long-period and hybrid events, were observed during the October 2012 to April 2013 recording period. As of April 2013, 51 VT strings have occurred, and 13 have directly preceded surface activity.
Heavy rainfall on 28 and 30 March 2013 generated large lahars, lasting several hours, in various valleys around Soufrière Hills, including Belham Valley. The average daily SO2 flux, as of April 2013, was 511 metric tons/day, with a high of 2,381 tons on 6 February 2013. This was the highest value observed since the ash venting of 23 March 2012. The connection between SO2 flux and VT activity is still not thoroughly understood, but there seems to be an increase of SO2 a few days before seismic events at Soufrière Hills.
Pyroclastic flow activity had followed the trends of previous pauses. On 28 March 2013, a pyroclastic flow traveled 1.5 km E through Tar River Valley. This pyroclastic flow began at a peeled-away slab of lava on the near-vertical E face of the dome. This was one of the largest pyroclastic flows since the start of Pause 5, and it removed a large portion of the lava slab on the 2006-2007 dome. This flank became heavily fractured as a result of weather and erosion, continued cooling, and contraction of the E flank of the dome above Tar River. Consequently, the Tar River side of the dome will likely be the source of future pyroclastic flow activity. Rockfall activity has been at its lowest since 10 February 2010, consistent with the stabilization of the dome over the past three years.
After 5 February 2013, temperatures in the collapse scar were ~100°C higher than previously recorded. That increase may be due to MVO's use of a new more sensitive IR camera (a FLIR T650sc), replacing their old (Mikron) camera. The new camera records temperatures that are corrected for atmospheric conditions.
Figure 94 emphasizes the difference in sensitivity between the two cameras. However, the distance at which these images were captured, about 5.7 km from the dome, results in unreliable temperature readings. This is because infrared light is absorbed, scattered, and refracted by dust, air, and water (in solid, liquid, or gaseous states). Variables such as solar reflection, heat from direct sunlight, condensates, and high concentrations of SO2 in the atmosphere can also result in errors in image readings.
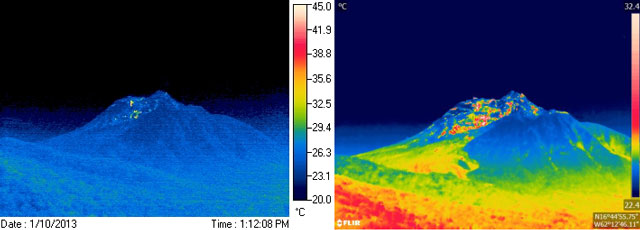 |
Figure 94. For Soufrière Hills, a juxtaposition of thermal images to highlight the difference in resolution and displays between the old infrared-detecting (IR) camera (left) and the more sensitive and accurate new one (right). Although there are temperature scales to the right of each image (22.4-32.4 on the scale at right), they are not applicable in this instance owing to multiple factors (see text). Even at this distance, IR images give scientists greater clarity on dome behavior. Despite the loss of the temperature scale, the images serve as an important tool for monitoring the state of the dome. Both IR photos taken during early 2013. Courtesy of MVO. |
According to Adam J. Stinton, a volcanologist at MVO, the new camera produces images twice the size of the older camera due to a larger internal sensor, and therefore the right-hand image was scaled down to a comparable size. Thermal imaging technology works by recording the intensity of radiation in the infrared part of the electromagnetic spectrum and converting it to a radiometric image, with every pixel in the image conveying a temperature measurement.
Using the FLIR camera, a strong fumarole on the summit of the 2006-2007 dome was recorded on 15 March 2013, the first time this fumarole was ever imaged. Its temperature was between 250 and 260°C. No other new thermal features or incandescence had been recorded during this period.
As of April 2013, the trend of long-term edifice inflation continued. This suggested that the magmatic system is still actively deforming surficial areas. MVO observed similar deformation signals during previous pauses in extrusion.
Activity during April 2013 to March 2014. On 14 January 2014, a helicopter assessment of several groups of fumaroles revealed temperatures of 140-340°C within the summit crater. These fumaroles were observed for the first time since 2011. Aside from this detection, there has been a low level of activity at Soufrière Hills, including occasional rockfalls and seismic activity.
Background on seismicity. According to Druitt and Kokelaar (2002), hybrid earthquakes are long-period earthquakes located at (shallow) depths of less than 2 km. LP earthquakes, on the other hand, are widely interpreted as earthquakes associated with the movement of pressurized fluids (eg., BGVN 20:08).
According to MVO, using ML offers possible advantages when calculating cumulative VT energy. The Gutenberg-Richter magnitude-energy relationship portrays an earthquake's size based on the amplitude of the resulting waves recorded on a seismogram. The concept is that the wave amplitude portrays the earthquake's size once the amplitudes are corrected for the decrease in magnitude with distance owing to geometric spreading and attenuation (Stein and Wysession, 2003). Local magnitude (often also termed Richter magnitude or the Richter scale). MVO employs the following (base 10) logarithmic equation, which associates ML to cumulative VT energy, E, as follows: Log E = 1.5 × ML + 11.8
MVO notes that this equation is a reliable calculation of cumulative energy, as opposed to amplitude measurements at a single station. Amplitude measurement data are easily affected by variables such as data gaps. As further background, magnitudes can be negative for very small displacements (eg. a small rockfall). Stein and Wysession (2003, p. 263) make the point that seismic magnitude scales are logarithmic, ". . . so an increase from magnitude "5" to "6," indicates a ten-fold increase in seismic wave amplitude. Measured displacements range more than 10 units because the displacements measured by seismometers span more than a factor of 1010." In practice, the amplitude is measured in microns of displacement after the effects of the seismometer are removed. Different magnitude scales (eg., ML, mb, Ms, Mw, etc.) yield different values (Stein and Wysession, 2003).
References: Cole, P., Bass, V., Christopher, T., Melander, S., Pascal, K., Smith, P., Stewart, R., Stinton, A., and Syers, R., undated, MVO Scientific Report for Volcanic Activity Between 1 May 2012 and 12 October 2012, Open File Report OFR 12-02; Montserrat Volcano Observatory, 47 pp. (URL: http://www.mvo.ms/pub/Open_File_Reports/MVO_OFR_12_02-MVO_Scientific_Report.pdf)
Cole, P., Bass, V., Christopher, Odhert, H., Smith, P., Stewart, R., Stinton, A., Syers, R., and Williams, P., undated, MVO Scientific Report for Volcanic Activity Between 1 November 2011 and 30 April 2012. Montserrat Volcano Observatory, (URL: http://www.mvo.ms/pub/Open_File_Reports/MVO_OFR_12_01-MVO_Scientific_Report.pdf)
Druitt, T. and Kokelaar, B., 2002, The Eruption of Soufriere Hills Volcano, Montserrat, form 1995 to 1999, Issue 21. Geological Society Memoir No. 21. UK: The Geological Society Publishing House, 2002.
Stein, S. and Wysession, M., 2003, An Introduction to Seismology, Earthquakes and Earth Structure, 2003, Blackwell Publishing, Oxford, 498 pp. [ISBN 0-86542- 078-5]
Stewart, R., Bass, V., Christopher, T., Cole, P., Dondin, F., Higgins, M., Joseph, E., Pascal, K., Smith, P., Stinton, A., Syers, R., and Williams, P., (27 May) 2013, MVO Scientific Report for Volcanic Activity Between 13 October 2012 and 30 April 2013, Open File Report, OFR 13-06. Montserrat Volcano Observatory. (URL: http://www.mvo.ms/pub/Open_File_Reports/MVO_OFR_13_06-Six_monthly_report.pdf )
Geological Summary. The complex, dominantly andesitic Soufrière Hills volcano occupies the southern half of the island of Montserrat. The summit area consists primarily of a series of lava domes emplaced along an ESE-trending zone. The volcano is flanked by Pleistocene complexes to the north and south. English's Crater, a 1-km-wide crater breached widely to the east by edifice collapse, was formed about 2000 years ago as a result of the youngest of several collapse events producing submarine debris-avalanche deposits. Block-and-ash flow and surge deposits associated with dome growth predominate in flank deposits, including those from an eruption that likely preceded the 1632 CE settlement of the island, allowing cultivation on recently devegetated land to near the summit. Non-eruptive seismic swarms occurred at 30-year intervals in the 20th century, but no historical eruptions were recorded until 1995. Long-term small-to-moderate ash eruptions beginning in that year were later accompanied by lava-dome growth and pyroclastic flows that forced evacuation of the southern half of the island and ultimately destroyed the capital city of Plymouth, causing major social and economic disruption.
Information Contacts: Montserrat Volcano Observatory (MVO), Fleming, Montserrat, West Indies (URL: http://www.mvo.ms/); Washington Volcanic Ash Advisory Center (VAAC); and Adam Stinton, MVO.