Report on Aira (Japan) — January 2014
Bulletin of the Global Volcanism Network, vol. 39, no. 1 (January 2014)
Managing Editor: Richard Wunderman.
Aira (Japan) Frequent explosions during 2012-13; ashfall on Kagoshima City
Please cite this report as:
Global Volcanism Program, 2014. Report on Aira (Japan) (Wunderman, R., ed.). Bulletin of the Global Volcanism Network, 39:1. Smithsonian Institution. https://doi.org/10.5479/si.GVP.BGVN201401-282080
Aira
Japan
31.5772°N, 130.6589°E; summit elev. 1117 m
All times are local (unless otherwise noted)
This report summarizes activity at Sakura-jima (a cone within the Aira caldera) between August 2012 and December 2013. Data were largely provided by the Japan Meteorological Agency (JMA) and the Tokyo Volcanic Ash Advisory Center (VAAC). Monthly JMA reports of volcanic activity have been translated into English since October 2010. These reports can be viewed online (see reference section below).
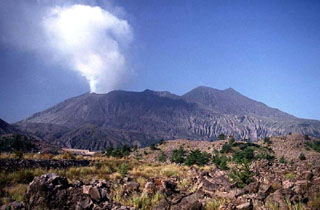
Sakura-jima has been the subject of repeated reports here, many reporting recent explosions (BGVN 31:06, 36:10 and 37:05). Pepe and others (2013) remarked that at Sakura-jima, "Explosive eruptions of Vulcanian type, with ash emissions, have occurred intermittently from 1955 to 2002. From 2009 to December 2012, a strong and continuous period of volcanic activity has been recorded mainly at the Showa Crater producing plumes that reached altitudes of 1.8-3.5 km." JMA (2013) commented that resumption of eruptions at the Showa crater in June 2006 marked a return of activity at this vent after 58 years. It is also noteworthy that during this reporting interval no multi-week-long break in eruptions took place. In other words, the eruptions discussed below all took place within a larger a larger episode ongoing since 2006.
The locations of Sakura-jima and the nearby Kagoshima City are shown in figure 41. The city of Kagoshima sits 8 km W of the volcano and is home to over 600,000 residents. Sakura-jima has several craters, including the currently active Showa crater and the Minamidake crater (figures 42 and 43).
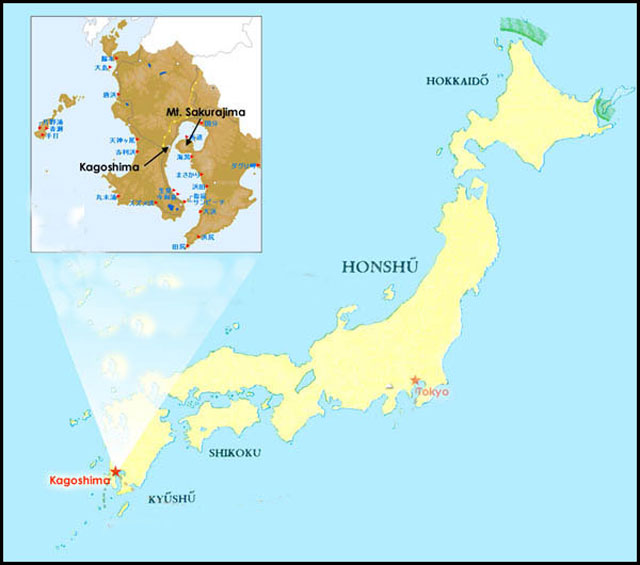 |
Figure 41. (Larger map) Main islands of Japan showing location of Sakura-jima. (Inset map) Sakurajima with respect to Kagoshima City. Revised from an original by Jim Markowich and Sandy Mayer. |
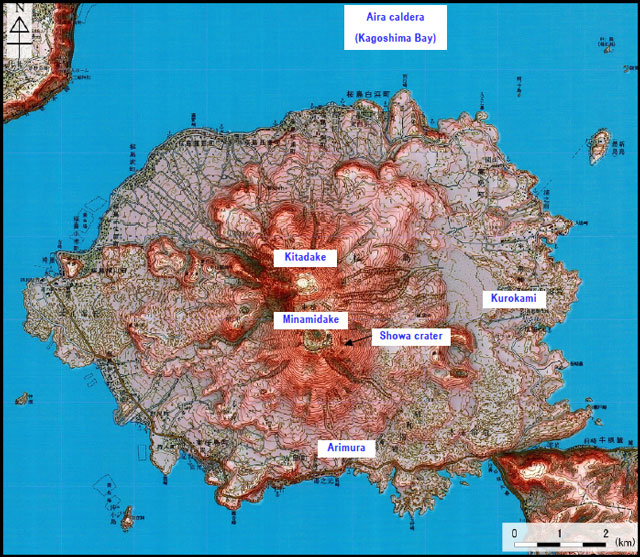 |
Figure 42. Topographical map of Sakura-jima, which lies on the southern boundary of the 17 x 23 km diameter Aira caldera. Courtesy of Geospatial Information Authority of Japan (GSI). |
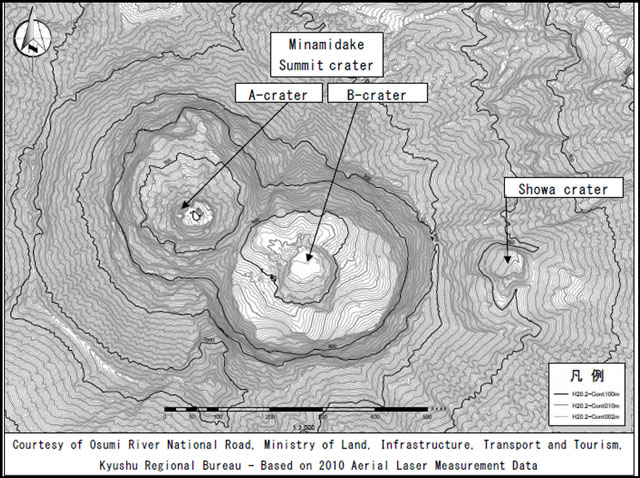 |
Figure 43. Topographical map of the central crater area of Sakura-jima, showing relationship of Showa and Minamidake craters. Map was based on 2010 aerial laser measurement (LIDAR) data. Courtesy of the Japanese Ministry of Ministry of Land, Infrastructure, Transport and Tourism, Osumi Office of River and National Highway (Kyushu Regional Development Bureau). |
According to JMA, during this reporting interval (August 2012 to December 2013) eruptive activity at Showa crater remained high and volcanic seismicity remained relatively low (table 17). Earthquake hypocenters were located at depths ranging from 0-4 km below sea level under the volcano. The average sulfur dioxide fluxes taken during JMA field surveys were relatively high (800-4,100 metric tons/day, table 17).
Table 17. For the interval August 2012-December 2013 numerous eruptive events, including explosions, took place without significant hiatus. The number of eruptions, earthquakes, and tremor, and average sulfur dioxide fluxes measured monthly. "Total eruptions" include the explosive eruptions. Average SO2 levels are based upon 1-4 field surveys per month. Data compiled from JMA monthly reports. NR means not reported.
| Month | Total eruptions | Explosive eruptions | Number of earthquakes | Tremor | Average SO2 level (t/d) |
| August 2012 | 59 | 43 | 370 | 270 | 2,600-3,300 |
| September | 73 | 48 | 349 | 283 | 2,700-3,700 |
| October | 61 | 35 | 736 | 500 | 2,100-5,700 |
| November | 71 | 55 | 635 | 363 | 2,100-2,200 |
| December | 55 | 43 | 813 | 453 | 1,200-1,400 |
| January 2013 | 124 | 96 | 1,058 | 230 | 1,700-4,100 |
| February | 132 | 119 | 746 | 321 | 800-1,900 |
| March | 74 | 61 | 552 | 321 | 2,800 |
| April | 17 | 14 | 287 | 56 | 1,600-2,300 |
| May | 70 | 58 | NR | NR | 2100-3400 |
| June | 18 | 17 | NR | NR | 2200 |
| July | 128 | 83 | NR | NR | 1,600-2,200 |
| August | 144 | 118 | NR | NR | 1,400 |
| September | 154 | 110 | NR | NR | 2,200-2,900 |
| October | 127 | 87 | NR | NR | 900-2500 |
| November | 69 | 50 | NR | NR | 900-1,500 |
| December | 40 | 22 | NR | NR | 1,700-1,800 |
Showa crater had frequent explosions that commonly ejected tephra and/or ballistics up to 1.3-1.8 km from the crater, according to JMA reports. During explosive eruptions from August 2012 through July 2013, ash plumes rose to a maximum height of 2 to 3.5 km above the crater rim. From August through November 2013, the maximum heights ranged from 4 to 5 km. The Tokyo VAAC issued numerous advisories during this reporting period. Occasionally, incandescence was observed at night with high-sensitivity cameras, and infrequently with the naked eye.
On 7 October 2012, a very small pyroclastic flow was observed for the first time since 6 June 2012; it flowed 300 m E. Small pyroclastic flows were also observed on 30 November and 26 December 2012, both of which flowed 500 m E. Very small pyroclastic flows were sporadically observed in 2013.
Table 18 shows the monthly ash fall measurements and the computed mass of ash falling in Kagoshima. The total amount of ashfall for 2012 was 6.6 million tons, compared to 4.5 million tons in 2011. The overall 2012 burden was the largest since the resumption of activity at Showa crater in 2006, As seen in table 18, during October 2013 an estimated 1 metric ton of ash fell on Kagoshima, the largest amount since the activity resumed at Showa crater in 2006.
Table 18. The mass of ash that fell on the city of Kagoshima during August 2012-December 2013. The measurements of density of ashfall burden were measured at the Kagoshima Local Meteorological Observatory (KLMO), 10 km W of Showa crater. The total estimated amount of ashfall on the City in millions of metric tons was estimated by the Kagoshima prefectural government. "NR" means not indicated in JMA monthly reports.
| Month | Measurement at observatory (KLMO) (g/m2) | Total mass on City ( x 109 kg) |
| August 2012 | 142 | 0.34 |
| September | 194 | 0.4 |
| October | 153 | 0.3 |
| November | 137 | 0.5 |
| December | 13 | 0.5 |
| January 2013 | 11 | 0.4 |
| February | 24 | 0.8 |
| March | 8 | 0.6 |
| April | 0.5 | 0.2 |
| May | 74 | 0.5 |
| June | 4 | 0.1 |
| July | 2 | 0.7 |
| August | 59 | 0.7 |
| September | 906 | 0.8 |
| October | 720 | 1.0 |
| November | 7 | 0.5 |
| December | NR | NR |
Larger explosions with greater effect occurred during August-November 2013. On 18 August 2013, an explosion produced a large plume that rose to 5 km above the crater rim and drifted NW (figure 44). According to a news account (Associated Press), the plume height was the highest since JMA starting keeping records in 2006. Ash fell over a wide area from Kagoshima City to Koshikijima Island (about 70 km WNW of Kagoshima City) in amounts large enough to cause suspension of public transportation in Kagoshima City (figure 45). The explosion produced a small pyroclastic flow that flowed about 1 km SE of Showa crater. This report quoted a Kagoshima official as saying that the 18 August explosion was Sakura-jima's 500th eruption that year.
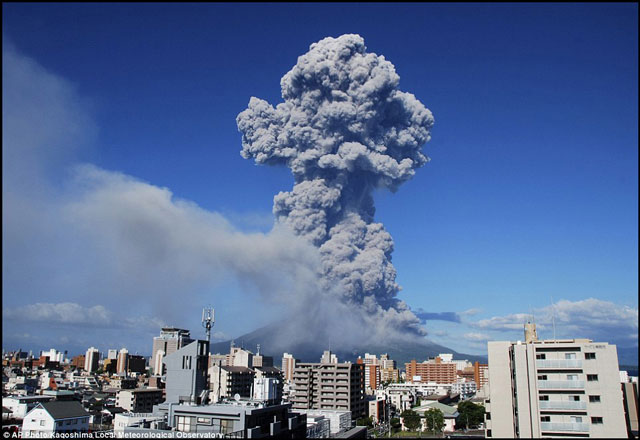 |
Figure 44. Photo of Sakura-jima on 18 August 2013, taken from Kagoshima City, looking E. Courtesy of AP Photo/JMA's Kagoshima Local Meteorological Observatory. The plume rose to 5 km above the crater rim (or about 6 km in altitude). |
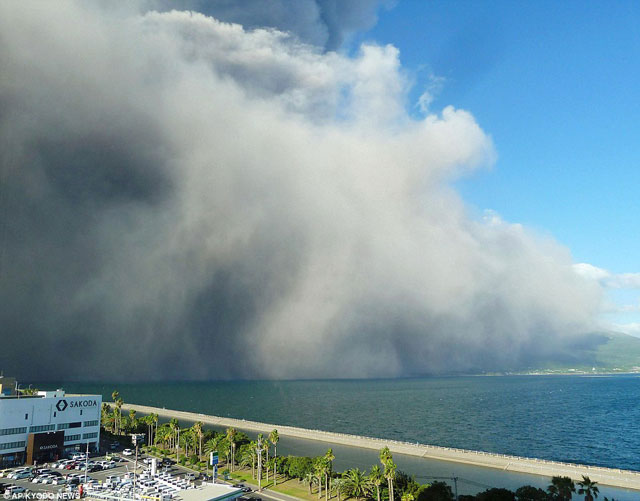 |
Figure 45. E-looking view showing an ash plume from Sakura-jima on 18 August 2013 sweeping towards Kagoshima City. According to a news report (Associated Press), residents were urged to cover up and wear masks. Courtesy of AP Photo/Kyodo News. |
On 29 August 2013, a large plume rose to 3 km above the crater rim and drifted ENE. Volcanic ash fell on an area from Sakura-jima Island to Miyazaki City (about 80 km NE of the volcano), and lapilli with a diameter of 1 cm fell on the Kurokamicho area of Kagoshima City (about 4 km E of Showa crater).
Another explosion on 4 September 2013 produced a relatively large plume that rose to 2.8 km above the crater rim and rapidly drifted S. Lapilli with diameters of up to 4 cm fell on small communities up to 3 km S of Showa crater, breaking the windows of more than ten cars and causing other damage. Smaller lapilli were found around Tarumizu City Hall (about 8 km SSE of the crater). A similar explosion on 25 September produced 2-cm lapilli that fell on another community about 3 km S of the crater, causing similar damage to car windows.
On 15 October 2013, lapilli with a diameter up to 3 cm fell on a community 3.5 km SW of Showa crater. Another explosion on 24 October resulted in 1-cm lapilli falling on a community about 5 km NW of the crater. Neither eruption caused any damage.
An explosion on 24 November 2013 produced a large plume that rose 4 km above the crater rim and drifted NE. Ash and 7-mm diameter lapilli fell on nearby communities. Lapilli with diameters of 1-1.5 cm also fell on a community 4 km SE of the crater on 18, 26, and 29 November.
Nearby Minamidake crater to the W of Showa crater was quiet during most months during the reporting period. According to JMA, Minamidake produced an occasional very small eruption beginning 20 October through the end of the year. In 2013, small eruptions were observed in January, August, November, and December.
Deformation. Pepe and others (2013) used satellite interferometry (InSAR) to create 44 interferograms for the years 2006-2012. They found the deformation complex, possibly the result of multiple inflation-deflation cycles. They stated, "The preliminary analysis of the mean deformation velocity reveals the presence of a consistent uplift signal in the North region of the Sakurajima Island that extends also to the North sector of Kagoshima bay. The corresponding deformation time series are characterized by a strong non-linear behavior. More specifically, the general uplift trend is found, interrupted by low amplitude subsidence phenomena. Finally, we argue that the complexity of detected deformation time series could be interpreted as the effect of cyclical periods of inflation and deflation."
Ground deformation measured with a water-tube tiltmeter installed 2.5 km SE of the Minamidake summit crater (by Japan's Ministry of Land, Infrastructure, Transport and Tourism, MLIT), found an almost static state after February 2012, changing around August 2012 to slight subsidence. During February 2013, this same instrument detected a slight uplift. Although other research groups deployed deformation instruments during this time, their data were not widely available.
In addition, JMA reported that an analysis of measurements of a satellite-based GNSS (Global Navigation Satellite System) suggested inflation around February 2013. In contrast, between July-December 2013, deformation was either almost negligible or slightly tended toward contraction.
Further background. More descriptive information is available in the National Catalog of the Active Volcanoes in Japan (JMA, 2013). The following extracts several key points from a much longer paragraph in that document. First, Sakurajima is an andesite-dacite composite volcano located on the southern rim of the Aira caldera. The SiO2 content of the rocks is between 56.5 and 67.2 wt %. Second, it is composed of two main cones-Kitadake and Minamidake-as well as numerous parasitic cones.
References: Japan Meteorological Agency, 2013 National Catalogue of the Active Volcanoes in Japan (The Fourth Edition, English Version), Japan Meteorological Agency (JMA), Accessed online June 2013 (URL: http://www.data.jma.go.jp/svd/vois/data/tokyo/STOCK/souran_eng/menu.htm)
Japan Meteorological Agency, Monthly volcanic activity reports (URL: http://www.data.jma.go.jp/svd/vois/data/tokyo/eng/volcano_activity/monthly.htm ).
Miwa, T, 2013, Temporal variation in volcanic ash texture during a vulcanian eruption at the Sakurajima volcano, Japan. Journal of Volcanology and Geothermal Research, v. 260.
Pepe, S., Trippanera, D., Casu, F., Tizzani, P., Nobile, A., Aoki, Y., Zoffoli, S., Acocella, V., and Sansosti, E., 2013, The 2006-2012 deformation at Sakurajima stratovolcano (Japan) detected via spaceborne multisensor SAR Interferometry, EGU General Assembly Conference Abstracts, 2013, Vol. 15, EGU2013, pp. 11748 (URL: http://adsabs.harvard.edu/abs/2013EGUGA..1511748P ).
Geological Summary. The Aira caldera in the northern half of Kagoshima Bay contains the post-caldera Sakurajima volcano, one of Japan's most active. Eruption of the voluminous Ito pyroclastic flow accompanied formation of the 17 x 23 km caldera about 22,000 years ago. The smaller Wakamiko caldera was formed during the early Holocene in the NE corner of the caldera, along with several post-caldera cones. The construction of Sakurajima began about 13,000 years ago on the southern rim and built an island that was joined to the Osumi Peninsula during the major explosive and effusive eruption of 1914. Activity at the Kitadake summit cone ended about 4,850 years ago, after which eruptions took place at Minamidake. Frequent eruptions since the 8th century have deposited ash on the city of Kagoshima, located across Kagoshima Bay only 8 km from the summit. The largest recorded eruption took place during 1471-76.
Information Contacts: Tokyo Volcanic Ash Advisory Center (VAAC), Tokyo, Japan (URL: http://ds.data.jma.go.jp/svd/vaac/data/); Japan Meteorological Agency (JMA), Otemachi, 1-3-4, Chiyoda-ku Tokyo 100-8122, Japan (URL: http://www.jma.go.jp/); Geospatial Information Authority of Japan (GSI) (URL: http://www.gsi.go.jp/ENGLISH/); Japan's Ministry of Land, Infrastructure, Transport and Tourism (URL: http://www.mlit.go.jp/en/index.html); and Associated Press (AP) (URL: https://www.ap.org/).