Report on Sangay (Ecuador) — February 2014
Bulletin of the Global Volcanism Network, vol. 39, no. 2 (February 2014)
Managing Editor: Richard Wunderman.
Sangay (Ecuador) Absence of evidence for ongoing eruption; new hazard maps
Please cite this report as:
Global Volcanism Program, 2014. Report on Sangay (Ecuador) (Wunderman, R., ed.). Bulletin of the Global Volcanism Network, 39:2. Smithsonian Institution. https://doi.org/10.5479/si.GVP.BGVN201402-352090
Sangay
Ecuador
2.005°S, 78.341°W; summit elev. 5286 m
All times are local (unless otherwise noted)
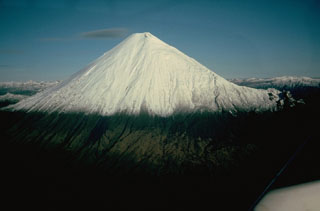
Previously reported activity from Sangay volcano (figure 14) included ash plumes as late as 23 May 2013 and satellite infrared thermal alerts ending in early May 2013 (BGVN 36:01). In that previous report, satellite thermal alerts from the MODVOLC system were noted to have persisted and as late as 4 May 2013. That lack of alerts continued as late as 16 July 2013 when the MODVOLC website was last checked. Since that reporting, there have been no new updates regarding Sangay on the website of the Instituto Geofisico (IG), the aviation reports have not mentioned Sangay, and other news of Sangay behavior has also been generally lacking.
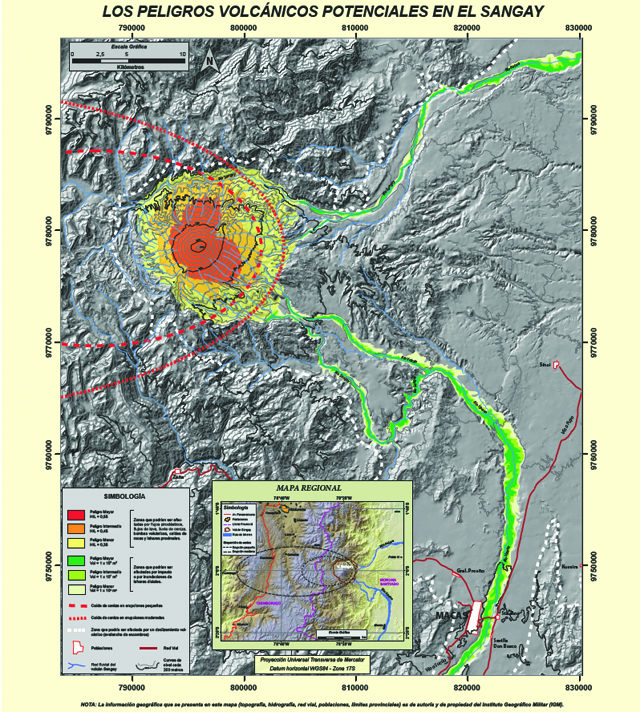 |
Figure 14. (Inset at bottom) A regional map showing Sangay with respect to large rivers and other features surrounding Sangay. Orange line is the PanAmerican highway, which passes near Río Bamba on the map's N. Major rivers (blue) are primary routes of lahars. (Main map) A hazards map for Sangay made with hazards focus and compiling the results of multiple kinds of modeling. Key (in Spanish) notes that the upper three colors were based on slope angle (H/L) with text noting gradation of hazards in those regions from pyroclastic flows, lava flows, ash falls, volcanic bombs, rock falls, and proximal lahars. The lower three colors on the key represent inferred gradations of lahar hazard at distance from the volcano. Dashed envelopes in red refer to boundaries for small and moderate sizes of ash falls. White line shows inferred boundary for an E directed debris avalanche. Base map is from the Instituto Geografico Militar (IGM). Taken from an online poster by Ordóñez and others, 2014). |
Absence of MODVOLC and aviation alerts does not necessarily translate to a lack of eruptions. The MODVOLC system imposes a reasonably high threshold to the infrared data acquired from space. Factors such as weather conditions, snow pack, and geometry of the vent area may play a role. Emissions of spatter, ash fall, and small pyroclastic flows could easily be missed. Assessments are generally best made in conjunction with information at the volcano. The current eruption began on 8 August 1934 and is thus far confirmed only through 23 May 2013.
Hazard modeling and products. In late 2013 to early 2014 IG released a poster discussing Sangay hazards (Ordóñez and others, 2014), some of the results of which we reprint here (figures 14, 15, and 16). Figure 14 contains IGEPN's recently published a map of volcanic hazards associated with Sangay, which resides in the Cordillera Real between the cities of Río Bamba and Macas. The IG and others have generally considered Sangay one of the most active volcanoes in South America. The poster noted historical records of its eruptive activity dating back to 1628 (Hall, 1977) and in the last century some important periods of activity were recorded during 1903, 1934-1937, 1941-1942, 1975-1976, and 1995 to the present (Monzier et al.. 1999). Observations of surface activity carried out in the past 40 years allowed scientists to recognize some important morphological changes at the summit of the volcano, including the emergence of new craters, dome growth, extrusion of lava flows, local explosions and ash emissions, and relatively small pyroclastic flows.
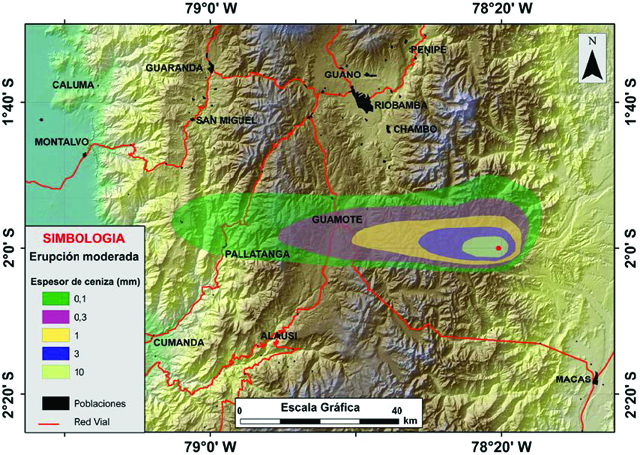 |
Figure 15. Modeled ash fall blanket from a hypothetical eruption at Sangay of moderate size. The key (in Spanish) refers to the colors in the key and on the isopach map, with thicknesses in millimeters. Taken from an online poster by Ordóñez and others (2014). |
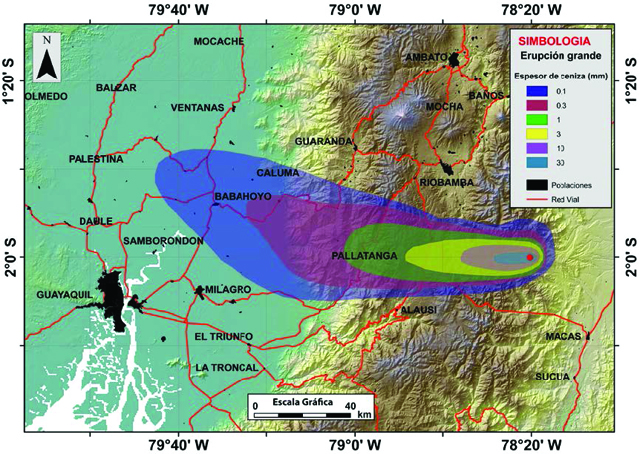 |
Figure 16. Modeled ash fall blanket from a hypothetical eruption at Sangay of large size. The key (in Spanish) refers to the colors in the key and on the isopach map, with thicknesses in millimeters. Taken from an online poster by Ordóñez and others (2014). |
A larger suite of volcanic hazards models is not shown here but includes results VolcFlow. Ash3D, Tephra2, and LAHARZ. The data used for the simulations were obtained from the few geological studies in this volcano (Hall, 1977; Monzier et al, 1999; Johnson et al, 2003). Sangay is judged in some ways analogous to Tungurahua volcano, because of its chemical composition, and it similar lava rheology and eruptive style of volcanic flows.
During August-September 2013, IG installed seismic monitoring instruments (broad band and infrasound ) and for the measurement of sulfur dioxide (SO2) in the southwestern flank of the volcano Sangay. These tools facilitate the monitoring of internal and surface activity of the volcano which will give an early warning of a potential hazards.
With regard to monitoring, during August-September 2013 IG personnel installed ~4 km southwest of Sangay volcano, permanent telemetered monitoring system consisting of a broadband seismic sensor, infrasound, and gas monitoring.
Figures 15 and 16 show the respective modeled results for a moderate and large eruption. To define the zones affected by ash fall, the modeling used the following computer routines based on assumptions and approaches discussed in the literature: Ash3d (Mastin and others, 2012) and Tephra2 (Banadonna and others, 2005). Some input data came from inferences and interpretations of descriptions by Monzier and others (1999) and from analogy with recent eruptions at Tungurahua. Plume heights were assumed to reach 10-15 km in altitude and the magma volumes in the plumes were assumed to be on the order of 0.001-0.005 km3 (dense-rock equivalent, DRE). Wind field data came from the Global Forecast System (NOAA, US National Weather Service, Environment Modeling Center). LAHARZ (Schilling, 1998), a modeling approach, was also taken to estimate the extent and coverage of lahars seen in figure 14. (The poster includes other maps on this topic as well.)
References. Bonadonna, C, Connor CB, Houghton BF, Byrne M, Laing A, Hincks T., 2005, Probabilistic modeling of tephra dispersal: Hazard assessment of a multi-phase eruption at Tarawera, New Zealand; J. Geophys. Res., 110, B03203.
Hall M. (1977). El Volcanismo en Ecuador. Publicación del Instituto Panamericano de Geografía e Historia, Sección nacional del Ecuador, Quito. 120pp.
Mastin, L, Schwaiger H, Denlinger R., 2012, User's Guide to Ash3d: A 3-D Eulerian Atmospheric Tephra Transportation and Dispersion Model, U.S. Geological Survey Open File Report.
Monzier M, Robin C, Samaniego P, Hall M, Cotten J, Mothes P, Arnaud N., 1999, J. Volcanol. Geotherm. Res. 90, 49-79.
Ordóñez J., Vallejo S., Bustillos J., Hall M., Andrade D., Hidalgo S., and Samaniego P., (Document created, December 2013; Accessed online July 2014), Volcan Sangay---Peligros Volcanicos Potenciales, Instituto Geofísico, Escuela Politécnica Nacional (IG-ESPN) (URL: http://www.igepn.edu.ec/volcan-sangay/mapa-de-peligros.html ).
Schilling S. (1998). LAHARZ: GIS programs for automated mapping of lahar-inundation hazard zones. US Geological Survey Open-File Report 98-638; 79 pp.
Geological Summary. The isolated Sangay volcano, located east of the Andean crest, is the southernmost of Ecuador's volcanoes and its most active. The steep-sided, glacier-covered, dominantly andesitic volcano grew within the open calderas of two previous edifices which were destroyed by collapse to the east, producing large debris avalanches that reached the Amazonian lowlands. The modern edifice dates back to at least 14,000 years ago. It towers above the tropical jungle on the east side; on the other sides flat plains of ash have been eroded by heavy rains into steep-walled canyons up to 600 m deep. The earliest report of an eruption was in 1628. Almost continuous eruptions were reported from 1728 until 1916, and again from 1934 to the present. The almost constant activity has caused frequent changes to the morphology of the summit crater complex.
Information Contacts: Instituto Geofísico-Escuela Politécnica Nacional (IG), Casilla 17-01-2759, Quito, Ecuador (URL: http://www.igepn.edu.ec/); Washington Volcanic Ash Advisory Center (VAAC), Satellite Analysis Branch (SAB), NOAA/NESDIS E/SP23, NOAA Science Center Room 401, 5200 Auth Rd, Camp Springs, MD 20746, USA (URL: http://www.ospo.noaa.gov/Products/atmosphere/vaac/); and Hawai'i Institute of Geophysics and Planetology (HIGP) MODVOLC Thermal Alerts System, School of Ocean and Earth Science and Technology (SOEST), Univ. of Hawai'i, 2525 Correa Road, Honolulu, HI 96822, USA (URL: http://modis.higp.hawaii.edu/).