Report on Pacaya (Guatemala) — May 2014
Bulletin of the Global Volcanism Network, vol. 39, no. 5 (May 2014)
Managing Editor: Richard Wunderman.
Pacaya (Guatemala) Sudden, bomb-laden explosions of 27-28 May 2010; extra-crater lava flows
Please cite this report as:
Global Volcanism Program, 2014. Report on Pacaya (Guatemala) (Wunderman, R., ed.). Bulletin of the Global Volcanism Network, 39:5. Smithsonian Institution. https://doi.org/10.5479/si.GVP.BGVN201405-342110
Pacaya
Guatemala
14.382°N, 90.601°W; summit elev. 2569 m
All times are local (unless otherwise noted)
Pacaya, which in recent years has consistently erupted olivine-bearing high alumina basaltic lavas, erupted with remarkable violence on both 27 and 28 May 2010 with an explosion on the 27th lasting ~45 minutes. This was followed by a smaller explosion the next day that generated a plume assessed from satellite and meteorological data as reaching 13 km altitude. In this report we describe those events as explosions in order to distinguish them from the ongoing, decades-long, and often effusive eruption generally seen at Pacaya. The terms 'explosion' and 'explosive' appear warranted given such factors as the suddenness of escalation, the ~13 km plume altitude (~10 km over the summit when measured during the weaker explosion on the 28th, the density of projectiles, and the scale of the tephra fall. The term explosion seems consistent with common practice (Sparks, 1986; Fiske and others, 2009).
The following report emphasizes Pacaya's behavior in 2010, including the 27 and 28 May explosions and impacts continuing into early June 2010. Our last report (BGVN 34:12) discussed behavior into mid-January 2010. Some of the reporting came from reports of Guatemalan agencies (eg. INSIVUMEH and CONRED, acronyms spelled out in the Information contacts section at bottom), newspapers (eg. Prense Libra, 2010a, b), videos and photos, and cited manuscripts and papers. It especially benefited from a draft manuscript prepared by Rüdiger Escobar Wolf (REW, 2014) and graciously provided to Bulletin editors. REW also provided reviews, insights, and numerous tailored graphics but bears no responsibility for possible errors induced by Bulletin editors.
The explosions were preceded months to weeks earlier by extra-crater venting of lava flows on the E and SE flanks. The lava flows covered substantial areas after emerging effusively at two widely spaced vents in atypical extra-crater or crater-margin locations.
Subsections address the following topics: (1) the Guatemalan hazard agency CONRED's reports, (2) a sample of available video and photo documentation of Pacaya's behavior, (3) events prior to the 27 May explosion, (4) the explosions and some of the impacts, (5) the seismic record showing the pattern of escalation around the time of the explosions, (6) a brief summary of the critical initial aviation reports, and (7) a geotechnical slope stability study that suggests gravitational instability at Pacaya, particularly owing to the cone's magma pressure and seismic loading.
Pacaya , which has a record of eruptions dating back over 1,600 years, has been erupting the majority of the time since 1961, often emitting rough-surfaced lavas but also occasionally discharging explosions. The centerpiece of the National Park of the same name, it is the most often climbed volcano in Guatemala. There have been 69 prior Smithsonian-published reports describing behavior from 1969 to early January 2010 (CSLP 03-70 to BGVN 34:12). REW (2013) ranked the 27 May explosions as sub-plinean and the associated lava emissions as the largest since similar events in 1961.
Figure 42 shows two simplified regional maps of Guatemala and neighboring countries including Mexico, Belize, Honduras, and El Salvador.
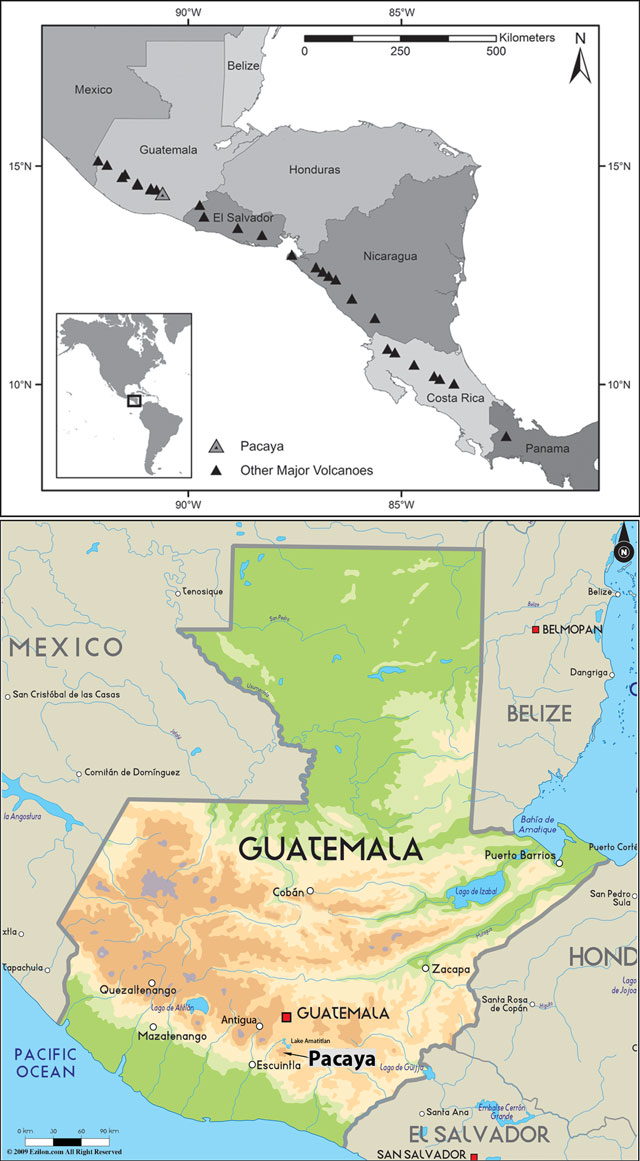 |
Figure 42. (Top) A map showing Pacaya's location in Central America. (Bottom) A map emphasizing Pacaya's location with respect to the central portion of Guatemala City (red square labeled 'Guatemala'). The larger combined urban area associated with that Capital city stretches well beyond the square symbol and contains ~3.5 million residents. AmatitlÁn was heavily damaged by Pacaya's May 2010 ashfall and the knock-on effects of Tropical Storm Agnes that arrived two days later. Top map taken from Morgan and others (2012); bottom map revised from a base map found online at Ezilon Maps. |
The larger tephra blanket spread N, covering an area of more than 1,000 km2 including the bulk of the Guatemala City metropolitan area, the largest city in Central America, population ~3.5 million. The City's center lies ~25 km NNE of Pacaya's summit but a 5-km-wide strip of urban and suburban development now stretches from its older core (red square, figure 42)to ~9 km N of the summit. The tephra shut down La Aurora, the county's primary international airport and among the region's busiest, for 5 consecutive days.
The 27 May 2010 explosion destroyed or damaged nearly 800 houses in nearby communities, forcing ~2,000 residents to evacuate and injuring 59 people. A high density of ballistics fell on nearby hamlets and villages, particularly those 2.5-3.5 km N of the MacKenny cone (El Cedro, San Francisco de Sales, and Calderas). The ballistics had sufficient mass and velocity to puncture roofs with a density on the order of one puncture per square meter in some places. Many more smaller ballistics bent but did not penetrate the corrugated sheet metal roofs common in many of the region's dwellings. Some of the ballistics were sufficiently hot to start fires.
Ash caused widespread damage locally, and up to ~8 cm of ash fell on parts of metropolitan Guatemala City, the nation's capital, centered ~35 km NNW of Pacaya. Up to 20 cm of tephra accumulated at and near Pacaya. According to available census data, the population within 10 km of Pacaya was 57,000 (John Ewert, USGS-CVO, personal communication).
Accounts from Guatemalan meteorological stations reported that detectable ash from the 2010 explosions fell as far away as the Caribbean coast. Brianna Hetland was both a graduate student in volcanology and a US Peace Corps Volunteer in Guatemala during 2010-2012. Hetland noted in a message that she had spoken with another Volunteer who said ash had blanketed his neighborhood near Coban (in Samac, Alta Verapaz) ~180 m N of Pacaya (figure 42, bottom). Hetland documented post-eruptive conditions at Pacaya, composed a blog on the impact and clean up, and gave a talk on those aspects as well as multifaceted monitoring conducted by fellow students and faculty at Michigan Technological University (Hetland, 2012a, b; Walikainen, 2010).
Some of the impacts of the freshly fallen ash were amplified and other impacts were diminished by heavy rains and flooding due to Tropical Storm Agatha that struck the region 2 days later, with some areas receiving 0.9 m of rain. The floodwater run carried ash that dislodged debris, clogged drainage systems, left thick deposits on valley floors, and damaged many bridges. The scale of the combined disasters led to more analysis of hardships, mitigation, and economic impact than usual at many eruptions, as exemplified by the detailed assessments by Wardman and others (2012). Those authors visited in the aftermath from New Zealand in order to study impacts that might be analogous to hazards elsewhere. They found that one moderating impact of the rain was to cee crops, which were washed clean of ash and residual acids. The authors also found that that a prompt and efficient cleanup was initiated by the Capital municipality to remove tephra from the 2,100 km of roads in the Capital. An estimated 11,350,000 m3 of tephra was removed from the city's roads and rooftops.
Diminishing strombolian activity and lava flows in the crater area continued into at least late June 2010. By this time the emissions had become more like the generally effusive decades-long eruption, which was still ongoing when this was written in late 2014. In addition to the information here, Pacaya's discharge rates have been summarized for the years 2004-2010 on the basis of infrared satellite images (Morgan and others, 2013). As would be expected, a strong peak in radiance developed in late May 2010.
REW (2013) noted one death attributed to the explosion and tephra fall and 179 deaths attributed to the Tropical Storm. Two people died at Pacaya days prior to the explosion of 27 May 2010. Wardman and others (2013) mentioned two further deaths due to people cleaning tephra from roofs.
Geochemical analysis of material erupted on 27 and 28 May is not yet reported. As background, Matías and others (2012) describe Pacaya's recent lavas as all high-alumina basalts with SiO2 contents of 50-52.5 weight percent and MgO contents of 3-5 weight percent. Common phynocrysts (visible minerals) included plagioclase, olivine, and opaque minerals (Conway, 1995). There is a slight variation of CaO in this group of lavas, which suggests a phenocryst enrichment or depletion. The lava compositions have remained broadly similar since 1961, and for many previous lavas as well, although some more felsic compositions are represented at older flank eruptions (Eggers, 1971).
CONRED reports. Perspective on the disaster can be gained from the chronology and content of announcements issued by CONRED (the Guatemalan agency for disaster reduction; Coordinadora Nacional para la Reducción de Desastres, table 4). These will be referred to in text by "CONRED" followed by their bulletin number.
Table 4. A summary of key CONRED information bulletins issued relevant to Pacaya's May 2010 eruption (http://conred.gob.gt/). After Escobar Wolf (2012) in addition to a similar table by Wardman and others (2012). Not all bulletins are included in this table.
| Date | CONRED Bulletin | Summary |
| 10 Feb 2010 | 564 | Called attention to lavas emitted on the E to S flanks. |
| 17 May 2010 | 708 | Recommended the National Park restrict access to the lava flows. |
| 26 May 2010 | 726 | Eruptive activity increased during the day, generating plumes of 1 km above the vent that dispersed fine tephra onto neighboring villages. Recommended closing access to Park. Warned air traffic authorities about risks to aviation. |
| 27 May 2010 | 729 | Began to mobilize staff to villages near volcano around 1500 on the 27th, to discuss and implement pre-emptive evacuation. Seven shelters were prepared in San Vicente Pacaya to accommodate refugees. When the paroxysmal phase of eruption started (after 1900), evacuation of villages to the W (El Rodeo and El Patrocinio) was already underway, however, tephra and ballistics were dispersed primarily to the N and the villages of El Cedro, San Francisco de Sales and Calderas were the most severely affected. |
| 28 May 2010 | 731 | Declared Red Alert. As of 1239 on the 28th over 1600 people had been evacuated from the villages of San Francisco de Sales, El Rodeo, El Patrocinio, El Cedro, Calderas, and Caracolito. They moved to San Vicente Pacaya. Civil Aviation authorities closed La Aurora International Airport due to tephra fall. The Ministry of Education closed schools in Escuintla, Sacatepequez and Guatemala departments. Access to the National Park remained restricted. The municipality-level response agency (with a similar name, COMRED, not CONRED) was activated in Villa Canales. It set up shelters in the municipal auditorium, a church, and the municipal hall. Advised citizens on managing the tephra fall. |
| 28 May 2010 | 734 | Thus far the eruption had injured 59 people, killed 1, and prompted the evacuation of nearly 2000. |
| 08 May 2010 | 735 | In the afternoon at 1424 on the 28th, high eruptive vigor resumed and tephra again fell on Guatemala City, but in much smaller quantities than during the previous day. |
| 29 May 2010 | 748 | By this time, a total of 2635 people were in shelters due to the eruption; ~400 houses had been slightly damaged and 375, severely damaged. |
| 27 May 2011 | 1673 | One year later; a retrospective summary of civil defense responses to the eruption and the larger engulfing disaster, tropical storm Agatha. |
Events prior to the energetic 27 May explosion. Figure 43 highlights Pacaya's vent locations (1961 to 2009 vents as green dots), including the two new E and SE flank vents that emitted lava flows (red areas). Changes in eruption behavior preceded the 27-28 May explosions by several months.
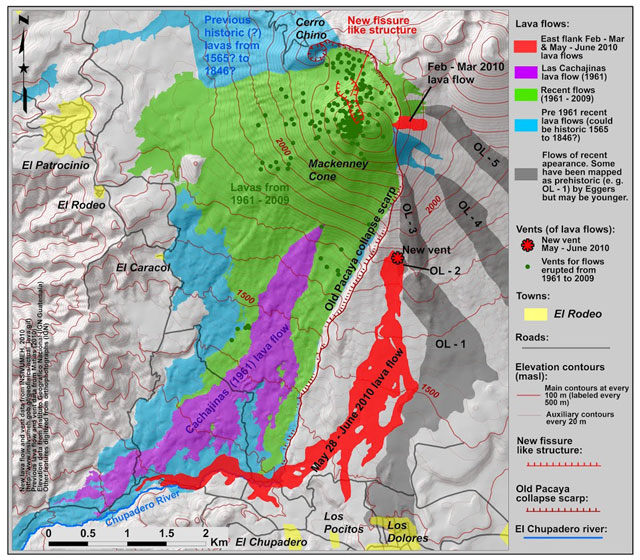 |
Figure 43. Simplified geological map of Pacaya, based on cited references, INSIVUMEH mapping, and GOES satellite data. The key at right calls attention to features such as the collapse scarp forming the N and E of margin of the main crater and the lava flows of prehistoric age (Eggers, 1969, 1972; Bonis, 1993) through about mid-2010. Migrating vents mapped during 1961-2012 (Matías, 2010; Rose and others, 2012) appear as dark-green dots (many clustered on or near the MacKenney cone's summit). The red areas on the SE flank and E flank represent lava with the noted age constraints from REW's analysis of satellite data. The SE flank vent had emitted by mid-2010 a field of lava approaching the size of the 1961 Cachiajinas lava flow (purple). The latter flow both vented and advanced within Pacaya's collapse scarp. In contrast, the SE flank flow was the first in historical times to vent and flow outboard of the scarp. The cone residing on Pacaya's NW rim, Cerro Chino, enters discussion frequently in this report. Note the depression (notch or trough) here labeled "New fissure like structure." Map created and provided by REW. |
From 2004 to around the end of 2009, Pacaya's eruptive intensity was often low. A clear sign of changes took place in February 2010 when lava flows emerged at vents on the S and SE flanks (table 4). These vents sit well outboard of the usual points of lava emission, which have in recent decades been limited to spots within the central crater, an area bounded by a large engulfing collapse scarp (a Somma rim; Eggers, 1969; figure 43). The two previously mentioned deaths occurred on 18 April when, according to the news, they were hit by a rock avalanched caused by an explosion. By 17 May, SE flank lava flows had reached 1.5 km long and the Park began restricting access (table 1). The scene on the SE flank appears in figure 44.
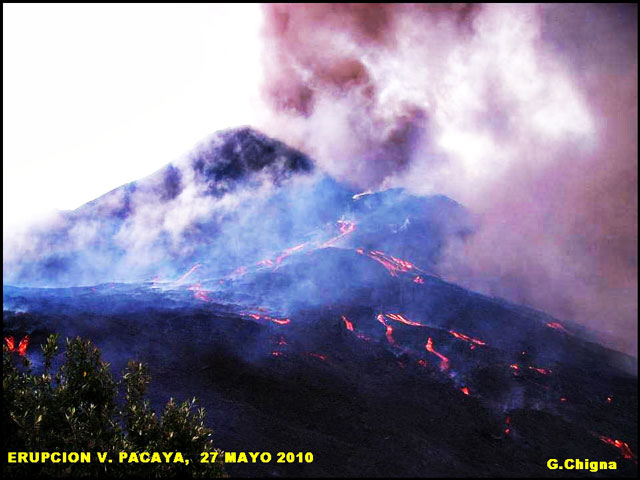 |
Figure 44. Pacaya's SE flank eruption as seen during the day on 27 May 2010. The ultimate distribution of lavas appears on the preliminary map by REW (2014). Image courtesy of Gustavo Chigna (INSIVUMEH). |
Earlier on the 27th (prior to the explosion), INSIVUMEH volcanologist Gustavo Chigna looked out over the crater area and counted at least 16 distinct vents emitting lava. Chigna was surprised, and his comment was something like 'It looked like water gushing out of a sieve.' That scale of new extrusive sites helped alert authorities that the volcano's behavior had escalated well beyond the norm and led to restricting public access to Pacaya.
During the 5 years prior to the 27 May 2010 explosion, sporadic vent openings limited to the MacKenney cone and adjacent areas (particularly the N crater) extruded lava flows (green dots, figure 43). Many of the resulting lava flows were each only active for periods of days to months. INSIVUMEH sometimes reported multiple simultaneous lava flows from distinct vents on the cone, which occurred, for example, during April 2009. Most of the lava was confined to the main crater or portions downslope and W of the E-bounding collapse scarp. The case in 2005 illustrated that the topographic boundary associated with the NE segment of the collapse scarp had diminished in places to the point where lava flows could cross the scarp (BGVN 33:08).
Around January 2010, Gustavo Chigna (INSIVUMEH) indicted the end of mainly lower effusive activity ongoing since 2004. The new upsurge fed several lava flows from vents on Pacaya's main cone. In harmony with this comment, the video by Crossman (2009) indicates that on 24 December 2009 the volcano emitted considerable lava. Venting was effusive and at both the MacKenney cone's summit and base. Visible plumes were nearly absent.
Table 5 lists a small sample of available videos taken at Pacaya that aid in documenting its behavior. The table includes videos taken before, during, or shortly after the 27 May explosion, with the two pre-explosion videos capturing behavior relevant to this subsection. The videos from other parts of the table are discussed in appropriate sections below.
Table 5. Some photos and videos that advance understanding of Pacaya behavior during December 2009 to about 2 June 2010 (a week after the explosion). The cases presented are a sample, not an exhaustive list. Compiled by Bulletin editors.
| Video (V) or Photo (P) and source | Date acquired / Date posted if clearly stated) |
Title; Content; URL How cited in text of this report |
| V; Patrick R. Crossman | 24 Dec 2009 / 24 Dec 2011 | Title: 'Hiking the Pacaya volcano in Guatemala' This video chronicles a group visiting Pacaya amid ongoing effusive volcanism in comparatively calm conditions and with people in many scenes. Some parts of the video depict a narrow (1- to 2-m wide), channelized, slowly moving lava flow. That flow appears to vent near the base of the MacKenney cone, devoid of visible plume, and traverses a region of low incline. The path of the molten flow is sinuous rather than linear. The visitors roast marshmallows in radiant heat from the flows. The video also cuts to scenes at the MacKenney cone's summit, where a larger flow several meters wide vents in a stable, effusive manner, also devoid of an associated plume. http://www.youtube.com/watch?v=Y62ZbfRBDmM Cited in text as Crossman, 2011 |
| V & P; H. Paul Moon (Zen Violence Films, LLC) | 01 April 2010 / 24 April. [Date confirmed with Moon and by comparison to his dated still photos] | Title: 'Pacaya Volcano, Guatemala [1080p HD]' Close up views showing copious lava flowing down the E flank from the new vent there. Accompanies GPS record of hiking track and still photos. Music accompanies the video. Dovetails with a Landsat image from about a week earlier, which also documents the E flank lavas. See text for more discussion. http://www.youtube.com/watch?v=Hr7VAVUBOhk http://vimeo.com/hpmoon/pacaya Associated link shows GPS path on a satellite image. Cited in text as Moon, 2010 |
| V; RT news channel (original authorship not provided) | -- / 28 May 2010 | Title: 'Video of Guatemala Pacaya volcano eruption' Compact, powerful strombolian explosions throwing molten ejecta vertically from multiple vents, or an elongate vent such as a fissure in Pacaya's crater (see photo below in figure 52). http://www.youtube.com/watch?v=fFoF57KX2yU Cited in text as RT News, 2010a |
| V; RT news channel (original authorship not provided) | --/ 30 May 2010 | Title: 'Raw video of damage caused by volcano eruptions in Guatemala and Ecuador' The video shows, for Pacaya, images of advancing lava flows and some distant views of the volcano in daylight with a moderate plume above it. There are many scenes of damage, evacuation, and human impact, including ash-loaded corrugated metal roofs that buckled; ash on airliners; brigades of people sweeping and carting off ash from city streets and an airport runway; and children sheltering in a relief center. http://www.youtube.com/watch?v=gmrVLHSS4mc http://www.youtube.com/watch?feature=player_detailpage&v=gmrVLHSS4mc Cited in text as RT News, 2010b |
| P; Boston.com | 27-31 May / 2 June 2010 | Title: 'A Rough Week for Guatemala' (in The Big Picture—News Stories in Photographs) "In just the past seven days, residents of Guatemala and parts of neighboring Honduras and El Salvador have had to cope with a volcanic eruption and ash fall, a powerful tropical storm, the resulting floods and landslides, and a frightening sinkhole in Guatemala City that swallowed up a small building and an intersection. Pacaya volcano started erupting lava and rocks on May 27th, blanketing Guatemala City with ash, closing the airport, and killing one television reporter who was near the eruption. Two days later, as Guatemalans worked to clear the ash, Tropical Storm Agatha made landfall bringing heavy rains that washed away bridges, filled some villages with mud, and somehow triggered the giant sinkhole--the exact cause is still being studied. (34 photos total)." (URL: http://www.boston.com/bigpicture/2010/06/a_rough_week_for_guatemala.html) Cited in text as Boston.com, 2010 |
| V; Tropical-rambler (clear authorship not provided) | 31 May 2010 / 31 May 2010 | Title: 'Erupción Volcán de Pacaya - Pacaya volcano Eruption' Helicopter views of flight generally towards, and then at, Pacaya, which was still in eruption, with initial views showing Agua volcano and parts of Lake Amatitlán. Low weather clouds covered extensive areas. This video captured a decidedly non-vertical, denser black plume from Pacaya feeding a lighter, tan colored more massive plume that appears to drop ash as it is carried to tens of kilometers downwind (directed E-SE-S). Shots include those of Cerro Chino and antenna towers there, and widespread steaming on the MacKenney cone that coalesced into large steam clouds low over much of the central crater area. http://www.youtube.com/watch?feature=player_detailpage&v=JIqlMy8Q-aQ Cited in text as Author unknown, 2010 |
| V; PrensaLibre.com | About 2-3 June 2010/ 10 June 2010 | Title: 'Espectacular erupción en el Pacaya' (Narration by news reporter referring to explosion as 1 week ago, thus the 'About 2-3 June' date in the previous column.) According to REW, this video shows lavas emitted at the new SE flank vent. Remarkable images, some seemingly shot from helicopter and others from the ground, showing copious channelized lava flows moving rapidly downslope to the SE. At the vent area there are three small vents discharging spatter from coalescing cones with very steep sides. Their glowing summit craters gave off occasional eruptions as well as occasional puffs of gases, glowing spatter, and possibly flames. Some shots show incandescent lava flows several kilometers long. Rising plumes sometimes display toroidal motion, rotational behavior reminiscent of dust devils. http://www.youtube.com/watch?v=CFpPB5TIRbk Cited in text as Prensa Libre, 2010 |
Figure 45 shows one of several Landsat views of the E flank in an infrared image acquired on 23 March 2010. It showed high thermal radiance in a narrow linear thermal anomaly headed E outboard of the usual eruptions confined to the crater. The E-flank area is devoid of vegetation, which rules out a local fire there, meaning that the anomaly was due to a lava flow. The number of clear (cloud-free) views of Pacaya available during March through June was limited. REW plotted this anomaly in a KMZ file format (red line, figure 46).
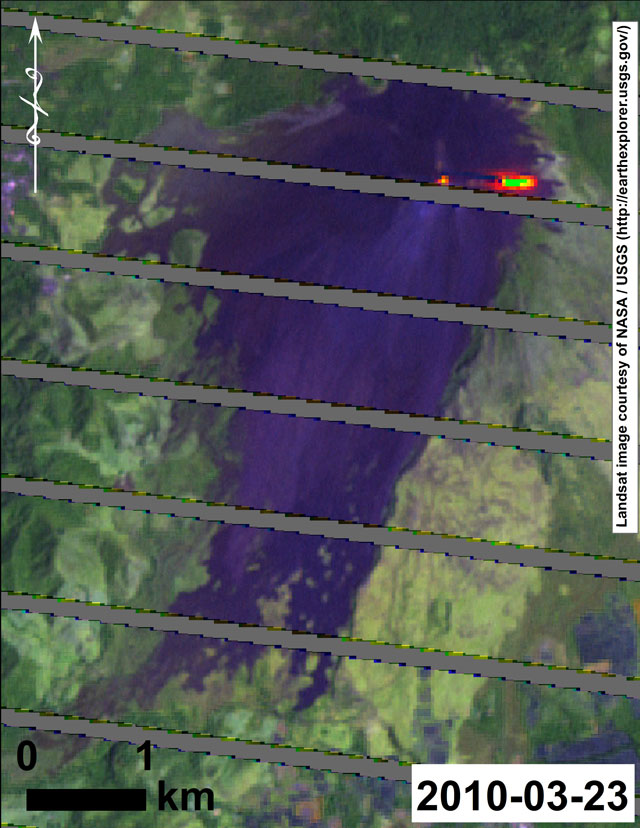 |
Figure 45. A Landsat 7 thermal image of Pacaya on 23 March 2010 showing high heat flux as red. The small red area is on the MacKenney cone. The larger red area is a lava flow that had extended E. A site visit and video by Moon (2010) on 1 April (8 days later) confirmed lava flows on the order of 2-4 m wide. Black and marginal gray areas are older lava flows; green areas are vegetated with some cultivated or pasture land in shades of brown. This image contains artifacts in the form of gray diagonal stripes. The stripes are due to the failure of the Scan Line Corrector (SLC), which compensates for the satellite's forward motion. Courtesy of REW. |
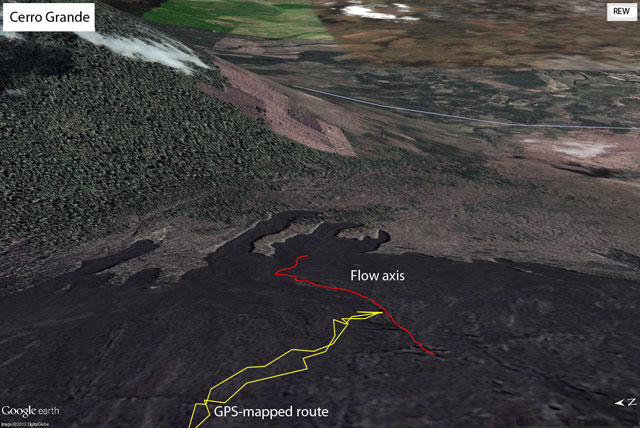 |
Figure 46. A Google Earth view of the land surface looking radially outward (E) down Pacaya's E flank (N is to the left). The red line indicates the location of the lava flow axis from heat flux in Landsat images. The flow's source was at or very near the collapse scarp. The yellow line indicates the film crew's 1 April 2010 excursion route recorded with GPS as they approached the lava flow, filmed it at close range, and then headed back towards the trailhead (Moon, 2010). For scale, the lava flow is ~0.3 km long. Graphic files, analysis, and compilation created and provided by REW. |
The new E flank (extra-crater) lava flow documented by Landsat on 23 March was the subject of a video by Moon (2010) taken on 1 April (table 4; see their excursion route on figure 46). The footage was shot during daylight hours at high resolution [1080p HD] and later processed to obtain vibrant red, orange, and yellow colors. The discharges were effusive and few visible emission clouds accompanied the lava flows seen in the video. A dark plume remained above the MacKenney cone's summit.
As seen in figures 47-50, the lava documented by Moon (2010) in photo and video was several meters wide and passing over irregular terrain. As seen from a distance (e.g. figure 47), some sectors of the flows channel stood well above the surrounding landscape. In the area visited, the lava remained confined behind jumbled but effective levees as it passed through and over the a'a' (rough textured) flow field.
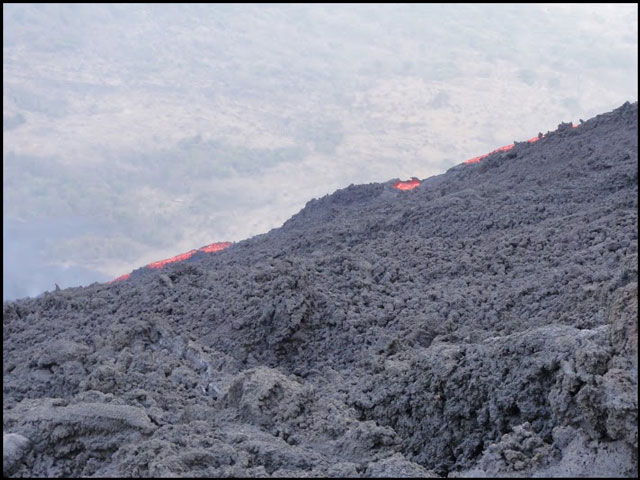 |
Figure 47. A 1 April 2010 photo of Pacaya's E flank lava flow seen in the distance as it descends across an a'a flow field. Courtesy of H. Paul Moon (see table 5). |
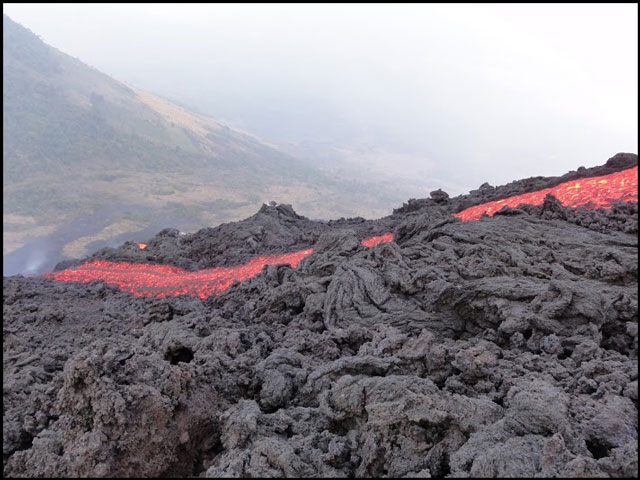 |
Figure 48. Pacaya's E-flank lava flow on 1 April 2010 upon closer approach than previous f. After watching the video Moon (2010), REW commented that the flow looked like "a typical channel-levee aa flow developed on a steep slope." Courtesy of H. Paul Moon (see table 5). |
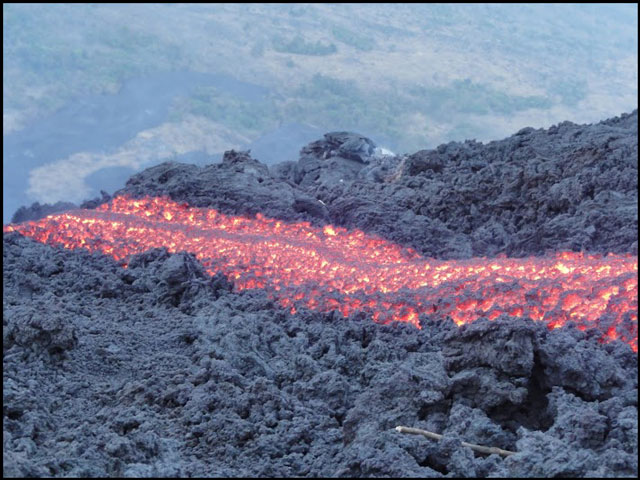 |
Figure 49.. Pacaya's E-flank lava flow on 1 April 2010 upon closer approach than previous f. For scale, note exposed portion of ~1.4 m long hiking stick in right foreground. Courtesy of H. Paul Moon (see table 5). |
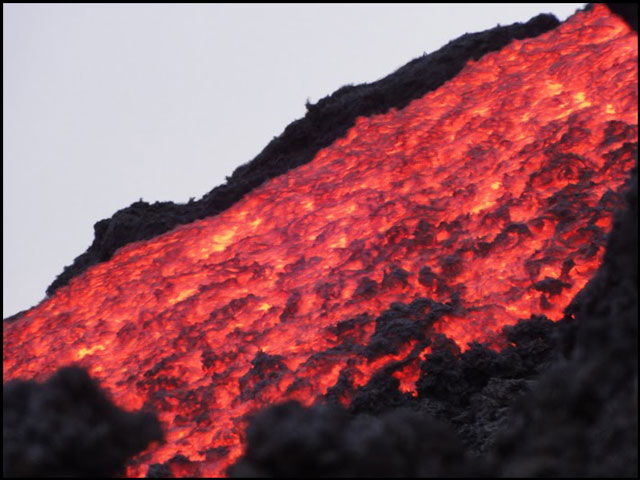 |
Figure 50. A still closer view of Pacaya's E-flank lava (taken from just a few meters away), which was moving swiftly. In his YouTube notes on his teams 1 April 2010 visit Moon commented that "the heat was so intense that I could only hold out for brief shots, needing to turn away regularly to avoid getting scorched." Courtesy of H. Paul Moon (see table 5). |
Figure 51 maps the inferred E flank lava flow axis and SE flank fissures on an oblique Google Earth view.
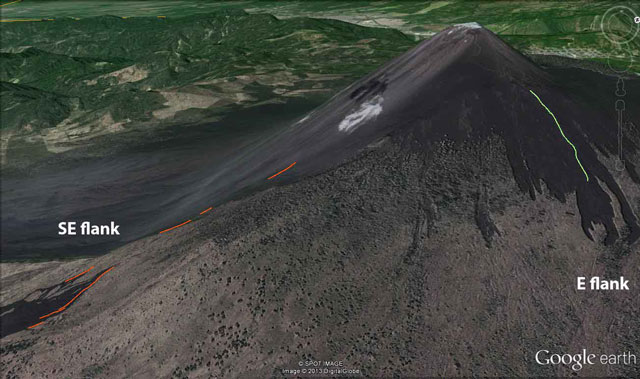 |
Figure 51. An oblique Google Earth view of Pacaya looking roughly WNW. At left in orange appear the upslope areas of the fissures that fed the SE flank lava flows. Farther NE (to the right) appear another set of fresh black lavas that reside on the upper E flank. The green line traces high heat emissions REW found in Landsat imagery from 23 March 2010, the same lava flow that had been the subject of Moon's video ~8 days later. Both sets of flows and vents were the first clearly documented to extend E of the collapse scarp in historical times. Analysis, compilation, and topographic files all provided by REW. |
On 18 April 2010, according to a news report in the newspaper Prensa Libre, a Venezuelan tourist and her Guatemalan guide died on Pacaya. The news report stated the deceased were in the area of high risk when struck by material released from an explosion. Some of the other 14 people on the scene sustained injuries.
On 17 May 2010, observers saw abundant lava escaping from a new SE-flank vent (CONRED 708). A mound had formed at the vent area. The lava from this vent had by 17 May extended as far as 1.5 km. As seen on figure 43, the SE flank lava flows and their fissures ultimately fed lava flows trending roughly S for ~2.5 km then turning sharply (~90 degrees) to the W and extending in that direction another ~2.5 km.
CONRED 708 made a recommendation to the Pacaya National Park authority to restrict visitor access to the lava flows. The 17 May report noted that Pacaya's activity was considered to be relatively high, but it left out language suggesting a crisis at this point. According to the press, access to the volcano was restricted following the recommendation.
On 17 May, the newspaper Prensa Libre featured an undated night photo of the MacKenney cone taken from the N, presumably of this stage of Pacaya's eruption. It showed a dense spray of glowing material thrown from the MacKenney cone's summit and rising hundreds of meters. The cone's N rim contained a recently formed V-shaped notch (or trough). Out of that notch poured a broad lava flow. Several hundred meters down the MacKenney cone's N face, the broad flow split into two flows descending the cone's steep face on diverging paths. The notch in the cone stands out as a clear morphologic change associated with this time interval (~10 days prior to the 27 May explosion), and as will be seen below, it served as a conspicuous vent site for the fissure emissions documented during the explosions.
The day before the explosion, on 26 May, eruptive and seismic intensity both increased markedly. An eruptive plume reached 1 km above the vent and fine tephra fell on villages around the volcano (CONRED 726 on 26 May, table 4). CONRED recommended fully closing Pacaya National Park, and they warned aviation authorities of airborne ash near Pacaya. No call was yet made to evacuate residents living adjacent Pacaya.
Vigorous explosions starting 27 May 2010. Pacaya's eruptive vigor increased to the point of strong strombolian eruption, with the initial increase noted on the 27th in a morning report in Prensa Libre. More intense explosions occurred at around 1500 when observers noted explosions discharging about once per second and saw glowing material thrown ~1.5 km above the crater, and taller rising dark clouds carrying finer tephra that dispersed over nearby villages.
The exact start time of the intense 27 May explosion is variously reported, but available visual observations suggested to REW (2014) that it was during the interval 1800-1900. CONRED 729 indicated the climax (the explosion)began at 1900. Seismic data, discussed in a subsection below underwent the highest (RSAM) amplitudes during 1730-1830 local time on the 27th. Aviation reporting of satellite data on eruptive plumes, discussed in a subsection below, was initially ineffectual for the 27th owing to above-lying weather clouds.
What is clear is that the explosion late in the day on the 27th drove forth intense fire fountaining and vigorous ejection of tephra and ballistics.
Figure 52 shows a broad fire fountain frame taken from a Youtube video posted on 28 May—but it lacked an acquisition date (RT news channel, 2010a). REW interprets this video as taken during the major climax (explosion) during the night on the 27th. The eruption was clearly of fissure style at this point but the upper extent of the glowing material was possibly masked by ash clouds. Some of the textures within the glowing region are explained in the f caption and in the text below.
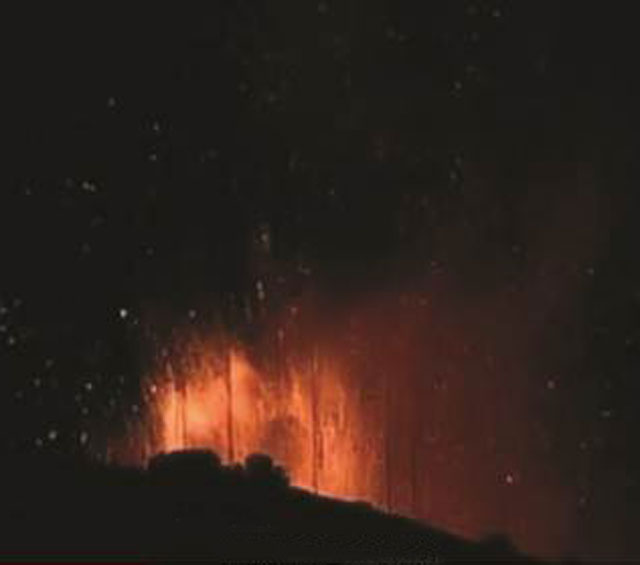 |
Figure 52. A frame captured from a news video taken at night from Pacaya's NNW side documenting powerful curtain-style emissions (fire fountains) from the main crater area (which includes the MacKenney cone). The foreground consists of the dark silhouette of Cerro Chino (indicated on figure 43). Some of the tall antenna towers there appear as narrow vertical dark streaks backlit by the brighter orange fire fountains. Many of the towers and radio shacks on the ground near their bases were destroyed. Taken from RT news (see table 5 (RT News, 2010 (a)). |
REW described the video source for figure 52 as taken looking at Cerro Chino (indicated on figure 43) from at or near the town of El Cedro, ~3 km to the NNW of the vent. The diffuse zones of near darkness in the midst of the fountains are rising ash clouds locally diminishing the glow. Thus it is clear from the dynamics seen on the video, that the glow of higher reaching clasts in the upper portions of this image could possibly be masked by dense ash plumes.
On the video, the orange streaks from glowing airborne pyroclasts track to points below that suggest emission from multiple vents or an elongate vent with continuous extent, rather than a single point source, a topic returned to below in the context of an elongate trough developed on the MacKenney cone. That said, REW points out that it is hard to get a good idea of the scale from this video and that videos taken from other locations seem to show a wider, and at times two different fountain jets. Available video and photographic data has thus far prohibited estimating the width of the fountain at this stage of the eruption. REW (2013) citing Hetland (personal communication) and CONRED 856 noted that associated with these emissions the major tephra fall began, and it soon spread tens of kilometers to the N.
Early in the explosion on the 27th (exact timing unknown), a news team from a national television station (Notisiete) endured a shower of ballistics. REW (2013) noted that they were in the vicinity of Cerro Chino at probably less than 1 km from the vent, the zone with critical infrastructure most impacted (figure 53). Although most of the news team survived, reporter Anibal Archila's death was apparently the result of direct impact from a large ballistic. His was the only icially confirmed death caused by the strong explosive phase. During a subsequent eruptive lull, a rescue team spent several dangerous hours in very close proximity to the vent, finding and rescuing missing people, and carrying out Archila's body.
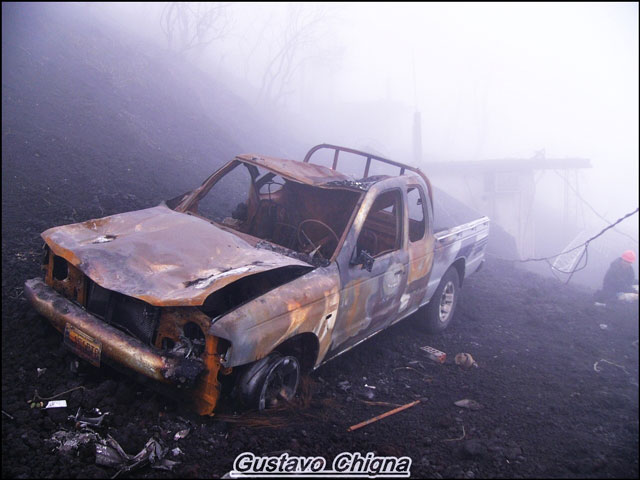 |
Figure 53. A truck parked directly N of the Pacaya's active crater at Cerro Chino as seen in the aftermath of the 27-28 May explosions. Courtesy of Gustavo Chigna (INSIVUMEH). |
Ballistics in excess of 0.5 m on their long axis fell at Cerro Chino and elsewhere within ~1 km of the vent area (figure 54). Some bombs on the ground reached sizes of 80 x 50 cm (Hetland personal communication) but part of that extent may have been due to splattering on impact. Farther away, the sizes of ballistics generally diminished with distance from the source. At Cerro Chino ballistic impacts broke concrete roofs, started fires in the radio shacks, and toppled antenna towers (REW, 2014; Wardman and others, 2010).
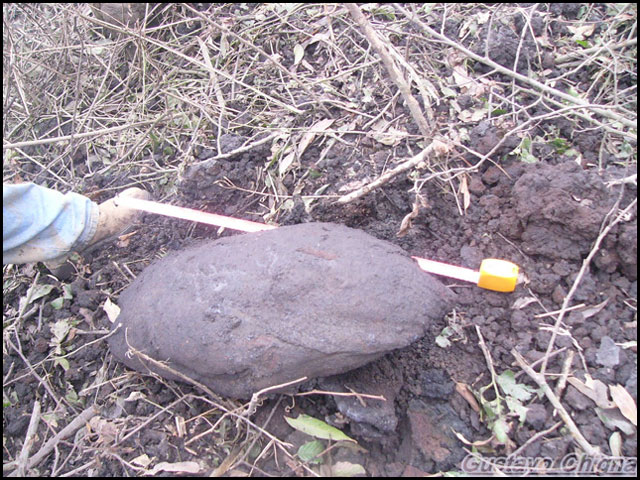 |
Figure 54. An example of a large bomb found in the near-source region. Courtesy of Gustavo Chigna (INSIVMEH). |
When the intense phase started on the 27th, the evacuation of villages to the W (El Rodeo and El Patrocinio) was already underway. During the hours after the explosion's onset on the 27th, more than 2,100 people were evacuated from the proximal villages to the town of San Vicente Pacaya (5 km NNW)(see related scenes in RT news, 2010 (b), table 4).
The settlements El Cedro, San Francisco de Sales, and Calderas, towns 2.5-3.5 km to the N, endured both ash as well as a dense barrage of hot ballistic bombs (figure 55). Many of the bombs were below 20 cm in diameter. Some of the ballistics pierced the corrugated (sheet metal or fiber cement) roofing common in Latin America. In some cases the ballistics also ignited fires that consumed most of the combustible contents of the buildings. Some roofs collapsed or buckled due to the load of deposited tephra.
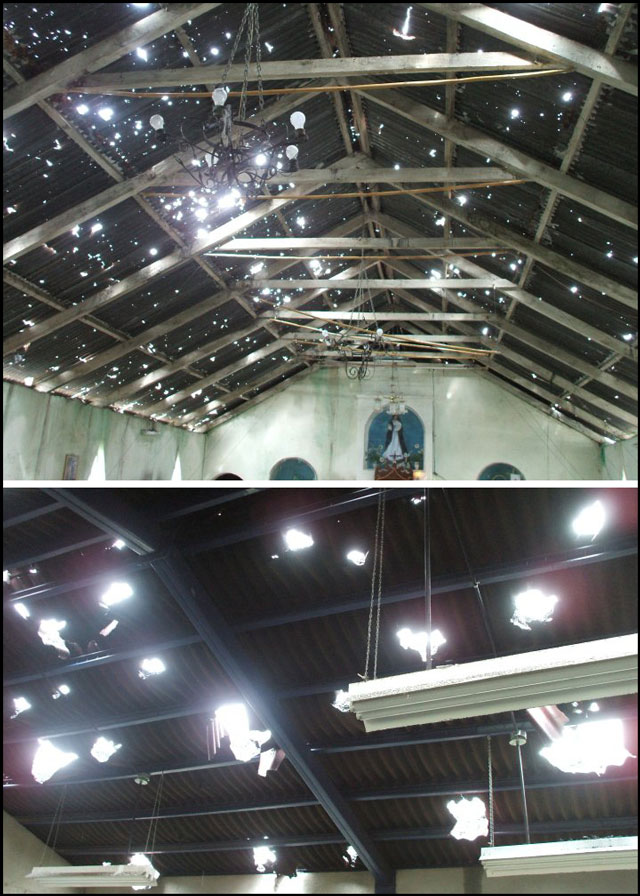 |
Figure 55. Two photos taken soon after Pacaya's 27-28 May eruptions illustrate the density of projectile penetrations through roofs of two large buildings in San Francisco de Sales (~3 km N of the MacKenney cone). Taken from REW (2013) with photo credit to Hetland. |
The ballistics examined were of low density owing to vesicles larger than 1 mm in diameter. They contained sparse phenocrysts (often larger than 1 mm), most likely plagioclase (Hetland personal communication to REW and Hetland (2010).
REW (2013) noted that, from the observed damage to roofs in these villages, the density per unit area of impacts that pierced through the corrugated roofs averaged as high as on the order of 1 per square meter. Portions of the roofs in near-vent settlements also sustained many dents from bombs that delivered impacts with lower force. Although some communities were partially evacuated when many of the ballistics arrived, REW (2013) concluded that some residents remained within the communities and regions mostly affected.
Reports in Prensa Libre give insights into the scene of the evacuation and the barrage. Many of the residents evacuated on foot following narrow paths across the rugged rural terrain. Other residents remained behind in order to protect their belongings from theft. When the barrage came, those too close used whatever hard and resistant objects they could find to protect themselves, including hiding under furniture and using pots and pans to protect their heads. Some corroded metal roofs were weak prior to the eruption. Some people found refuge in buildings with heavier, concrete-slab roofs, which generally fared better.
Figure 56 shows an individual who clearly received medical attention, stitches, for a laceration on his forehead. According to REW (2013), Pacaya's 2010 ballistic barrage caused more injuries than any recent eruptions. That said, data remain scanty on injuries rates and kinds, resultant disabilities, accident location, etc., although Wardman and others (2012) compiled some statistics.
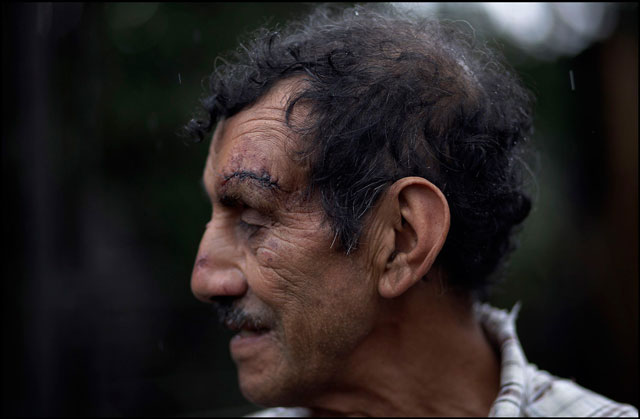 |
Figure 56. Ballistic projectiles presented the most direct hazard from the 2010 explosions at Pacaya. This photo was found on the Boston Globe photo news site Boston.com (table 5). Their caption read, "A man shows the stitches he received after being injured by volcanic rock on the slopes of the Pacaya Volcano on May 28, 2010. (REUTERS/Daniel LeClair)." Courtesy of Boston.com. |
The AmatitlÁn geothermal plant, located ~3 km N of the MacKenney cone to the N of San Francisco de Sales received ~20 cm of mostly lapilli-sized tephra. As Wardman and others (2012) noted, "Ballistic bombs and blocks also bombarded the plant, causing extensive damage to the plant's roof and condenser fans. Fan blades were dented, bent and also suffered damage from abrasion. Minor denting of the intake and outlet pipe cladding was also reported however these impacts were superficial and did not require repair." A photo showed cladding bearing multiple closely spaced dents on the side of a large pipe; the largest dent, 20 cm across, had ruptured through the sheet metal.
Post-explosion assessment of the MacKenney cone shed new light on the form and significance of the previously mentioned notch across it (a linear NW-trending trough passing through the summit, figure 57).
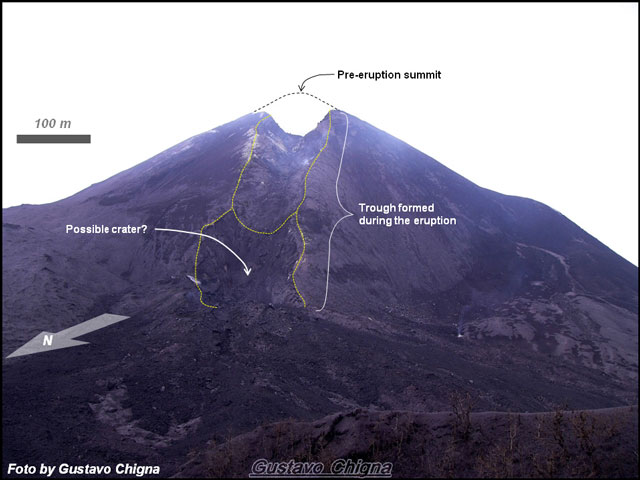 |
Figure 57. An annotated photo viewing the N side of the MacKenney cone in calm conditions at an unstated date following the May 2010 explosions. The prominent trough included a deep segment that had developed on the cone's lower slopes (labeled 'Possible crater'). During the 27-28 May 2010 eruption the trough appears to have served as an active fissure or series of vents emitting fountains (see figure 52 and related discussion). Courtesy of REW with photo credit to Gustavo Chigna. |
The notch formed a prominent depression aligned both with the new SE-flank fissures and Cerro Chino cone on the outer NW crater rim. Portions of the RT video footage taken during vigorous stages of explosion suggests that at a paroxysmal stage of the explosion the trough served as an eruptive fissure emitting a vertically directed fountain as a curtain (table 5). REW (2013) also suggested that the eruptive fissure along the trough may have served as the vent for the ballistics that fell in previously mentioned settlements to the N.
The explosions broadest areal impact came from tephra fall. Figure 58 shows a close up of ash from a sample collected 22 km from the vent. Overall, the grain sizes ranged from sub-millimeter to centimeter size. An abundance of fine suspended particles in the air were not reported during or following the tephra fall.
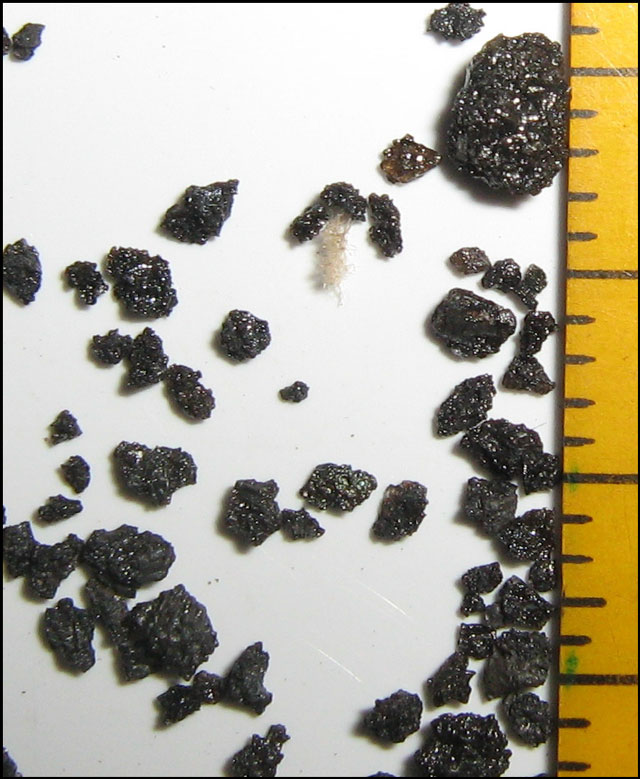 |
Figure 58. Close up view looking at Pacaya tephra clasts collected in Guatemala City ~22 km NNE of the source. The smallest increments on ruler are in millimeters; the size range of grains here were mostly below ~ 3 mm diameter but grains under 0.2 mm were scarce to absent. The clasts consisted of black to dark brown vitric (crystal poor) scoria. Taken from REW (2013), who cited R. Cabria (personal communication). |
As noted in table 4, in the afternoon on the 28th, high eruptive vigor resumed and tephra again fell on Guatemala City (CONRED 735). The ash fall on this day was lighter than on the 27th. Here aviation data (discussed below) did record the plume via satellite. The Washington Volcanic Ash Advisory Center (VAAC) noted (in their 6th advisory) an eruption in the afternoon on the 28th reaching (based on comparison of plume movement to modeling of winds aloft) ~13 km altitude.
During 29 May and onwards the intensity of volcanic activity decreased, with only relatively small eruptive plumes that occasionally produced minor tephra fall in the communities surrounding the volcano (CONRED 742). CONRED 748 noted that by the 29th, a total of 2,635 people were in shelters due to the eruption, with close to 800 home either damaged or destroyed. In the following days the attention of the emergency managers shifted from the eruption to the Tropical Storm Agatha, which had much broader extent and impact.
In the Pacaya and Guatamala City region, and along drainages carrying ash-charged run, both disasters combined. Lake AmatitlÁn rose, inundating low lying parts of the town with a water-and-ash mix (see photo documentation of impacts at Boston.com). Figure 59 is a photo taken ~12 km downstream of the Lake's outlet.
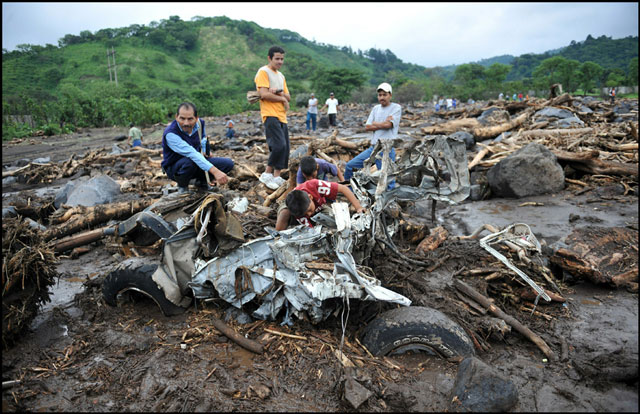 |
Figure 59. The Pacaya tephra fall combined with storm run from Agnes led to swollen rivers in a 'dual disaster.' Those rivers formed new deposits along their beds from large amounts of in-swept debris, in this case including large boulders, trees, and a badly battered vehicle in the foreground. This press photograph was taken on 30 May 2010 as the flood water dropped. The location was the municipality of Palin, which sits along the Michatoya river downstream of Lake AmatitlÁn and ~10 km W of Pacaya. Taken from Boston.com with credit to Johan Ordonez/AFP/Getty Images. |
Seismic record. INSIVUMEH and REW (2013) suggested a climax on the 27th starting shortly before 1800 local time and lasting ~40 minutes.
The seismic signal (figure 60, upper panel) contained a few scattered high amplitude events during the morning of 27 May 2010. Seismicity rose significantly about 1200 on the 27th, about doubling the RSAM values recorded during the previous 13 hours.
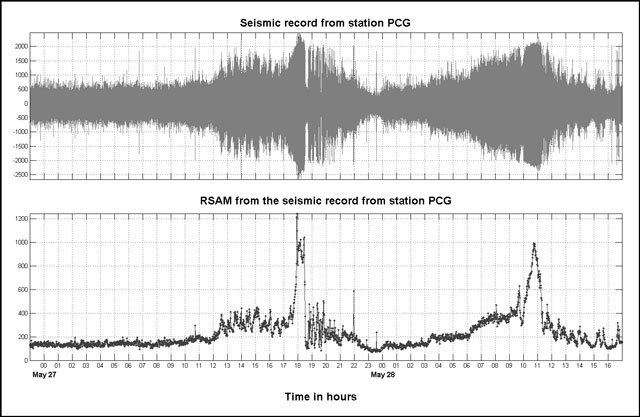 |
Figure 60. Seismicity recorded at Pacaya during the 2300 of 26 May through 1700 on 28 May (local times). The upper panel shows the seismic record and the lower panel shows the computed RSAM. Station PCG is a short-period seismometer located on Cerro Chino, ~1 km NW of Pacaya's summit on the MacKenney cone. Courtesy of INSIVUMEH. |
The first of about 10 strong peaks (seen on both the upper and lower panels of figure 60) took place around 1230 on the 27th. Those peaks represented a large escalation in seismicity an approximate doubling of the RSAM values. The highest peak on the record took place during 1730 to 1830 on the 27th, a ~6-fold increase in RSAM over the background values acquired earlier on the 27th. During the middle part of the 1800-1900 interval there was a peculiar several-minute-long period with low seismicity conspicuous on the seismic record (upper panel). After that, a series of closely spaced peaks of generally decreasing amplitude followed and then seismicity decreased substantially, particularly around 2300-2400 on the 27th. A second escalation of broadly similar size to the earlier one came on the 28th peaking at 1100 and then dropping.
In a later analysis of seismicity, Mercado and others (2012 correlated waveforms for 5 months before and 9 months after the May 2010 eruption. They noted that "No correlation was found between the events of each day during the five-month period before the eruption, thus, establishing no relationship with the periods of correlation found after the eruption. The post-eruptive sources of seismicity discovered were not active before the eruptive event of May 27, 2010, and therefore these sources must be strictly post-eruptive in nature."
Aviation. Although there were 48 reports (Volcanic Ash Advisories, VAA's or simply 'advisories') issued by the Washington Volcanic Ash Advisory Center (VAAC) on Pacaya behavior during the interval 27 May to 26 June 2010, weather clouds frequently masked the plume from the key satellite observation platform, the GOES-13 satellite. Where satellite observations of the plume were scarce or lacking, most of the VAA's conveyed ground-based observations including media reports.
By the 3rd advisory, which was issued on the 28th, considerable ash had fallen at the International airport Aurora. There is some confusion as to the quantity of ash at the airport and over the region in general, but a photo on the 28th shows ash at the airport. Judging from ash load on the aircraft, the f walking just to the right of the aircraft, and adjacent tire tracks, the ash was on the order of ~1-cm thick (figure 61). This is in accord with INSIVUMEH's summary report that said 5-7 mm of ash had fallen during the entire explosive 27-28 May eruption at the airport. This is also in accord with REW (2014), which discusses the complexities of assessing tephra thicknesses in more detail, and presents a preliminary isopach map that shows the S fringes of the Guatemala City urban area with 10 cm of ash and many parts of the urban area farther N, including the airport, with on the order of 1 cm of ash.
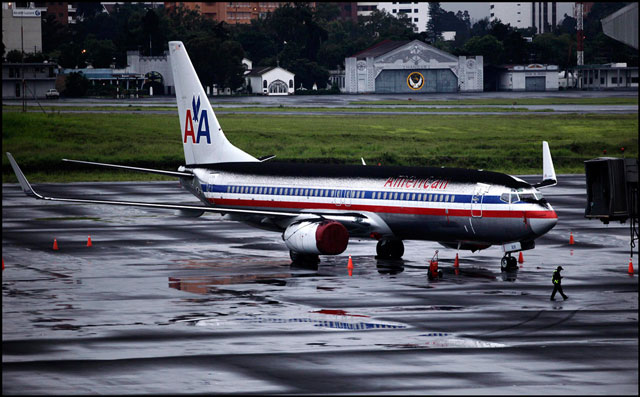 |
Figure 61. An American Airlines jet sits covered with ash from the Pacaya explosions at the International airport in Guatemala City on 28 May 2010. Runway cleanup took five days. The cleaning of the abrasive ash both destroyed the bituminous runway surface and all markings on it (Wardman and others, 2012). This photo was posted on the Boston Globe news website (Boston.com, see reference in table 5) with the credit to REUTERS/Daniel LeClair. |
What follows is a summary of the advisories issued during 27 through 28 May (UTC).
The VAA's frequently refer to the NAM (North American Mesoscale Model), a numerical model for short-term weather forecasting and in this case wind-velocity estimation. The model is run 4 times a day with 12 km horizontal resolution and with 1 hour temporal resolution, providing finer detail than other operational forecast models. An example of a model with less detail is the model called GFS (Global Forecast System), which predicts weather for many regions of the world, and was sometimes also used by the VAAC analysts.
The VAAC issued their 1st VAA for Pacaya during 2010 on May 27 at 1140 UTC, citing as key information sources GFS winds and INSIVUMEH. Eruption details noted small brief ash emissions near the summit at 1115 UTC. The ash cloud was not identifiable from the GOES-13 satellite owing to rain. The ash cloud was inferred to have remained low and near the volcano. GFS wind data suggested that for such a low ash cloud at that time, wind-directed transport would carry a plume S-SW and would only be significant for ~20 km. The analyst noted that eruption as then dominantly lava emission.
The 2nd advisory came out 7 hours later at 1845 UTC on the 27th indicating volcanic ash and gases to ~3.5 km altitude (noting ICAO as an information source). Ash was again not identifiable from the GOES-13 satellite owing to clouds.
The 3rd advisory, noting 'ongoing emission of volcanic ash and gases,' came out at 1257 UTC on the 28th, again lacking clear satellite identification of ash owing to clouds, in this case citing a thick tropical depression. This advisory relied on both a wind model (NAM winds) and an aviation meteorological report (a METAR). The advisory further noted media reports of ash on runways as discussed in the context of figure 61.
The 4th advisory was issued at 1554 UTC on the 28th, noting "increasing emissions" at 1515 UTC with INSIVUMEH reporting ash rising to 3.7 km altitude (FL 120) and spreading up to 27 km NW. Again, owing to extensive weather clouds, ash was again not visible from GOES-13 satellite.
The 5th advisory was issued at 1710 UTC on the 28th, noting "ongoing emissions" recorded at 1645 UTC. Plume has now become visible in [GOES-13] imagery and extends about 15 NMI [Nautical miles, 27 km] to the NNE of the summit. Plume top was at 3.7 km altitude (FL 120).
The 6th advisory was issued at 1915 UTC on the 28th, noting a large eruption recorded at 1815 UTC: "Large eruption seen to FL420 [42,000 feet, ~13 km altitude] based on NAM sounding for the area. Forecast winds remain mostly westerly to northwesterly. Winds at the time of observation blew the plume E at ~18 km/hr.
The 7th advisory was issued at 1930 UTC on the 28th (the last one that day); it repeated information about the eruption seen in imagery around 1815. In this advisory the wind was moving NW at 27 km/hr.
Slope stability study. Schaefer and others (2013) evaluated slope stability at Pacaya and commented on the possible implications of the trough across the MacKenney cone (figure 57). They consider the trough noted above as an example of a recent, smaller-volume collapse.
Specifically, they studied the SW flank of the edifice and developed a geomechanical model based upon field observations and laboratory tests of intact rocks from Pacaya. Their study included analysis of slope stability using numerical techniques and consideration of forces from gravity, magmatic pressure, and seismic loading as triggering mechanisms for slope failure.
Given the cone's structural and seismo-tectonic setting, the likely magma pressures, and the history of past behavior, they suggested Pacaya lacked substantial gravitational stability.
References. Bonis, S., 1993, Mapa Geologico de Guatemala Escala 1:250,000. Hoja ND 15 - 8 - G, "Guatemala". First edition (map). IGN, Guatemala.
Conway, M., 1995, Construction patterns and timing of volcanism at the Cerro Quemado, Santa María, and Pacaya volcanoes, Guatemala. Ph. D. Dissertation. Michigan Technological University, Houghton, Michigan. 152 pp.
Escobar Wolf, R, 2013 (Report in preparation, July 2013), The eruption of VolcÁn de Pacaya on May -June, 2010, Michigan Technological University, 31 pp.
Escobar-Wolf, R., & Tubman, S., in preparation, Compilation of historical and recent accounts of eruptions from volcan de Pacaya (XVI-IXX centuries).
Eggers, A., 1972, The geology and petrology of the AmatitlÁn quadrangle, Guatemala. Ph. D. Dissertation. Dartmouth College, Hanover, New Hampshire. 221 pp.
Eggers, A., 1969, Mapa Geologico de Guatemala Escala 1:50,000. Hoja 2059 II G, " AmatitlÁn ". First edition (map). IGN, Guatemala.
Fiske, R. S., Rose, T. R., Swanson, D. A., Champion, D. E., & McGeehin, J. P., 2009, Kulanaokuaiki Tephra (ca. AD 400-1000): Newly recognized evidence for highly explosive eruptions at Kīlauea Volcano, Hawai'i. Geological Society of America Bulletin, vol. 121, no. 5-6), pp. 712-728
Hetland, B., 2010a, Volcano Pacaya, Cleaning up the eruption of Pacaya, One roof at a time…; Online manuscript by Brianna "Adriana" Hetland, US Peace Corps Volunteer 2010-2012, (URL: http://www.geo.mtu.edu/~raman/Pacaya.Bri.pdf )
Hetland, B., 2010b, Erupción del VolcÁn de Pacaya 27 Mayo 2010; X Congreso Geológico de América Central, Antigua, Guatemala, November 10, 2010. [Power Point from talk at Geologic Conference; in Spanish] (URL: http://www.geo.mtu.edu/rs4hazards/conferencepresentations_files/conferenceshz.htm )
Kitamura S., and Matías O., 1995. Tephra stratigraphic approach to the eruptive history of Pacaya volcano, Guatemala. Science Reports-Tohoku University, Seventh Series: Geography. 45 (1): 1-41.
Matías Gómez, RO, Rose, WI, Palma, JL, Escobar-Wolf, R, 2012, Notes on a map of the 1961-2010 eruptions of VolcÁn de Pacaya, Guatemala. Geol Soc Am Digital Map Chart Series 10: 10 pp.
Matías , O., 2010, Volcanological map of the 1961 - 2009 eruption of Volcan de Pacaya, Guatemala. MS. Thesis. Michigan Technological University, Houghton, Michigan. 57 pp.
Mercado, D, Waite, G, and Rodriguez, L, 2012, Analysis of seismic patterns before and after the May 27, 2010 eruption of Pacaya volcano, Guatemala, Cities on Volcanoes 7 (COV7), Abstract volume, IAVCEI meeting (19-23 November 2012, Colima, Mexico) (URL: http://www.citiesonvolcanoes7.com/vistaprevia2.php?idab=510)
Morgan, HA, Harris, AJL, and L. Gurioli, 2013, Lava discharge rate estimates from thermal infrared satellite data for Pacaya Volcano during 2004-2010, Jour.of Volcanology and Geoth. Res., Vol. 264, pp. 1-11, ISSN 0377-0273, http://dx.doi.org/10.1016/j.jvolgeores.2013.07.008.
Prensa Libre, 2010 [19 April at 01:17 Nacionales]; Mueren tras explosion (URL: http://www.prensalibre.com/noticias/Mueren-explosion_0_246575377.html; http://tinyurl.com/2vvaj4j ) [in Spanish]
Prense Libre, 17 May 2010 [21:38 Nacionales], Restringen acceso al volcÁn de Pacaya (URL: http://www.prensalibre.com/noticias/Restringen-acceso-volcan-Pacaya_0_263373950.html; http://tinyurl.com/2wb8p9t) [in Spanish]
Prensa Libre, 27 May 2010 Aumenta actividad volcÁnica en el Pacaya (URL: http://www.prensalibre.com/noticias/volcan-pacaya-actividad-erupcion_0_269373197.html; http://tinyurl.com/246hohe)
Rose, W. I., Palma, J. L., Wolf, R. E., & Gomez, R. O. M., 2013, A 50 yr eruption of a basaltic composite cone: Pacaya, Guatemala. Geological Society of America Special Papers, 498, 1-21.
Schaefer, L. N., Oommen, T., Corazzato, C., Tibaldi, A., Escobar-Wolf, R., & Rose, W. I., 2013, An integrated field-numerical approach to assess slope stability hazards at volcanoes: the example of Pacaya, Guatemala. Bull Volcanol, 75, 720.
Sparks, R. S. J., 1986, The dimensions and dynamics of volcanic eruption columns. Bulletin of Volcanology, vol. 48, no. 1, pp. 3-15.
Wardman, J., Sword-Daniels, V., Stewart, C., & Wilson, T. M., 2012, Impact assessment of the May 2010 eruption of Pacaya volcano, Guatemala (No. 2012/09). GNS Science (New Zealand)
Walikainen, Dennis, 2010 [June 4], Eyewitness to Disasters: Graduate Student Reports from Guatemala (URL: http://www.mtu.edu/news/stories/2010/june/eyewitness-disasters-graduate-student-reports-guatemala.html)
Geological Summary. Eruptions from Pacaya are frequently visible from Guatemala City, the nation's capital. This complex basaltic volcano was constructed just outside the southern topographic rim of the 14 x 16 km Pleistocene Amatitlán caldera. A cluster of dacitic lava domes occupies the southern caldera floor. The post-caldera Pacaya massif includes the older Pacaya Viejo and Cerro Grande stratovolcanoes and the currently active Mackenney stratovolcano. Collapse of Pacaya Viejo between 600 and 1,500 years ago produced a debris-avalanche deposit that extends 25 km onto the Pacific coastal plain and left an arcuate scarp inside which the modern Pacaya volcano (Mackenney cone) grew. The NW-flank Cerro Chino crater was last active in the 19th century. During the past several decades, activity has consisted of frequent Strombolian eruptions with intermittent lava flow extrusion that has partially filled in the caldera moat and covered the flanks of Mackenney cone, punctuated by occasional larger explosive eruptions that partially destroy the summit.
Information Contacts: Rüdiger Escobar Wolf, Department of Geological Engineering and Sciences, Michigan Tech University, Houghton, MI 49931; INSIVUMEH Seccion Vulcanologia (Institute National de Sismologia, Vulcanologia, Meteorolgia, e Hidrologia) 7a Avenida, Zona 13, Guatemala City, Guatemala; Gustavo Chigna,.INSIVUMEH; CONRED (Coordinadora Nacional para la Reducción de Desastres) Avenida Hincapié 21-72, Zona 13 Guatemala, Ciudad de Guatemala; and Washington Volcanic Ash Advisory Center (VAAC), NOAA Satellite Analysis Branch, NOAA NESDIS OSPO, E/SP, NCWCP, 5830 University Research Court, College Park, MD 20740 (URL: http://www.ospo.noaa.gov/Products/atmosphere/vaac/).