Report on Kilauea (United States) — December 2014
Bulletin of the Global Volcanism Network, vol. 39, no. 12 (December 2014)
Managing Editor: Richard Wunderman.
Kilauea (United States) 27 June-30 December 2014: Birth and rapid advance of the June 27th lava flow
Please cite this report as:
Global Volcanism Program, 2014. Report on Kilauea (United States) (Wunderman, R., ed.). Bulletin of the Global Volcanism Network, 39:12. Smithsonian Institution. https://doi.org/10.5479/si.GVP.BGVN201412-332010
Kilauea
United States
19.421°N, 155.287°W; summit elev. 1222 m
All times are local (unless otherwise noted)
This report, taken largely from Hawaiian Volcano Observatory (HVO) reports and online photo galleries, nominally covers 27 June to 30 December 2014 but adds a few details from earlier and later intervals. The lava flow just before this interval, called the Kahauale'a 2 flow, had started in May 2013 (BGVN 39:05). That flow had, during April-June 2014, advanced erratically (BGVN 39:09) and HVO Daily Updates declared it inactive ("cutoff and dead") by 30 June.
Prior to that, on 27 June, a new flow had emerged adjacent to the Kahauale'a 2 flow; it became informally named the June 27th breakout and then the June 27th lava flow. The June 27th lava flow made it to the outskirts of Pahoa, stopping at the end of 2014 with two lobes as close as about 0.7-0.8 km W of the major arterial road that passes through the town (HI-130).
The 27 June to 30 December 2014 interval was characterized by unusual developments shown here chiefly by a series of maps. The June 27th lava flow did not follow the usual pattern of flow from the summit or E rift zone to the sea. Rather, this June 27th lava flow, like the Kahauale?a 2 flow, generally progressed E to NE.
The HVO reporting during this reporting interval included a number of commonly seen processes in the over 3-decade-long eruption, which we largely omit here for brevity. We presented a summary of many of those processes in the introduction to our previous report (BGVN 39:09). They include, for example, glow, spatter, minor ash, pelee's hair, and similar emissions at either the summit vent's lava lake or along the E rift zone at Pu'u O'o crater. We have done little to track the details of breakouts on a daily or hourly basis, particularly in the near-vent area. It is also worth noting that monitoring was disrupted by Hurricane Iselle on and around 7 August 2014.
Subsections below are as follows: "Events at Pu'u O'o and Halema'ama'u"; "June 27th lava flow advance towards Pahoa"; "Graphical approaches to hazards and scientific communication"; "Lava lake heights in Overlook crater"; "Geophysical monitoring"; and "SO2 flux data." For readers seeking a deeper understanding a recent book delves into the characteristics of Hawaiian volcanoes (Poland and others, 2014).
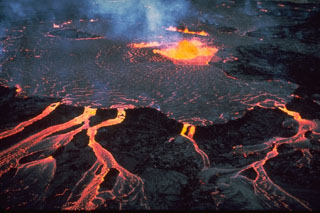
Events at Pu'u O'o and Halema'ama'u. On 27 June the new breakout on the NE flank of Pu'u O'o erupted through fissures. HVO's online reporting in their Photo and Video section stated that the breakout reached 1.5 km long by 1100 local time. Several fissures on the upper NE flank of Pu'u O'o cone sent out flows to the NE, HVO noted. These flows partially overlapped with the existing Kahauale?a 2 flow, which had scattered surface flows that morning. Breakouts caused minor subsidence in the Pu'u O'o crater floor. This led to collapses of several spatter cones on the crater floor. Small lava ponds were revealed and the NE lava pond enlarged due to the collapse. HVO reporting at the time (27 June) described the Kahauale?a 2 flow as still active.
By 30 June HVO declared the Kahauale?a 2 flow inactive. The lava tube feeding the Kahauale?a 2 lost hydraulic connection to the NE lava pond when the level of that lake dropped. The entry to the tube could be seen stranded meters above the lava in the vent wall (figure 231).
 |
Figure 231. View of the wall (roughly 10 m high) above the lava pond in the NE portion of Pu'u O'o crater. The lava pond surface is in the lower portion of the photograph. The dark hole in the upper part of the photograph is the entrance to the ~2-m diameter lava tube that had been supplying lava to the Kahauale?a 2 flow. When the lava level dipped well below the entrance to the lava tube, lava ceased entering the tube, leaving the Kahauale?a 2 flow inactive. Look direction unstated. Courtesy of HVO. |
More details follow on the June 27th flow's early phases, as reported in the 27 June 2014 Daily Update. "Seismic tremor levels were low with a few dropouts (periods when spattering is absent in the lava lake and gas emissions are relatively low). Sixteen earthquakes were strong enough to be located beneath Kīlauea Volcano in the past 24 hours: 1 [centered on a fault system passing NNW of Kīlauea's summit] in the Ka'oiki Pali area, 1 beneath Halema`uma`u Crater, 4 beneath the area south of Halema`uma`u Crater, 6 on south flank faults, 3 within the upper East Rift Zone, and one within the middle East Rift Zone. GPS receivers spanning the summit caldera recorded almost +4 cm of extension since May 24; the long-term, cross-caldera measurements indicate continued extension at a rate averaging 10 cm/yr (4 in/yr) since March, 2010.
"Recent Observations at the middle East Rift Zone vents: The tiltmeter at Pu'u O'o cone recorded an abrupt drop, that is slowing, of more than 7 microradians. The lava flow from the northeast spatter cone continued to be active until midnight; early this morning, coincident with the rapid deflation, the crater floor started to slowly subside and new lava was erupted on the north flank of Pu'u O'o cone; in addition, the upper part of the south cone collapsed around 7 am. GPS receivers recorded 5 cm of contraction across the cone following this morning's deflation."
"Recent Observations of the Kahauale'a 2 flow: PNcam views yesterday showed active breakouts at the north base of Pu'u O'o cone and distant broad smoke plumes, with multiple glowing points visible at night from both near and distant breakouts. A satellite image from June 20 showed multiple active breakouts in the interior of the Kahauale'a 2 flow extending 7.1 km (4.4 mi) northeast from the Pu'u O'o vent (see map for June 17 flow details).
"In general, this slow-moving [Kahauale'a 2 ] lava flow has made erratic progress over the past few months and appears to be slowly weakening. Disruption of the flow front has occurred during strong DI deflation events when the lava supply abruptly decreased causing the flow front to stagnate. DI inflation and resumption of lava supply usually follow a few days later. Breakouts reappear well behind the stalled flow front and take some time to reach the front again. In this way, the flow front has not advanced more than 1.8 km (1.1 mi) since the first time it stalled in early November, 2013."
The 27 June breakout formed a lava shield high on the Pu'u O'o cone during 28-29 June. A set of HVO photos taken on 26 June and 6 July documented before and after shots of a broad prominent shield. Associated text said the shield made a "dramatic change to the skyline" at Pu'u O'o. The text attributed the growth to the process of successive flows stacked on top of each other in the near vent area. The caption also said that the shield hosted a lava pond.
Photos of Pu'u O'o taken on 18 July addressed a new crater at Pu'u O'o. Since the onset of the "June 27 breakout" flow, the central part of Pu'u O'o's crater had slowly collapsed within a bounding ring fracture. One photo showed the pit formed on the southern side of the crater floor, which contained a small lava pond roughly 10 m across. This pit sporadically overflowed sending lava toward the deeper central part of the crater.
During 16-22 July the lava flow followed an incipient lava tube from the vent to the gentle break in slope at the base of Pu'u O'o, and continued slowly moving in two main lobes that extended about 2 km NE. Two small lava ponds within cones were present within two southeastern pits in the crater floor, and glow above two other pits indicated lava near the surface.
On 23 July the SE wall of Overlook crater fell into the lava lake and triggered an explosive event that threw spatter bombs onto the rim of Halema'ama'u. Ejected material ranged from dust-sized particles to spatter bombs ~70 cm across. The HVO Photos and Video portion of their website featured some dramatic web camera videos of the event. This process repeated again in this middle to late2014 time frame with cases noted on 6 and 23 August, and on 24 September.
A photo of the Pu'u O'o vent area on 26 September appears in figure 232.
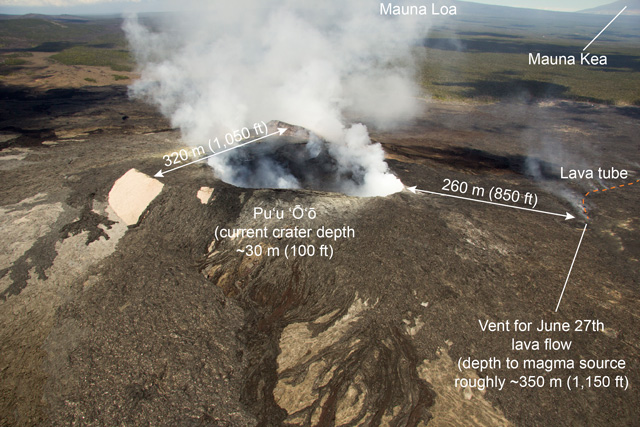 |
Figure 232. Annotated photo taken 26 September 2014 showing Pu'u O'o and the vent and upper lava tube (orange dashed line at far right) for the June 27th lava flow. View is towards the E. Courtesy of HVO. |
At 0115 on 19 October another explosion of spatter took place at the lava lake at Halema'ama'u from the lava lake in crater. . A collapse of wall rock fell into the lake, triggering a small explosion. The scar left by this collapse was visible as a light-colored area. The spatter fell around Halema'ama'u crater, which is within an area closed to the public due to hazards like this.
The summit lava lake has shown the usual fluctuations associated with changes in spattering behavior, which are also manifested as variations in tremor amplitudes and gas release. Small amounts of particulate material were carried aloft by the plume.
June 27th lava flow advance towards Pahoa. During the rest of this report, the advancing flow of note was the June 27th lava flow. As noted above, that flow ceased to advance rapidly but remained active near the distal end through the rest of 2014 (and months into 2015). That point is critical because the distal end began to encroach on the W margin of the town of Pahoa.
We present a series of HVO maps in this section, starting with one created to describe the June 27th lava flow (figure 233>).
 |
Figure 233. A map describing lava flows on 27 June 2014. Map showing the Kahauale?a 2 flow (pink) in relation to the E part of the Island of Hawai?i as of 17 June 2014. The most distant active breakout for Kahauale?a 2 lava flow was 7.1 km straight-line distance NE of Pu'u O'o. A new breakout of 27 June (shown in red) started on the NE flank of Pu'u O'o, sending new lava NE. Lava flows emitted since 1983 are labeled on the next figure. The Kahauale?a 2 flow contained an approximately located lava tube, shown with a yellow line (dashed where its position is less well known). Courtesy of HVO. |
All of the following maps have several features in common. The yellow line depicts the approximate location of the feeding lava tube (dashed where less certain). When time is referred to, the times are in local (Hawaii Standard) time. Some of the maps contain more details than others on background information such as the age ranges of lava flows going back to the start of this eruption (1983). Figure 234 and its caption explain the color scheme, although some later maps generalize all the older lava flows as one color. A critical detail on figure 234 is that by 30 June, the Kahauale'a 2 lava flow had been declared inactive.
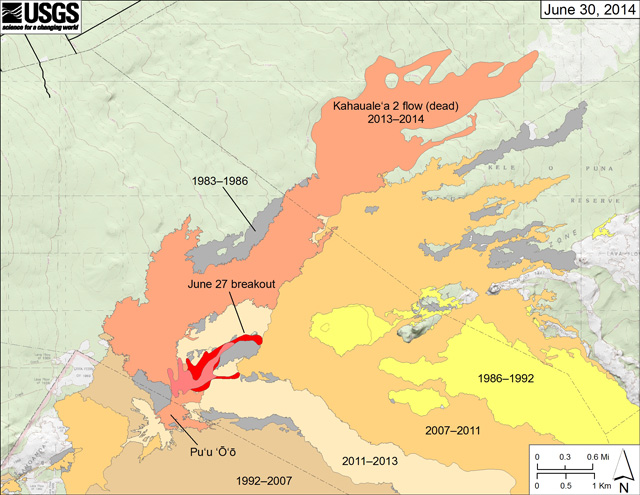 |
Figure 234. A map describing Kīlauea E rift zone and the start of the June 27th lava flow ("breakout") on 30 June 2014. The area of the new flow as mapped on 27 June appears pink, while the extending portion mapped 30 June appears red. The 2013–2014 Kahauale?a 2 flow appears reddish orange. Older lava flows distinguished by color as labeled (episode 1-48b flows (1983–1986) are shown in gray; episodes 48c–49 flows (1986–1992), yellow; episodes 50-55 flows (1992-2007), tan; episodes 58-60 flows (2007-2011), pale orange, and episode 61 flows (2011-2013), very light tan). Courtesy of HVO. |
Figures 235 to 237 portray the June 27th lava flow advance from 29 July to 6 September. HVO attributed the surprisingly narrow character of the flow as likely related to the numerous linear cracks and down-dropped structures (grabens) found in this area. In this regard, HVO noted that lava within a linear crack remained hidden for several days but over the day of 25 August lava returned to the surface at a point slightly farther along the crack. The emerging lava created a small island surrounded by thick forest. The farthest tip of the flow that day reached 11.4 km from Pu'u O'o, and 3.1 km from the eastern boundary of the Wao Kele o Puna forest reserve. On 28 August plumes of smoke from burning vegetation marked the farthest active lava on the surface (small, scattered lobes of pahoehoe). In addition, a pad of lava had emerged from the long ground crack that funneled it NE earlier this week. The lava was inactive at its surface but thermal imagery indicated it was still quite warm. East of this pad of lava, steaming appeared on 28 August, suggesting continuing lava advance below the surface along a ground crack. Direct views into the crack were not possible due to thick vegetation, but close views of the steaming areas with a thermal camera revealed temperatures up to 190°C, temperatures interpreted by HVO as evidence of lava moving along a crack. That was confirmed on the 29th when lava again emerged out of a steaming crack. On 1 September lava plunged into another ground crack. On 10 September, the most distal flow front had reached 14.5 km (straight-line distance) from its vent at Pu'u O'o.
 |
Figure 235. A map describing Kīlauea's June 27th lava flow on 29 July 2014. The pink area represents lava emplaced by 18 July. The red area represents lava emplaced after that and as late as 29 July. By this time the new flow had advanced while remaining much narrower than the adjacent Kahauale?a 2 flow. The new flow (pink and red zones) had a straight-line length of ~4.4 km. Courtesy of HVO. |
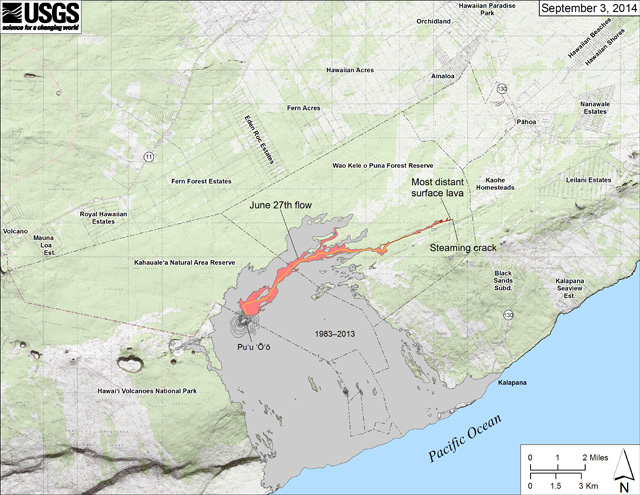 |
Figure 236. A map describing Kīlauea's June 27 lava flow on 3 September 2014. The area of the flow as mapped on September 1 is shown in pink, while widening and advancement of the flow as of September 3 is shown in red. On 2 September, lava welled up out of the crack it was filling and spilled out onto the ground to feed new surface flows. As of early afternoon on 3 September, lava on the surface was 13.2 km from the vent and 1.3 km from the E boundary of the Wao Kele o Puna Forest Reserve. All older lava flows (1983-2014) are shown in gray; the yellow line marks the lava tube. Courtesy of HVO. |
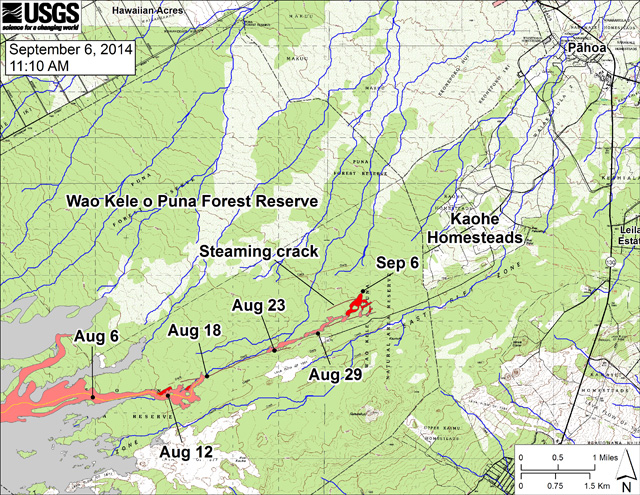 |
Figure 237. A map describing the state of Kīlauea's June 27th lava flow on 6 September 2014. The larger scale expands the area of coverage to see both the distal part of the lava flow and its relation to nearby Puna communities. This map also depicts the distal ends of the flow at various dates in time. The area of the flow on 3 September is shown in pink, while widening and advancement of the flow as mapped at ~1110 on 6 September is shown in red. The black dots mark the flow front on specific dates. The blue lines show the modeled steepest down-slope paths (see text). The narrowness of the flow was attributed to areas of linear down-dropped zones (grabens) and cracks along the E rift zone. Courtesy of HVO. |
Kauahikaua (2007) discussed the use of an appropriate digital elevation model (DEM) to calculate the steepest path of descent along the East rift zone (blue lines in figure 237 and subsequent figures). The basis of that report was a 1983 digital elevation model (DEM). For the case at hand, Bulletin editors are uncertain about the exact dataset used to make the model. Whatever their source, the blue lines on the subsequent maps (below) can be used to infer the approximate directions of the flow's potential advance. These models are imperfect since, for example, the maps have only a finite resolution, and they may lack the updated distribution of lava flows, which themselves change the topography. Kauahikaua (2007) points out that seemingly subtle differences between actual topography and the model may lead to divergence from the modeled lines of steepest descent.
In early September the flow changed its direction of advance. The flow, initially headed almost N along one of the modeled paths of greatest descent (blue lines). By 10 September the direction of advance curved, shifting again more to the E (figure 238). On 3 September, HVO raised the Volcano Alert Level from Watch to Warning, where they both remained during the rest of 2014.
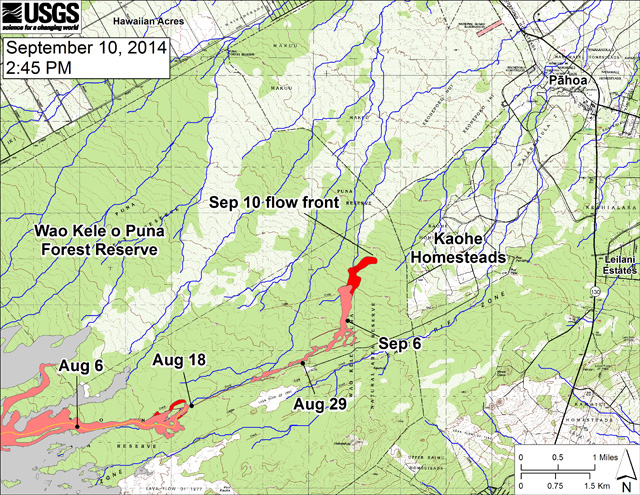 |
Figure 238. A map describing the state of Kīlauea's lava flow on 10 September 2014, but also emphasizing points of farthest advance through August and early September. The distal end of the pink region shows the state of advance as late as 1245 on 8 September 2015. The red region shows advance from that time until about 1445 on 10 September. Blue lines show modeled steepest paths of descent (see text). Courtesy of HVO. |
On 15 September, HVO noted that the flow entered a subdivision called the Kaohe Homesteads (figure 239). They said that at this stage the flow was still within the vacant, forested NW portion of subdivision.
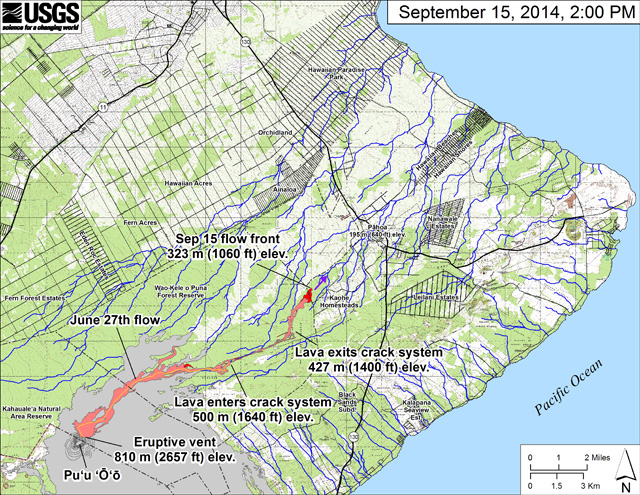 |
Figure 239. A map describing the state of advance for Kīlauea's lava flows on 15 September 2014. The area of the flow as of 12 September at 1230 appears in pink. The area of flow advance after that, and as late as 15 September at 1400, appears in red. The active flow reached 15.5 km from the vent and had crossed the Wao Kele o Puna Forest Reserve boundary progressing into the vacant NW corner of Kaohe Homesteads. At this stage, HVO noted, the flow front was situated 4.3 km upslope from Pahoa Village road. HVO also reported the flow length as measured along the curving path of the lava-tube (yellow line) as 17.7 km. The purple arrow shows HVO's short-term projection of flow direction based on topography and recent flow behavior. Blue lines depict the modeled steepest lines of descent (see text). Courtesy of HVO. |
By 19 September the flow still progressed NE through Kaohe Homesteads, HVO noted. For the previous several weeks, the flow had been moving through thick forest but around this time the flow front reached the forest boundary (figure 240) and more open ground.
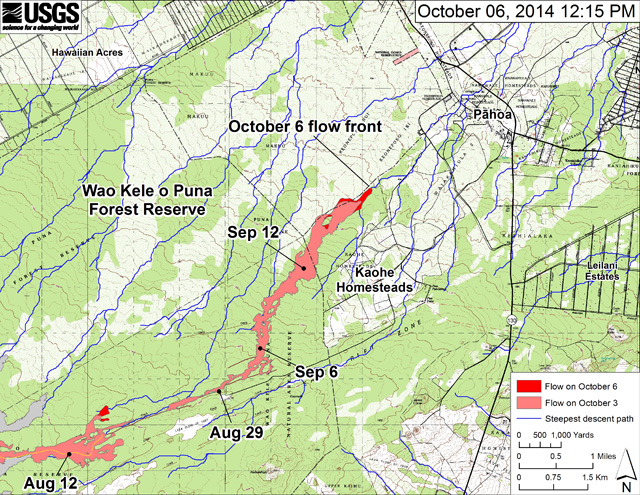 |
Figure 240. A map (with key) describing the state of Kīlauea's lavas on 6 October 2014. Note the Forest Reserve and its boundary (a thin line crossing the flow a few hundred meters E of the 12 September flow front). HVO noted that vegetation density dropped after crossing that boundary. Blue lines depict the modeled steepest lines of descent (see text). Courtesy of HVO. |
The flow advanced at an increased rate during 22-23 October, and at 1400 on 24 October the flow front pushed ahead as a narrow lobe reaching ~19 km from the Pu'u O'o vent. The front was 135 m from Cemetery Rd./Apa?a Street, two roads on the W outskirts of town. On 26 October the flow's leading tip advanced through Pahoa cemetery.
During 22-28 October HVO reported that the lava flow remained active. On 22 October a narrow lava flow (less than 50 m wide) that had overtaken the flow front during the previous few days moved into a small gully. It sometimes moved as fast as 300 m/day (many times faster than the typical). Another breakout upslope continued to advance at a slower rate. On 24 October, HVO scientists aboard an overflight measured the cross-sectional area of the lava tube feeding the flow at the vent. Their measurement suggested a slight increase in the lava supplied to the flow.
At approximately 0350 on 25 October lava crossed Apa'a Street and continued to advance towards the town of Pahoa. Throughout the morning the flow moved down the Pahoa cemetery driveway and then turned SE into adjoining pasture. The Aviation Color Code remained at Orange and the Volcano Alert Level remained at Warning. At 0900 on 26 October the flow was an estimated 140 m wide. The next day it had narrowed to 100 m wide and was about 570 m from Pahoa Village Road. At about 0200 on 28 October the flow had reached the first occupied residential property. The leading edge of the flow was less than 50 m wide but increased to 150 m upslope. At 1730 the lava flow was 310 m in a straight-line distance from Pahoa Village Road and about 900 meters in a straight-line distance from Highway 130. The Aviation Color Code remained at Orange and the Volcano Alert Level remained at Warning.
According to news articles, Pahoa is a town with 800-900 residents, and besides homes, contains small shops. A school and a few roads were closed. Crews were building temporary access roads and trying to build berms to divert lava away from the heavily traveled Highway 130, which passes through the town.
On 2 November, the lava flow front stalled, but scattered breakouts occurred upslope of the flow front. HVO documented in their online Photo and Video section that over the past several days leading up to 7 November, the flow had undergone inflation (thickening).
Although an earlier flow lobe had crossed Apa?a Street / Cemetery Road during October, on 9 November witnesses watched as fresh lava crossed asphalt pavement there, causing combustion with yellow flames and black sooty plumes. HVO cautioned that burning roads creates toxic fumes that can cause eye and respiratory tract irritation, as well as headaches, rashes, cough, and possibly cancer. On 25 October just a few hours after the flow crossed the road, the lava was only about 1 m thick. Ten days later, the flow grew to ~4 m thick.
The next map (figure 241) shows the lava's position as of 10 November 2014 with some earlier dated points of farthest advance indicated. On 10 November a breakout moved along Apa?a Street and onto private property setting an unoccupied home there on fire. According to news sources, this was the first home to be set on fire by the June 27th lava flow. Residents had long ago moved out of the wood frame structure, and had cleared out their belongings. The demise of the structure was widely seen in the news.
Around mid-November a solid-waste transfer station near that portion of the lava flow was the subject of numerous photos, including those documenting flow inflation, burning asphalt pavement, and how a strong cyclone (wire mesh) fence provided a an effective but short-lived barrier. HVO posted a photo disclosing how lava encroached close to the station on 13 November, crossing a fence and most of an access road that loops around the station.
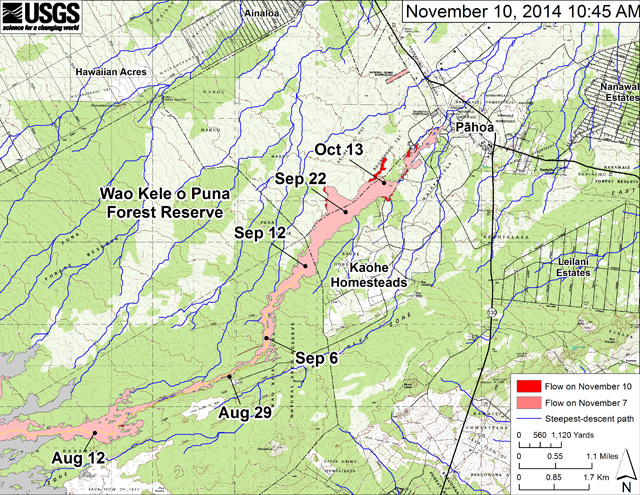 |
Figure 241. A map (with key) describing Kīlauea lava flows on 10 November 2014. On that day, surface activity was present along the N margin in the first few kilometers upslope (W) of the flow tip. For reference, Apa?a Street/Cemetery Road intersects the flow near the breakout farthest to the E. Blue lines depict the modeled steepest lines of descent (see text). Courtesy of HVO. |
During an overflight on 1 December volcanologists measured a cross-sectional area of the lava stream within a tube near Pu'u 'O'o. They found a 25% reduction in area compared to the previous week. The result was consistent with less lava flowing through the tube due to summit deflation, which had been ongoing since 29 November.
A 21 December satellite image showed the flow moving towards Pahoa. The image came from the Advanced Land Imager instrument onboard NASA's Earth Observing 1 satellite. The image provided a view of active breakouts on this downslope (E) portion of the flow. Surface lava was active around the leading tip of the flow, but a short distance upslope (W) of the leading tip there was an absence of surface breakouts. About 1.5-2 km W and upslope of the leading tip of the flow, many scattered breakouts were indicated. Thus, HVO concluded, the image emphasizes that lava-flow movement was not limited to the flow front.
Figure 242 shows the lava flow one day before the end of 2014.
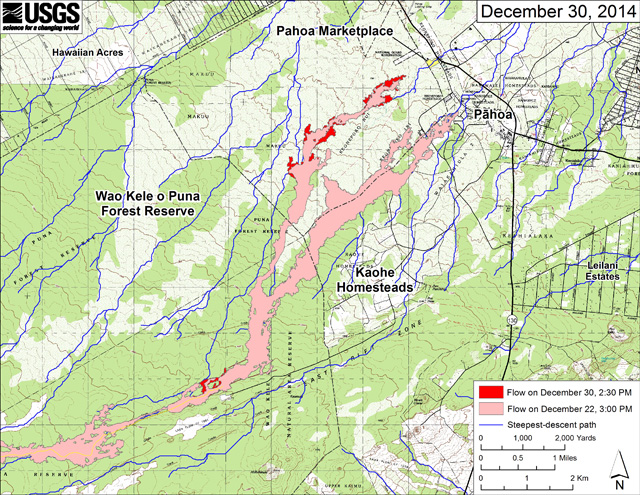 |
Figure 242. A map describing lava flows on 30 December 2014. This large-scale map shows the distal part of Kīlauea's active E rift zone lava flow in relation to nearby Puna communities. The area of the flow on 22 December at 1500 is shown in pink; the areas that widened and advanced by 1430 on 30 December are shown in red. Most surface activity was within the leading 3 km of the flow's N lobe, but other small breakouts were scattered the flow in an area 7-8 km W of Pahoa (a region HVO described as just N of the True/Mid-Pacific geothermal well pad). One other breakout, outside the map area, was also active near Pu'u O'o. (As we will discuss in our next Bulletin report on Kīlauea, the June 27th flow remained active at least as late as April 2015.) Courtesy of HVO. |
At the end of 2014, Kīlauea continued to erupt both at its summit and at Pu'u O'o along the East rift zone. An overflight on 1 January 2015 confirmed that the front of the 27 June lava flow remained stalled. However, HVO's Daily Update (issued at 0913 on 1 January) also noted a breakout along the S margin of the flow and 150 m up slope of the flow front, which had advanced ~20 m since the afternoon on the 31st. In addition to the aerial observations, farther back (upslope and W) from the flow front HVO noted that satellite data acquired on 31 December showed areas of activity 3 and 6 km W of the flow front .
Graphical approaches to scientific and hazards communication. The HVO website features a hazard map for Kīlauea (HVO, 1997). It shows the relative degree of hazard from lava flows for different areas of the volcano. The E rift zone is within Zone 1, which HVO (1997) states "is the most hazardous; it consists of the summit area and rift zones because Kīlauea's frequent eruptions originate in these areas."
As a result of the June 27th lava flow showing no signs of halting, on 3 December 2014, William P. Kenoi, the mayor of the County of Hawaii signed a proclamation that continued the state of emergency in the Puna district. This followed earlier proclamations signed on 4 September and 16 October 2014.
Figure 243 illustrates the advance of the June 27th lava flow from Pu'u O'o towards infrastructure such as Pahoa and the road through it (HI-130). The W-looking view has the advancing lava heading towards the reader. Figure 243 contains both a plot and an image of the June 27th lava flow, with four lobes identified by color coding (as defined on the right side of the figure). The illustration was posted on social media and serves to educate residents (it is not from a peer-reviewed publication). The same author has generated numerous other graphics associated with the advancing lavas and the geography of the Puna district, including relevant census and economic data, in what are often called infographics. Another example, focusing on roads, is figure 244.
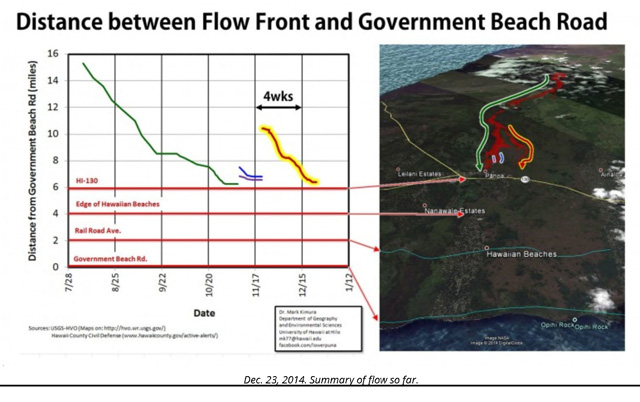 |
Figure 243. Diagram that shows both a plot (at left) and an oblique view of the land surface (at right) summarizing lava advance as of 23 December 2014. In the view at right the colored lines define some of the critical flow lobes. The plot shows position versus time (during 28 June 2014 to 12 January 2015 in 28-day increments). Pahoa (indicated) resides on route 130 (HI-130). Many of the labeled features (Hawaiian Beaches, Rail Road Avenue, and Government Beach Road) may also be seen in figure 239>. Courtesy of Mark Kimura (University of Hawaii at Hilo). |
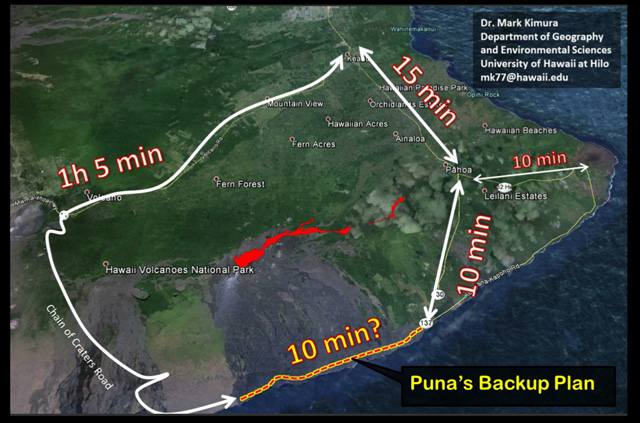 |
Figure 244. An illustration of approximate drive times between various locations near the June 27th lava flow. The lava covered portion of the Chain of Craters road between Hawaii Volcanoes Nation Park at the W and Kalapana at the E is indicated as the yellow line with red dashes (the gray, lava covered portion, is ~13 km in length). Courtesy of Mark Kimura. |
Work began on 24 October 2014 on the emergency access route between Hawai'i Volcanoes National Park and Kalapana along the historic portion of Chain of Craters Road-Kalapana alignment (yellow and red dashed line, figure 244). The lava-covered portion of that road is ~13-km long. According the National Park Service, the emergency route will assist residents of lower Puna district, whose access to the rest of the island would otherwise be cut off if E-flowing lava were to reach the ocean. According to a news article by Damon Tucker, bulldozers working inward from the E and W ends met in the middle on 6 November. The article noted that the roadbed was still considered 'rough grade' and when opened it will be ~6-m wide, 2 lane, and gravel surfaced. The road was intended chiefly for residents (and their agents and service provders) and, as planned, will not be open to the general public or park visitors. On the basis of several reports Bulletin editors found, the road's projected eventual cost varied within the range of 7-15.5 million dollars.
Lava lake heights in Overlook crater. At the summit, a lava lake resides in Overlook crater (see map of the Kīlauea summit caldera area in the previous report, figure 229). Overlook crater is a source of ash, spatter, pelee's hair, and this area also vents the bulk of the SO2; emissions (discussed in a subsection below). HVO Daily Updates describe Overlook crater as a pit or crater in the floor of the larger Halema`uma`u Crater. That crater resides, in turn, on the floor of the larger Kīlauea caldera or crater. The pit is about 160 m in diameter at the ground surface on the Halema`uma`u crater floor. At a depth of 200 m below the Halema`uma`u crater floor (the deepest point visible when the lake drains to those depths) the pit is ~50 m in diameter. HVO Daily Updates also said that a lava pond or lake in the pit has been in evidence since November 2009 and through 2014. The surface of the lake moved up and down and measurements reflect the depth below the crater floor.
Overall, from available data during 27 June to 31 December the lake surface ranged between 30 and 70 m below the pit's rim at the Halema'ama'u crater floor. During 27 June to 9 July 2014 the lake remained fairly stable at near 30 m depth below the floor. Starting a few days after that and until 19 September the lake was in the approximate range 30-60 m deep. On 20 September it reached ~65 m deep. During 21-24 September daily distances to the lake surface descended with attendant fluctuations to ~70 m deep. During 25 September to 3 November the lake remained in the range of 40-70 m through the end of the year, although the depths were not specifically given during much of November and December.
HVO Daily Updates contain the following general background explaining more about the lava lake. Overlook crater has been more-or-less continuously active since it opened during a small explosive event on 19 March 2008. Small collapses in the Overlook crater are common, and over time have resulted in a gradual enlargement of the Overlook crater. During 2013 and early 2014, the lava level has been typically between 30 m and 60 m below the floor of Halema`uma`u Crater. The lake level responds to summit tilt changes with the lake generally receding during deflation and rising during inflation.
Geophysical monitoring. Geophysical monitoring, including seismicity at the summit was summarized in HVO Daily Updates during 27 June to 30 December. Located earthquakes in the summit area were most reliably reported only during 27 June through 7 August, an interval when they were often in the range 5 to 36 events per day. After that, the number of events was seldom reported although some comments noted an occasional number or a larger event (e.g., on 14 November, an M ~3.5 earthquake on Kīlauea's S flank) and many cases mentioned 'several' located earthquakes or commented on a lack of changes in seismicity without further quantification. Tremor and small seismic swarms were noted often. For example, a swarm of long-period earthquakes occurred during 20-21 August centered beneath the summit caldera at ~8 km depth. Epicenters were reported elsewhere (besides the summit), for example on the S flank and various parts of the E rift zone.
In multiple entries during the reporting interval, episodes of tremor were interpreted by HVO as linked to spatter on the surface of the lava lake.
The 19 October Daily Update made these comments about seismicity, tilt, and summit deformation measured by GPS. "A cluster of small seismic events occurred at a shallow level beneath Kīlauea's upper East Rift Zone at about the time that ground tilt switched from inflation to deflation. Such behavior is fairly common. Seismic tremor beneath the summit remained low and varied with changes in spattering on the surface of the lava lake. GPS receivers spanning the summit caldera recorded about 5 cm (2 in) of extension between early May and early July [2014]. Since then, little significant extension or contraction has occurred."
SO2 flux data. Table 12 contains SO2 flux data extracted from HVO Daily Updates for the interval 11 June 2014 through 13 January 2015. Near the start of that interval, during 25 June-1 July 2014, SO2 fluxes at Halema'uma'u yielded the highest values of the interval, 8,400 metric tons per day (t/d). This was about 10% higher than the largest value reported in the first half of 2014 (BGVN 39:09). Overall, SO2 fluxes for Pu'u 'O'o and associated E rift zone sources of degassing yielded somewhat elevated values. During the week of 25 June to 1 July 2014 scientists recorded fluxes of 900 t/d, about double the higher values HVO typically reported since July 2012.
Table 12. An overview of approximate and preliminary S02fluxes reported for Kīlauea and some associated comments during 11 June 2014 to 13 January 2015. The majority of these measurements were averages or ranges for a week-long interval recording plumes from gases vented at the summit caldera. "Minor ash" represents cases for summit measurements where HVO noted "a tiny amount of particulate material carried aloft by the plume." Note comment in text below table about the shift in measurement methodology, which resulted in higher values. The measurements in brackets, [ ], record flux estimates on the stated dates from all sources vented on the East Rift Zone (ERZ). For brevity, ERZ measurements during mid-July to mid-September were omitted from the table. All data and quoted text came from HVO Daily Updates (see link in the Information Contacts section).
| Date (or range) | SO2 flux (metric tons/day, t/d) at summit [East Rift Zone, ERZ]; Comments |
| 11 Jun-17 Jun 2014 | 2,400-6,400 t/d |
| 18 Jun-24 Jun 2014 | 2,800-5,200 t/d. [ERZ on 24th: 250 t/d (". . . emission rates typically ranged between 150 and 450 t/d since July 2012.") |
| 25 Jun-01 Jul 2014 | 3,800-8,400 t/d. Highest value in table. [ERZ on 27th: 900 t/d; ". . . measured shortly after the new breakout started; emission rates have typically ranged between 150 and 450 t/d since July 2012."] |
| 02 Jul-08 Jul 2014 | 5,800-6,900 t/d (minor ash) [ERZ on 3rd: 500 t/d] |
| 09 Jul-15 Jul 2014 | 4,200-6,300 t/d (minor ash) |
| 16 Jul-22 Jul 2014 | 4,500-5,700 t/d (minor ash) |
| 23 Jul-29 Jul 2014 | 3,700-7,100 t/d (minor ash) |
| 30 Jul-05 Aug 2014 | 3,600-6,100 t/d (minor ash) |
| 06 Aug-12 Aug 2014 | 5,100 t/d (minor ash) |
| 03 Aug-19 Aug 2014 | 2,400-5,000 t/d (minor ash) |
| 20 Aug-26 Aug 2014 | 4,100-5,900 t/d (minor ash) |
| 27 Aug-02 Sep 2014 | 3,300-6,700 t/d (minor ash) |
| 03 Sep-09 Sep 2014 | 3,300-7,600 t/d (minor ash) |
| 10 Sep-16 Sep 2014 | 4,300-6,800 t/d (minor ash) |
| 17 Sep-23 Sep 2014 | 4,400-6,300 t/d (minor ash) [ERZ on 24th: 375 t/d] |
| 24 Sep-30 Sep 2014 | 3,600-5,200 t/d (minor ash) [ERZ on 25th: 550 t/d] |
| 08 Oct-14 Oct 2014 | 2,900-6,500 t/d [ERZ on 9th: 450 t/d] |
| 15 Oct-21 Oct 2014 | 2,700-3,600 t/d |
| 22 Oct-28 Oct 2014 | 4,250-7,000 t/d [ERZ on 23rd: 340 t/d] |
| 29 Oct-04 Nov 2014 | 3,400-6,400 t/d [ERZ on 31st: 320 t/d] |
| 05 Nov 2014 | 6,200 t/d (but winds thwarted later repeat measurements during week ending on 11th) |
| 18 Nov 2014 | 4,400 t/d (another 1-day measurement like that above) |
| 19 Nov-25 Nov 2014 | 6,900 t/d |
| 27 Nov-02 Dec 2014 | 4,300 t/d [ERZ on 26th: 250 t/d] |
| 03 Dec-09 Dec 2014 | 4,100 t/d |
| 10 Dec-16 Dec 2014 | 3,100-6,500 t/d [ERZ on 11th: 300 t/d] |
| 17 Dec-23 Dec 2014 | 5,500-7,700 t/d [ERZ on 19th: 250 t/d] |
| 25 Dec-31 Dec 2014 | 6,000 t/d |
| 31 Dec 2014-06 Jan 2015 | 5,400 t/d |
| 07 Jan-13 Jan 2015 | 4,500 to 7,600 t/d [ERZ on 7th: ~200 t/d] |
HVO emphasized the following caveat described in more detail in (BGVN 39:09). "Starting in 2014, [HVO began reporting] the emission rate estimated by a new, more accurate method. The numbers increase by a factor of 2-4 but the actual emission rate has not changed."
The gas plume from the summit area (Kīlauea caldera), sometimes included minor amounts of ash-sized tephra (sometimes noted in table 12). These included fresh spatter bits and Pele's hair from the circulating lava lake in Overlook crater. In general, the heaviest tephra deposited near the source; the finer tephra, several kilometers downwind.
References. Kauahikaua, J., 2007, Lava flow hazard assessment, as of August 2007, for Kīlauea East Rift Zone eruptions, Hawai'i Island: U.S. Geological Survey Open-File Report 2007-1264, 9 p., ( http://pubs.usgs.gov/of/2007/1264/ )
Kimura, Mark, 23 March 2015, Lower Puna infographics (https://www.facebook.com/lowerpuna) [Accessed in March 2015].
Poland, M.P., Takahashi, T.J., and Landowski, C.M., eds., 2014, Characteristics of Hawaiian volcanoes:
U.S. Geological Survey Professional Paper 1801, 428 p., http://dx.doi.org/10.3133/pp1801.
University of Hawaii at Hilo, 2015, UH Hilo Stories: Puna lava flow in graphics & maps, updated Feb. 22 (http://hilo.hawaii.edu/news/stories/2014/09/22/puna-lava-flow-in-graphics-maps/).
Geological Summary. Kilauea overlaps the E flank of the massive Mauna Loa shield volcano in the island of Hawaii. Eruptions are prominent in Polynesian legends; written documentation since 1820 records frequent summit and flank lava flow eruptions interspersed with periods of long-term lava lake activity at Halemaumau crater in the summit caldera until 1924. The 3 x 5 km caldera was formed in several stages about 1,500 years ago and during the 18th century; eruptions have also originated from the lengthy East and Southwest rift zones, which extend to the ocean in both directions. About 90% of the surface of the basaltic shield volcano is formed of lava flows less than about 1,100 years old; 70% of the surface is younger than 600 years. The long-term eruption from the East rift zone between 1983 and 2018 produced lava flows covering more than 100 km2, destroyed hundreds of houses, and added new coastline.
Information Contacts: Hawaiian Volcano Observatory (HVO), U.S. Geological Survey, PO Box 51, Hawai`i National Park, HI 96718, USA (URL: https://volcanoes.usgs.gov/observatories/hvo/, Daily Updates, https://volcanoes.usgs.gov/observatories/hvo/activity/Kilaueastatus.php, and (weekly) Volcano Watch, https://volcanoes.usgs.gov/observatories/hvo/volcanowatch/); Recent maps, https://volcanoes.usgs.gov/observatories/hvo/maps); and Mark Kimura, Department of Geography and Environmental Sciences, University of Hawaii at Hilo, Geography Department, 200 W. Kawili St., Hilo, HI 96720-4091.