Report on Axial Seamount (Undersea Features) — March 2015
Bulletin of the Global Volcanism Network, vol. 40, no. 3 (March 2015)
Managing Editor: Richard Wunderman.
Axial Seamount (Undersea Features) Cabled array provides data for suspected underwater eruption in April 2015
Please cite this report as:
Global Volcanism Program, 2015. Report on Axial Seamount (Undersea Features) (Wunderman, R., ed.). Bulletin of the Global Volcanism Network, 40:3. Smithsonian Institution. https://doi.org/10.5479/si.GVP.BGVN201503-331021
Axial Seamount
Undersea Features
45.95°N, 130°W; summit elev. -1410 m
All times are local (unless otherwise noted)
Axial Seamount appears to have undergone an eruption starting 23-24 April 2015 Pacific Time (local time= UTC-08 hours, or Day Light Saving time, 8 March to 1 November = UTC-07 hours on the US west coast). At this time, evidence of the eruption stems from increases in seismicity, deformation, and seawater temperature around Axial, recorded in the weeks after 23 April UTC. The length of the eruption is currently unknown; however, it likely lasted days to weeks (William Chadwick, personal communication). Two expeditions to Axial are planned for this coming July and August on R/V Thompson, during which further investigation regarding the 2015 eruption will be completed (personal communication).
Axial Seamount sits along the Juan de Fuca ridge ~480 km off the coasts of Oregon and Washington (figure 1 in BGVN 23:01). Eruptions were detected seismically and geodetically in 1998 and 2011 and confirmed shortly after each eruption during submersible dives. Since about 410 AD, the volcano produced over 50 lava flows (Clague and others, 2013). On this basis, Axial is described as the NE Pacific's most active submarine volcano.
In this Bulletin report, we present information on the April 2015 eruption taken from several sources referred to in the text and provided in the Reference list near the end of this report. The sources include (a) an Oregon State University (OSU) online press release (OSU, 2015); (b) blog posts on the website of NOAA's Pacific Marine Environmental Laboratory's (PMEL) Earth-Ocean Interactions Program (EOI) (Chadwick and Nooner, 2015); (c) a post on the Networked Observations and Visualization of the Axial Environment (NOVAE) website (Delaney, 2015); and (d) seismic data posted on William Wilcock's website (Wilcock, 2015).
The last two Bulletin reports (BGVN 36:07 and 37:10) detailed Axial's previous eruption, which occurred during 6-12 April 2011 and erupted 99 x 106 m3 of lava.
Instrumentation. Since September 2014, Axial Seamount has been a part of the Ocean Observatories Initiative's (OOI) Cabled Array, which is operated by the University of Washington. As explained in their online literature (OOI, posting date uncertain1), OOI is funded by the National Science Foundation and is "an integrated infrastructure project composed of science-driven platforms and sensor systems to measure physical, chemical, geological and biological properties and processes from the seafloor to the air-sea interface." The Cabled Array, which straddles the Juan de Fuca and North American plates, is one of OOI's seven arrays worldwide (OOI, posting date uncertain1). Within the Cabled Array, there are seven primary nodes (PN) that are connected to a shore station in Pacific City, Oregon, through ~ 900 km of modified telecommunications cable (OOI, posting data uncertain2). This cable provides the PNs with high power and bandwidth that allows for near real-time interactive and adaptive investigation (OOI, posting date uncertain1). Each PN then delivers power and communication to a range of scientific instructions connected to it, such as those connected to the Axial Seamount PN3B (figure 10).
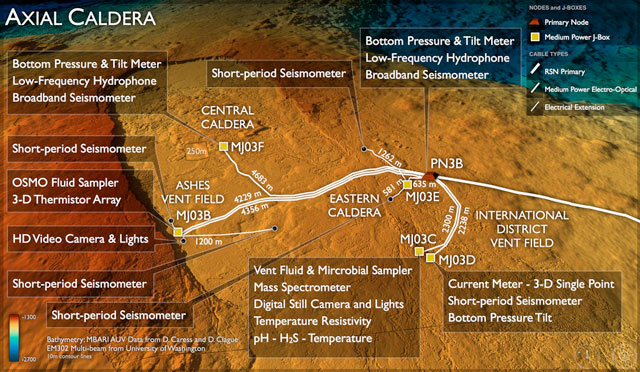 |
Figure 10. Bathymetry map highlighting the various instruments connected to the Axial Seamount Primary Node (PN) 3B. PN3B is one of the seven PNs that comprise OOI's Cabled Array. The white cable (RSN Primary) that goes to the right of the image, connects PN3B and two other PNs (not shown) to the shore station in Pacific City, Oregon. For scale, there is a 250 m square on the map, located next to MJ03F. Image courtesy of Networked Observations and Visualization of the Axial Environment (NOVAE). |
April 2015 eruption. Based on personal communication with Chadwick, around 0530 UTC on 24 April 2015 (2230 Pacific Time on 23 April), increased seismicity was recorded by the instruments in Axial's caldera.
This increased seismicity was the first indication of activity. On 24 April UTC, the daily earthquake count reached nearly 8,000 events/day (figure 11). Before the eruption, the daily earthquake count was generally less than 1,000 events/day (Delaney, 2015). From Wilcock (2015), Bulletin editors obtained a histogram of the daily earthquake count from 16 November 2014 to 14 June 2015; on the histogram, the daily earthquake count from 24 April UTC is represented by the largest bar (figure 11). Wilcock (2015) also provides animations of the preliminary locations of the earthquakes' epicenters at Axial from 23-24 April. The majority of the epicenters were largely clustered on the E side of the caldera, not far from the location of the 2011 eruption (Wilcock, 2015; Delaney, 2015).
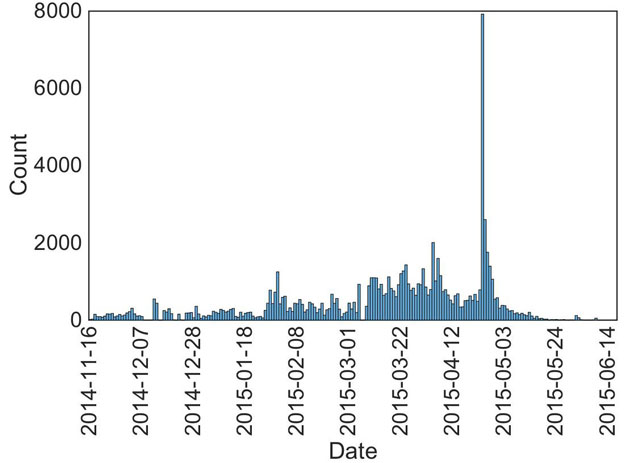 |
Figure 11. Preliminary earthquake histogram showing the daily earthquake counts at Axial Seamount from 16 November 2014 to 14 June 2015. On 24 April UTC, nearly 8,000 earthquakes were recorded (largest bar on the histogram). Dates on the histogram are in UTC. Taken from Wilcock (2015). |
Around 0630 UTC on 24 April 2015 (2330 Pacific Time on 23 April), deformation at Axial Seamount increased considerably (Delaney, 2015). According to Delaney (2015), the instrument that measures bottom pressure and tilt on the seafloor at the Central Caldera site (figure 10) began to indicate deflation (subsidence). This deflationary event was reported to have lasted approximately 12 hours with the seafloor dropping as much as 2.4 m (Delaney, 2015; OSU, 2015). Bulletin editors learned from personal communication with Chadwick that the duration of subsidence at Axial may actually be on the order of ~10 days with the greatest amount of subsidence occurring within the first 24 hours of activity.
Although there was initial uncertainty regarding whether the observed deflation and earthquakes were associated with an eruption (or merely an intrusion), Chadwick and Nooner (2015) cited increases in seawater temperature data that occurred in the days and weeks following 24 April UTC. The observed increases suggested that lava erupted somewhere nearby on the seafloor (Chadwick and Nooner, 2015). The temperature data was collected by the three bottom pressure/tilt instruments, located in Central and Eastern Caldera and the International District Vent District (figure 10). The graph in figure 12 displays the increases documented in the temperature data (PMEL/EOI, 2015).
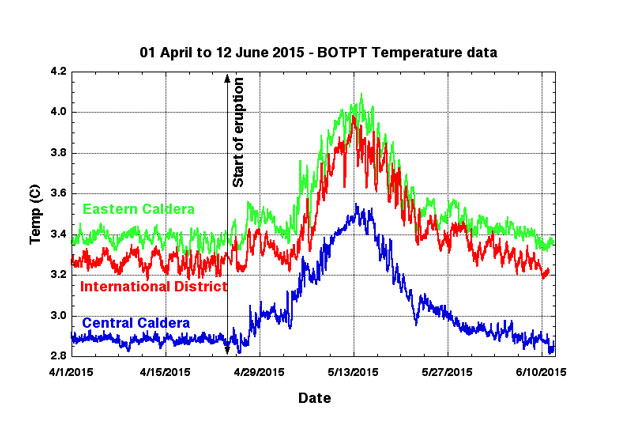 |
Figure 12. Graph presenting seawater temperature data versus date (UTC, 1 April 2015 to 10 June 2015) collected by the bottom pressure and tilt instruments that are part of the OOI Cabled Array. These instruments detected increases in temperature that started on 24 April (indicated on graph) and peaked on 13 May 2015. By 10 June, the temperatures appear to have decreased to levels similar to before the eruption. The increases in temperature appear to be on the order of ~0.6-0.8 °C. Courtesy of PMEL/EOI, 2015 |
For reference, the 2.4 m deflation that occurred is similar to the amount detected in 2011 (BGVN 36:07). Delaney (2015) quoted Chadwick as saying that the amount of deflationary subsidence suggested that a similar amount of magma erupted in 2015 and during Axial's 2011 eruption.
References. Chadwick W and Nooner S, 2015, Successful forecast of the 24 April 2015 eruption at Axial Seamount, NOAA's Pacific Marine Environmental Laboratory's (PMEL) Earth-Ocean Interactions Program (EOI), URL: http://www.pmel.noaa.gov/eoi/axial_blog.html, accessed on 15 June 2015
Clague D A, Breyer B M, Paduan J B, Martin J F, Chadwick W W, Caress D W, Portner R A, Guilderson T P, McGann M L, Thomas H, Butterfield D A, Embley R W, 2013, Geologic history of the summit of Axial Seamount, Juan de Fuca Ridge. Geochem Geophys Geosystems, 14: 4403-4443
Delaney, J, 2015, Axial Activity Intensifies, URL: http://novae.ocean.washington.edu/file/Axial_Activity_Intensifies, accessed on 16 June 2015
NOVAE (Networked Observations and Visualization of the Axial Environment), 2015 http://novae.ocean.washington.edu/story/Latest_News, accessed on 15 June 2015
OSU (Oregon State University), 2015, Researchers think Axial Seamount off Northwest coast is erupting – right on schedule, URL: http://oregonstate.edu/ua/ncs/archives/2015/apr/researchers-think-axial-seamount-northwest-coast-erupting-–-right-schedule, accessed on 15 June 2015
OOI (Ocean Observatories Initiative), posting date uncertain1, OOI Frequently Asked Questions, URL: http://oceanobservatories.org/about/frequently-asked-questions/#01, accessed on 22 June 2015
Ocean Observatories Initiative (OOI), Cabled Array (URL: http://oceanobservatories.org/, accessed on 17 June 2015).
PMEL/EOI (NOAA's Pacific Marine Environmental Laboratory's Earth-Ocean Interactions Program), 2015, Data from the 24 April 2015 eruption at Axial Seamount, URL: http://www.pmel.noaa.gov/eoi/rsn/24April2015_event.html, accessed on 15-22 June 2015
Wilcock, W, 2015, Welcome to William Wilcock's desktop computer, URL: http://alben.ocean.washington.edu/, accessed on 16 June 2015.
Geological Summary. Axial Seamount rises 700 m above the mean level of the central Juan de Fuca Ridge crest about 480 km W of Cannon Beach, Oregon, to within about 1,400 m of the ocean surface. It is the most magmatically and seismically active site on the Juan de Fuca Ridge between the Blanco Fracture Zone and the Cobb offset. The summit is marked by an unusual rectangular-shaped caldera (3 x 8 km) that lies between two rift zones and is estimated to have formed about 31,000 years ago. The caldera is breached to the SE and is defined on three sides by boundary faults of up to 150 m relief. Hydrothermal vents with biological communities are located near the caldera fault and along the rift zones. Hydrothermal venting was discovered north of the caldera in 1983. Detailed mapping and sampling efforts have identified more than 50 lava flows emplaced since about 410 CE (Clague et al., 2013). Eruptions producing fissure-fed lava flows that buried previously installed seafloor instrumentation were detected seismically and geodetically in 1998 and 2011, and confirmed shortly after each eruption during submersible dives.
Information Contacts: William Chadwick, NOAA and Oregon State University, Hatfield Marine Science Center, 2115 S.E. Oregon State University Drive, Newport, OR 97365, USA; Scott Nooner, Department of Geography and Geology, University of North Carolina Wilmington, 601 South College Road, Wilmington, NC 28403-5944, USA (URL: http://people.uncw.edu/nooners/Nooner/); Oregon State University, News and Research Communications, Corvalis, OR (URL: http://oregonstate.edu/ua/ncs/); William Wilcock, School of Oceanography, University of Washington, Marine Sciences Building, 1501 NE Boat Street, Seattle, WA 98195, USA (URL: http://faculty.washington.edu/wilcock/).