Report on Wolf (Ecuador) — October 2016
Bulletin of the Global Volcanism Network, vol. 41, no. 10 (October 2016)
Managing Editor: Edward Venzke.
Edited by A. Elizabeth Crafford.
Wolf (Ecuador) Explosion on 25 May 2015; lava flows down the E and SE flanks, and into the caldera
Please cite this report as:
Global Volcanism Program, 2016. Report on Wolf (Ecuador) (Crafford, A.E., and Venzke, E., eds.). Bulletin of the Global Volcanism Network, 41:10. Smithsonian Institution. https://doi.org/10.5479/si.GVP.BGVN201610-353020
Wolf
Ecuador
0.02°N, 91.35°W; summit elev. 1710 m
All times are local (unless otherwise noted)
The first documented historical eruption in the Galapagos was at Wolf in 1797, and basaltic lava flows have spilled down its flanks a number of times since then. The most recent previous eruption began with an ash plume on 28 August 1982, and continued with lava fountains and flows from a fissure on the SE flank and inside the summit caldera into the first weeks of September 1982 (SEAN 07:08).
Volcan Wolf erupted with a 15-km-high plume of mostly water vapor and SO2 on 25 May 2015. This was followed by the emission of lava flows from a fissure on the SE edge of the caldera down the NE, E, and SE flanks to the ocean for several weeks. Beginning on 13 June, the first lava flows were observed within the crater, and flows down the outer flanks decreased. Lava flows were also observed within the crater via satellite in late June, and strong daily thermal anomalies from the crater continued through 4 July before tapering off.
The volcanoes on the Galapagos Islands are monitored by the Geophysical Institute of the National Polytechnic School (IG-EPN) in Quito, Ecuador, and the Washington Volcanic Ash Advisory Center (VAAC) is responsible for aviation warnings. IG maintains a broadband seismic network and a DOAS (Differential Optical Absorption Spectrometer) SO2 monitoring station on the islands that transmits data to the mainland.
Ecuador's Instituto Geofisico (IG) reported that its seismic station FER1, located on Fernandina Island approximately 38 km SW of Wolf, began recording seismic events in the vicinity of Wolf at 2350 (local Galapagos time) on 24 May 2015. The most significant signal occurred at 0058 on 25 May, corresponding to an explosion and the start of an eruption. This was followed by other smaller seismic events in the following hours. At 0215 local time the Washington VAAC detected a plume that rose to an altitude of 10.7 km and drifted 65 km SW. Ongoing emissions at 0345 were drifting in two directions, S at 13.7 km altitude and ENE as high as 15.2 km. By 0600 the plumes were observed 250 km from the volcano. Later in the day at 1245 a remnant of the original plume was observed 186 km SSE of the summit, while a new emission at 10.7 km was detected 150 km SW. There was no report of ashfall in the Galapagos Islands, leading IG scientists to infer a low ash content for the plume, although a large SO2 plume was identified by satellite instruments.
At first light, personnel from the Galapagos National Park (PNG) were able to photograph the plume and a lava flow erupting from a fissure on the SSE flank (figure 1). A strong thermal anomaly on the SE flank was also detected in MODIS data analyzed by the Hawai'i Institute of Geophysics and Planetology (HIGP) MODVOLC system early on 25 May, and grew stronger in subsequent days. A very strong SO2 plume, eventually releasing around 200 kt of sulfur dioxide, was also captured by the Aura/OMI satellite SO2 instrument on 25 and 26 May (figure 2).
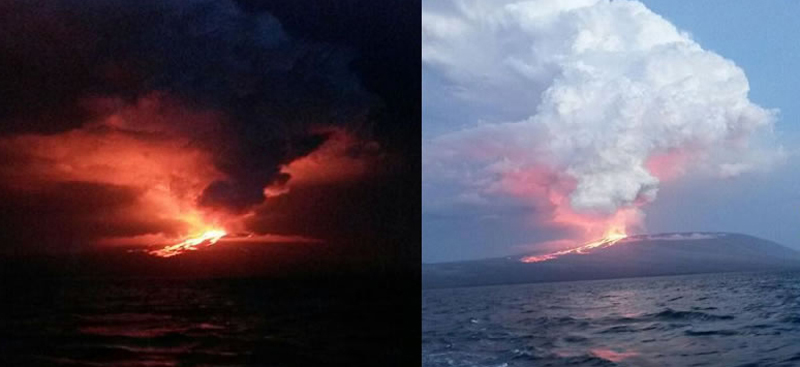 |
Figure 1. The first images of the eruption taken in the early morning on 25 May 2015 show lava flowing down the SSE flank of Wolf. Courtesy of Dr. Galo Quezada, Galapagos National Park (PNG) (IG-EPN, Informe Volcanico Especial Galapagos No. 2, 25 May 2015). |
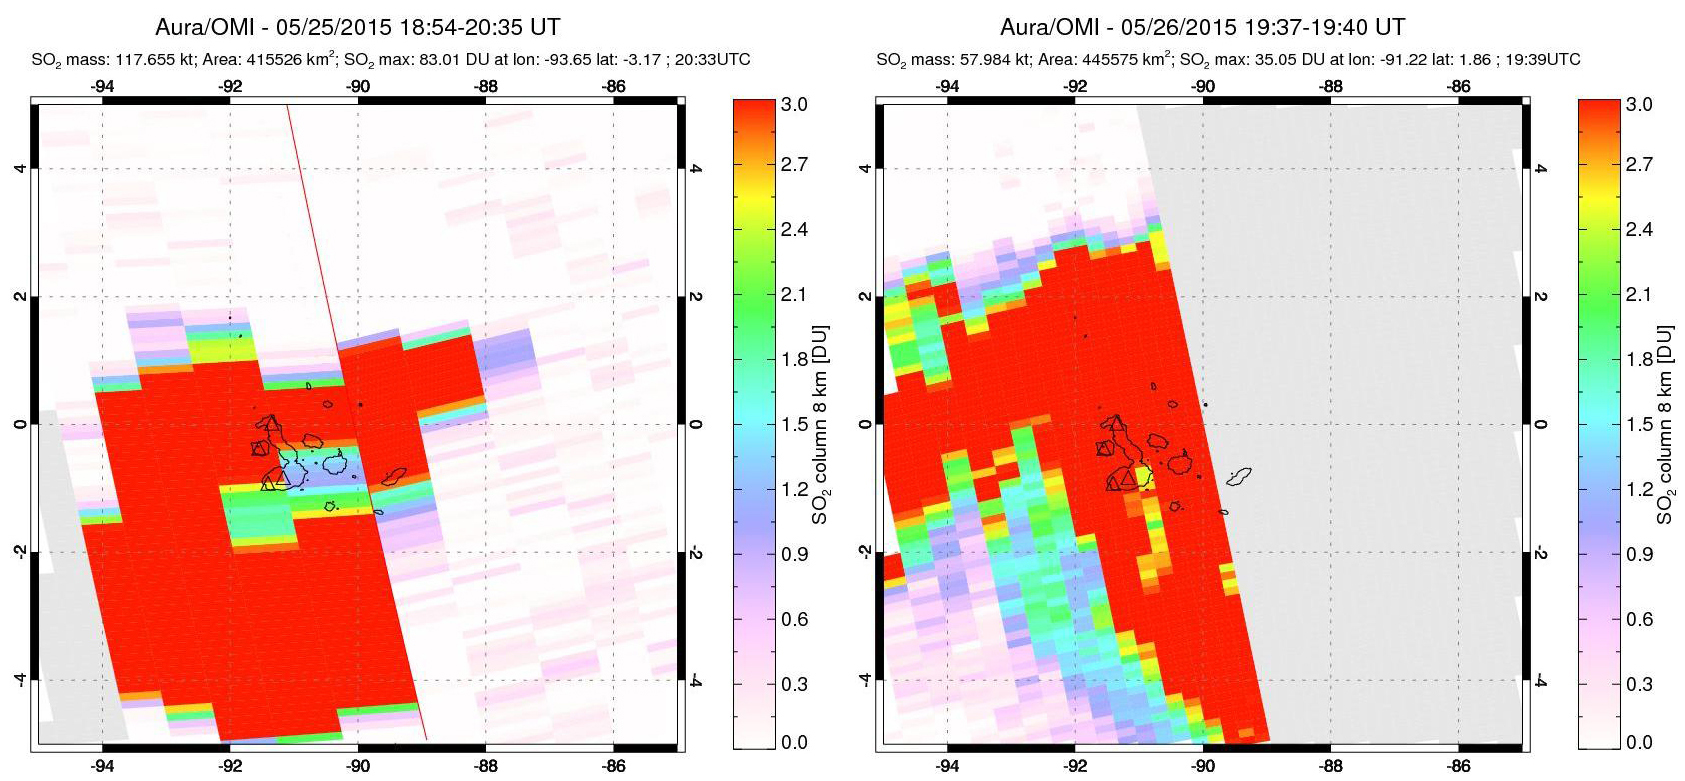 |
Figure 2. Sulfur dioxide emissions from Wolf captured by the OMI instrument on the Aura satellite on 25 and 26 May 2015. The total release for the event was around 200 kilotons of SO2. Courtesy of NASA Goddard Space Flight Center (GSFC). |
In the days following the explosion, lava flows descended the NE, E, and SE flanks from a fissure located near the edge of the caldera. IG scientists were able to observe the flowing lava during an overflight on 29 May (figures 3 and 4). They noted a steam plume rising 2-3 km above the volcano with no visible ash, and a strong sulfur odor.
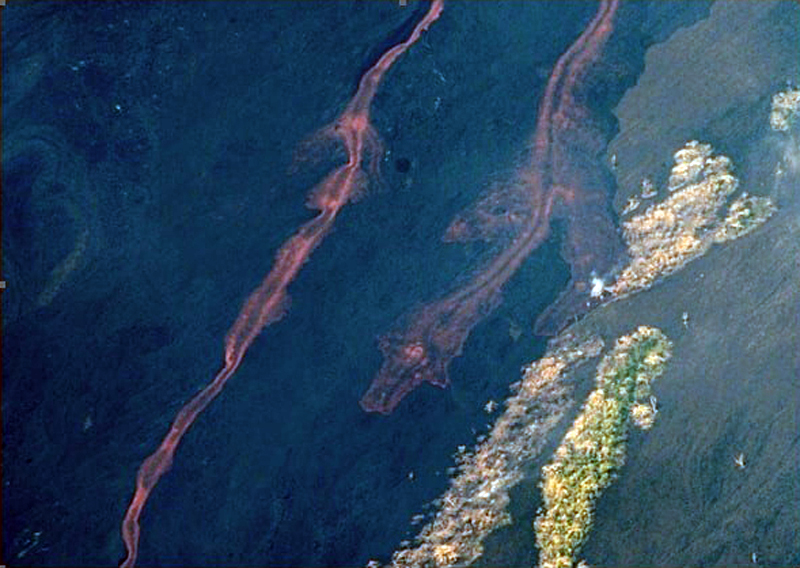 |
Figure 3. Incandescent lava flows down the NE flank of Wolf on 29 May 2015. Courtesy of B. Bernard, IG-EPN (Informe Volcanico Especial Galapagos No. 3, 2 June 2015). |
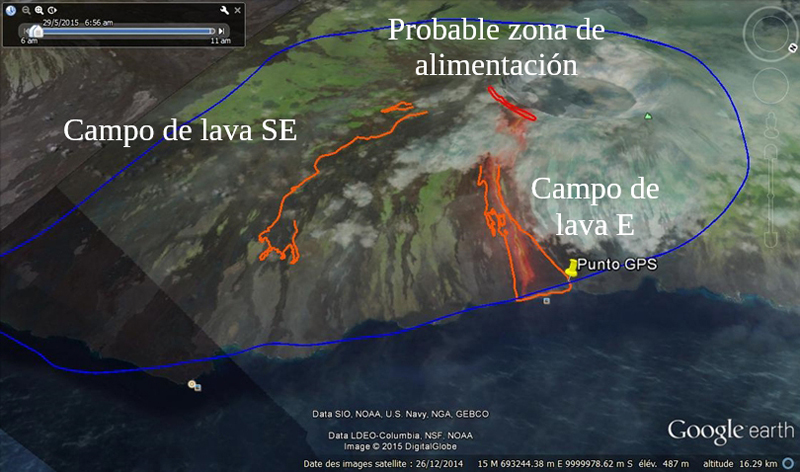 |
Figure 4. Oblique satellite image from the NE of the lava field on the E flank of Wolf. The two incandescent flows are outlined in orange with the probable fissure vent shown in red. The blue line is the flight path taken on 29 May 2015. Image was taken by the ALI (Advanced Land Imager) camera on board the EOS-1 satellite on 28 May 2015, and superimposed on Google Earth imagery by IG-EPN scientists. Courtesy of B. Bernard, IG-EPN (Informe Volcanico Especial Galapagos No. 3, 2 June 2015). |
By 28 May the E lava field was approximately 7 km long and flows had reached the ocean. Thermal imaging during the overflight revealed two areas with apparent maximum temperatures (TMA) greater than 500°C, one at the site of the fissure near the caldera rim, and one in the lava field on the E flank. SO2 emissions measured during the overflight were 40.6 kt/day. Satellite images gathered on 5 and 11 June confirmed the source of the lava flows as an arcuate fissure around the SE and E edges of the caldera in a similar location to the 1982 fissure.
Another overflight by IG-EPN scientists on 12 June confirmed the continuing emission of lava flows down the SE and E flanks. The helicopter landed on the north rim of the crater with a view to the south of the lava flow from the 1982 eruption and gases emitting from the active fissure zone (figure 5). IG scientists heard at least five explosions during their visit to the crater rim. Thermal images gathered during the 12 June flight revealed that temperatures of the flows on the SE flank had dropped to less than 100°C, but temperatures at the fissure vent were still greater than 500°C, and steaming lava was observed near the emission zone (figure 6).
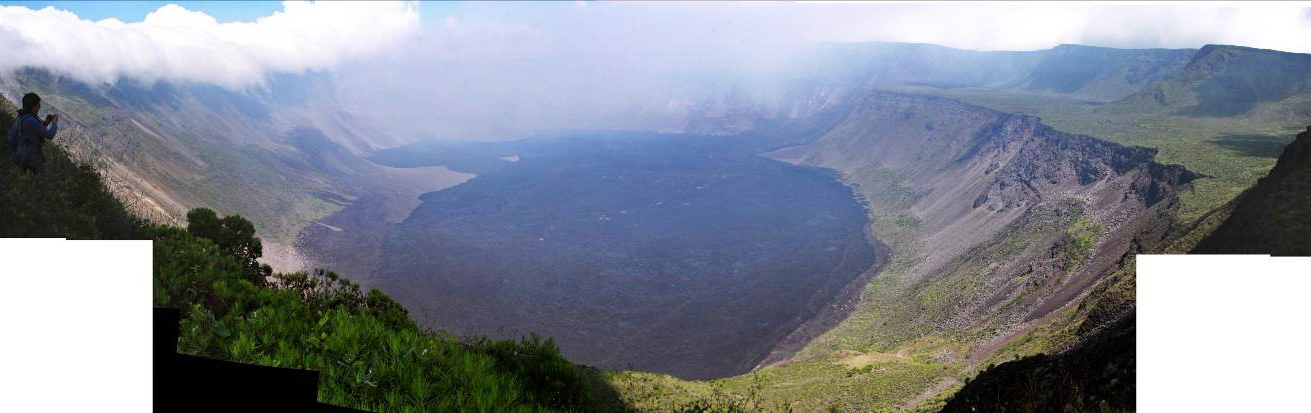 |
Figure 5. Panorama of the interior of the Wolf caldera on 12 June 2015 showing the lava flow from the 1982 eruption covering the floor, and gas clouds from the active fissure on the SE side of the caldera rim. Courtesy of P. Ramon, IG-EPN (Informe Volcanico Especial Galapagos No. 4, 26 June 2015). |
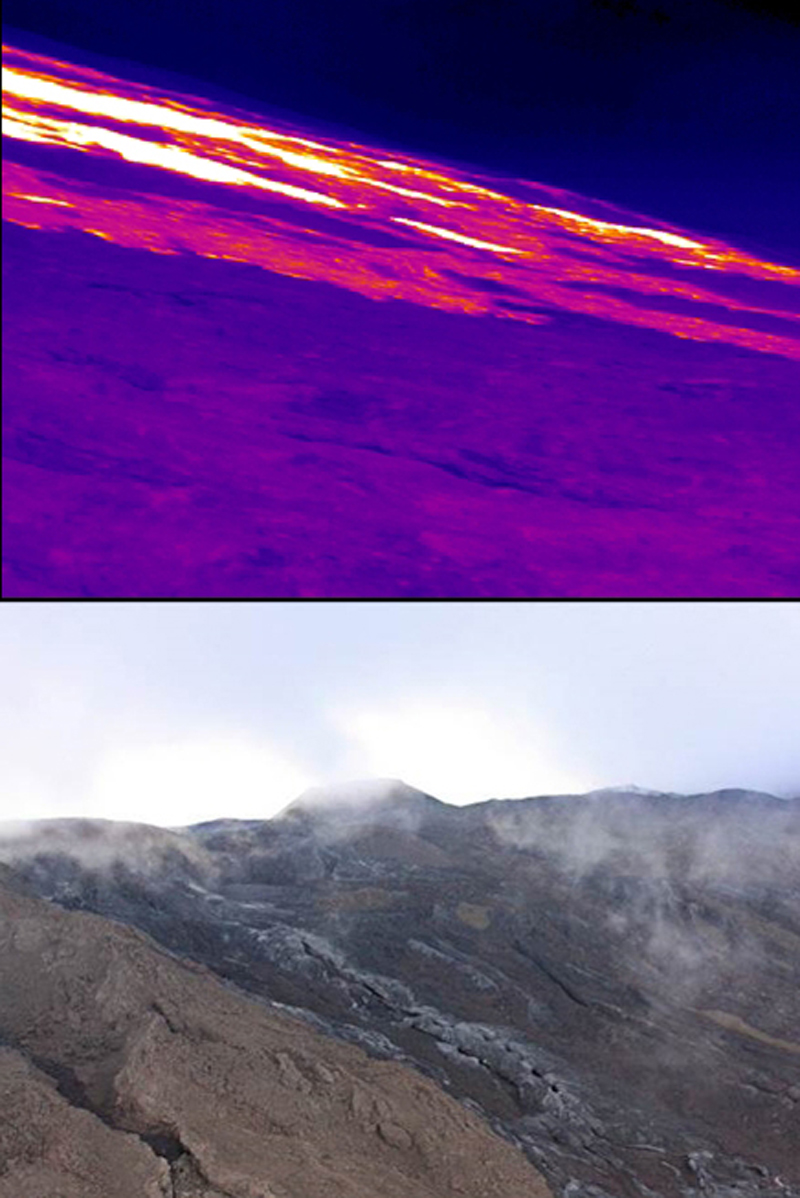 |
Figure 6. Lava flows near the source vent at Wolf on 12 June 2015 seen in a thermal image (top) and regular photograph (bottom). Courtesy of P. Ramon, IG-EPN (Informe Volcanico Especial Galapagos No. 4, 26 June 2015). |
On 13 June 2015 satellite imagery showed new thermal anomalies inside the crater, suggesting active lava flowing into the crater in addition to the flows on the E and SE flanks. This was confirmed with visible low-resolution imagery from the WorldView 3 satellite on 16 June which showed an area of likely incandescence near the S rim. An image from the WorldView 1 satellite on 18 June showed a new lava flow on the floor of the caldera (figure 7). IG-EPN scientists combined the thermal data from their overflights with satellite imagery to define the areas of new lava flow through late June (figure 8).
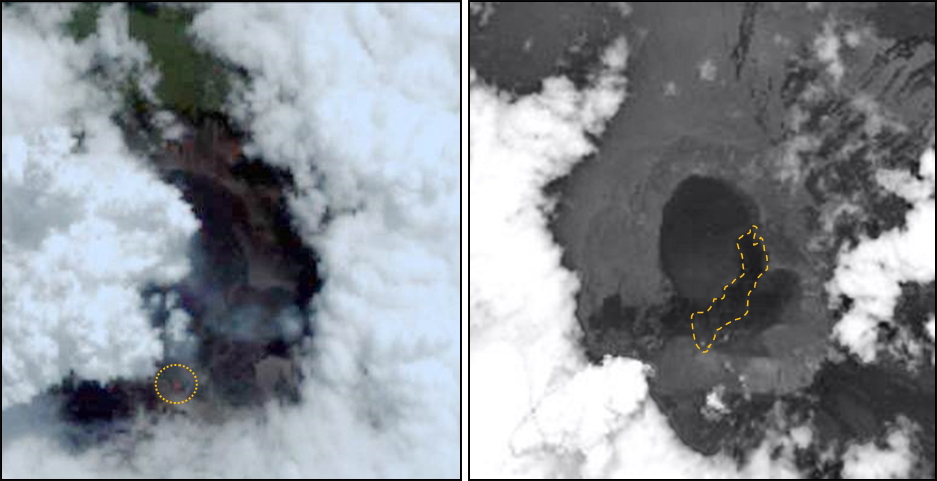 |
Figure 7. Satellite images of Wolf showing an incandescent zone and possible new vent on 16 June 2015 (circle at left; image from WV3 satellite), and a new lava flow inside the caldera on 18 June (right, image from WV1 satellite). Courtesy of IG-EPN (Informe Volcanico Especial Galapagos No. 4, 26 June 2015). |
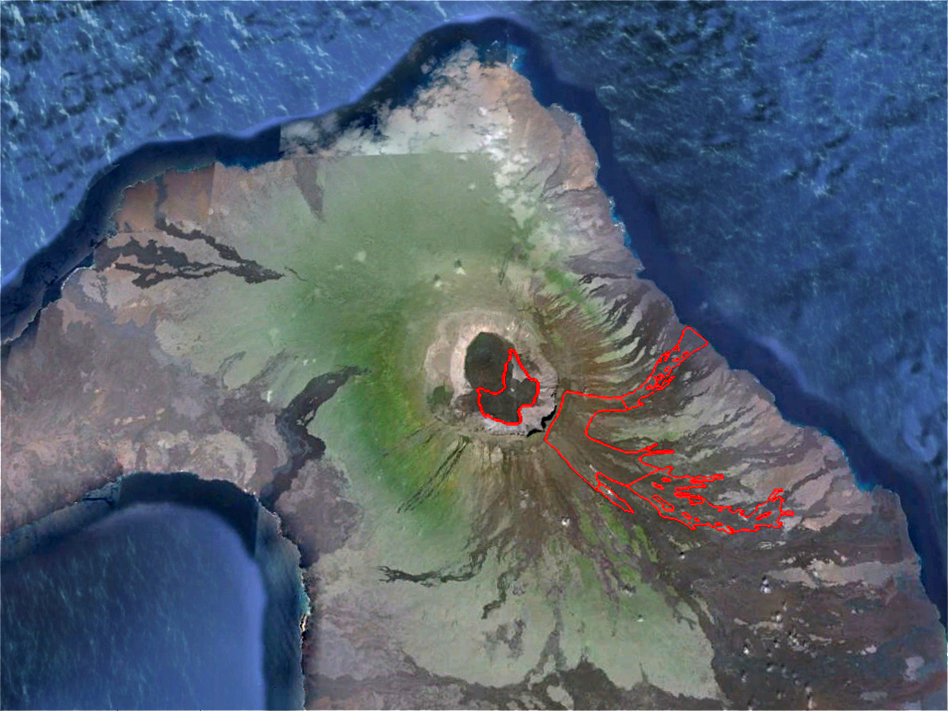 |
Figure 8. Preliminary estimate of areas covered by lava flows from the eruption at Wolf beginning 25 May 2015 through 25 June. Base from Google Earth. Courtesy of IG-EPN (Informe Volcanico Especial Galapagos No. 4, 26 June 2015). |
The thermal alert pixels from the MODVOLC system show an evolution of the heat anomalies from the MODIS infrared satellite data that corresponds well with the satellite imagery and ground observations. The first anomalies were recorded on 25 May 2015. Strong multi-pixel anomalies (in some cases, more than 50 per day) were mapped daily until 4 July. After this, they become intermittent, and the daily number dropped below 11, tapering to one or two pixels every few days between 17 July, with the last two observed on 1 August. Two lobes of lava flows to the E and SE can be distinguished on the MODVOLC maps between 25 May and 12 June; anomalies within the crater appear on 13 June, increase to a maximum in the third week of June, and then taper off during July (figure 9).
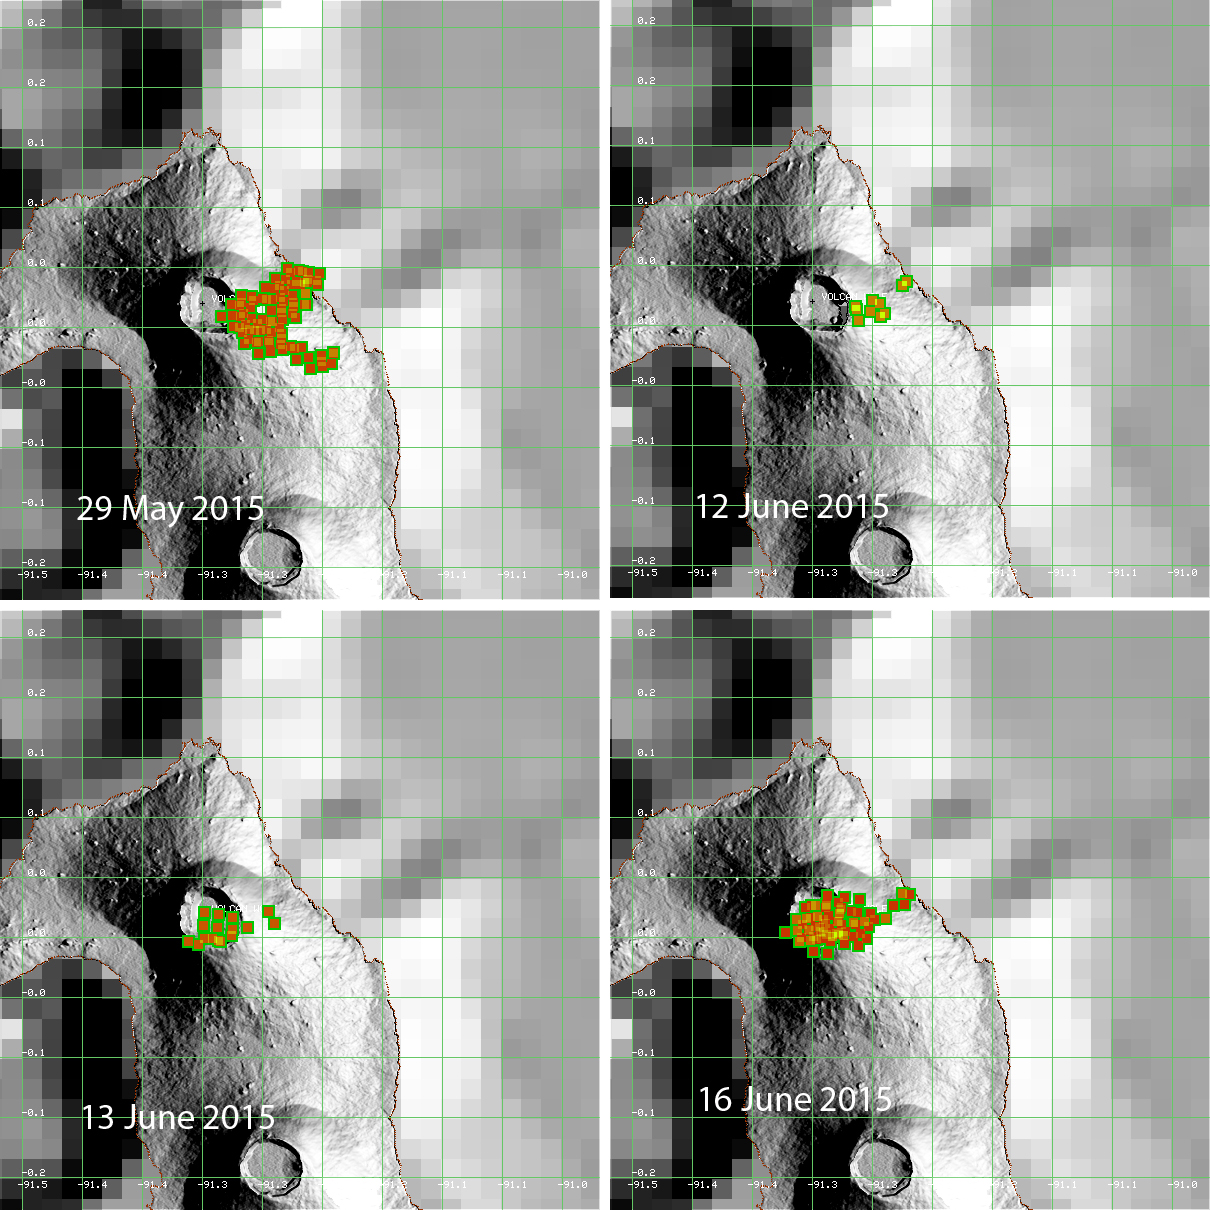 |
Figure 9. Four MODVOLC thermal anomaly maps of Wolf showing the evolution from lava flows down the E and SE flanks (29 May and 12 June 2015) to the active flows inside the crater (13 and 16 June). Green grid lines represent decimal degrees of longitude and latitude. Data courtesy of MODVOLC. |
MODIS data processed by MIROVA recorded a large thermal energy signature between 25 and 30 May, which then decreased for several days before increasing again in the second week of June (figure 10). The MIROVA radiative power data showed that the anomalies continued to decrease, suggestive of cooling lava flows, through November 2015, however, they picked up again early in 2016 (figure 11), indicating some continuing source of heat from the volcano.
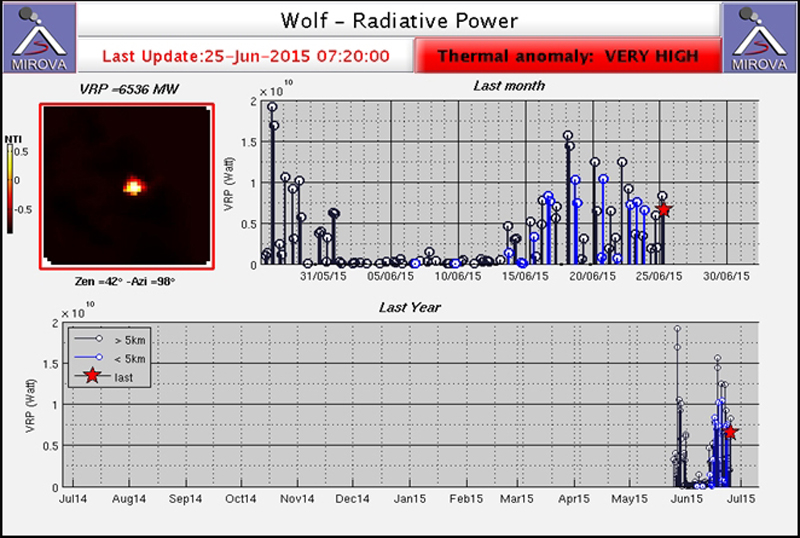 |
Figure 10. Radiant energy of thermal anomalies at Wolf detected by MIROVA from 25 May through 25 June 2015. Note the spike on 25 May followed by the decrease in values until after 15 June when they again increased (upper graph). Courtesy of MIROVA, taken from IG-EPN (Informe Volcanico Especial Galapagos No. 4, 26 June 2015). |
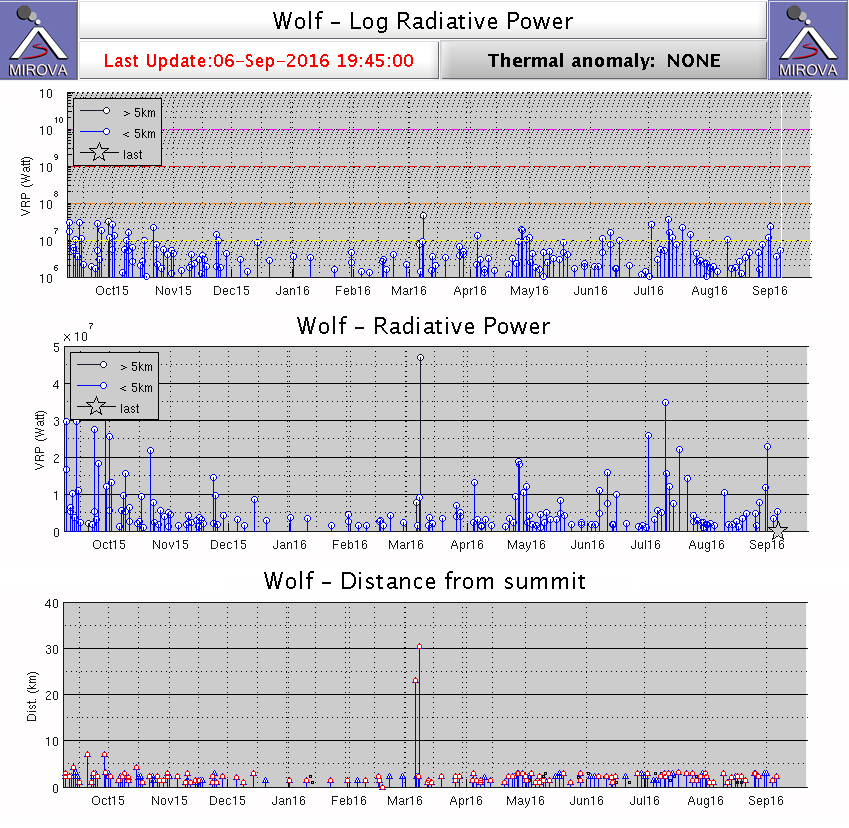 |
Figure 11. MIROVA analysis of MODIS infrared satellite data from Wolf between 6 September 2015 and 6 September 2016 showing Log Radiative Power (top), Radiative Power (middle), and Distance from summit (bottom). Virtually all of the anomalies are located within 5 km of the summit (lower graph). A gradual decrease in the anomalies between September and 1 December 2015 is consistent with cooling lava flows. Waxing and waning anomalies between March and September 2016 indicate some continued source of heat from Wolf. Courtesy of MIROVA. |
No further special reports were issued by the Instituto Geofisico after June 2015 and available evidence suggests active lava flows ceased by late July 2015.
Geological Summary. Volcán Wolf, the highest volcano of the Galápagos Islands, straddles the equator at the north end of the archipelago's largest island, Isabela. The edifice has steeper slopes than most other Isabela volcanoes, reaching angles up to 35°. The summit caldera is 6 x 7 km across and 700 m deep. A prominent bench on the west side of the caldera rises 450 m above the caldera floor, much of which is covered by a lava flow erupted in 1982. Radial fissures concentrated along diffuse rift zones extend down the N, NW, and SE flanks, and submarine vents lie beyond the N and NW fissures. Similar unvegetated flows originating from a circumferential chain of spatter and scoria cones on the eastern caldera rim drape the forested flanks to the sea. The proportion of aa lava flows exceeds that of other Galápagos volcanoes. An eruption in in 1797 was the first observed and documented in the Galápagos Islands.
Information Contacts: Instituto Geofísico, Escuela Politécnica Nacional (IG-EPN), Casilla 17-01-2759, Quito, Ecuador (URL: http://www.igepn.edu.ec/); Washington Volcanic Ash Advisory Center (VAAC), Satellite Analysis Branch (SAB), NOAA/NESDIS OSPO, NOAA Science Center Room 401, 5200 Auth Rd, Camp Springs, MD 20746, USA (URL: http://www.ospo.noaa.gov/Products/atmosphere/vaac/) [Archive at: http://www.ssd.noaa.gov/VAAC/archive.html]; Hawai'i Institute of Geophysics and Planetology (HIGP), MODVOLC Thermal Alerts System, School of Ocean and Earth Science and Technology (SOEST), Univ. of Hawai'i, 2525 Correa Road, Honolulu, HI 96822, USA (URL: http://modis.higp.hawaii.edu/, http://modis.higp.hawaii.edu/cgi-bin/modisnew.cgi); NASA Goddard Space Flight Center (NASA/GSFC), Global Sulfur Dioxide Monitoring Page, Atmospheric Chemistry and Dynamics Laboratory, Goddard, Maryland, USA (URL: https://so2.gsfc.nasa.gov/); MIROVA (Middle InfraRed Observation of Volcanic Activity), a collaborative project between the Universities of Turin and Florence (Italy) supported by the Centre for Volcanic Risk of the Italian Civil Protection Department (URL: http://www.mirovaweb.it/).