Report on Axial Seamount (Undersea Features) — March 2017
Bulletin of the Global Volcanism Network, vol. 42, no. 3 (March 2017)
Managing Editor: Edward Venzke.
Research and preparation by Robert Andrews.
Axial Seamount (Undersea Features) Research cruise and new bathymetry reveals lava flows from the 2015 eruption
Please cite this report as:
Global Volcanism Program, 2017. Report on Axial Seamount (Undersea Features) (Venzke, E., ed.). Bulletin of the Global Volcanism Network, 42:3. Smithsonian Institution. https://doi.org/10.5479/si.GVP.BGVN201703-331021
Axial Seamount
Undersea Features
45.95°N, 130°W; summit elev. -1410 m
All times are local (unless otherwise noted)
The submarine Axial Seamount volcano is located about 470 km offshore of the Oregon coast. An eruption inferred to have started at 2230 on 23 April 2015 with an earthquake swarm (BGVN 40:03) was confirmed during a 14-29 August 2015 research cruise by the R/V Thompson. According to a personal communication on 23 June 2015 from Bill Chadwick (Oregon State University and NOAA), the length of the eruption is unknown, but it was "very likely days to weeks since the deflation lasted for about 10 days and the temperature signals lasted about a month."
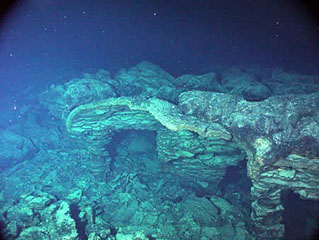
The research cruise revealed new lava flows observed from bathymetric data and observations made during a remotely operated underwater vehicle ROV Jason dive. This eruption "produced the largest volume of erupted lava since monitoring and mapping began in the mid-1980's" (Chadwick and others, 2016). Two large lava flows from the N rift zone (8-16 km N of the summit caldera) were at most 127 m thick; some of the thicker areas had drained collapse features indicating molten interiors when emplaced. The ROV traversed the flows for about 2 km. New, thinner lava flows (figure 13) were also identified in the NE summit caldera and on the NE rim.
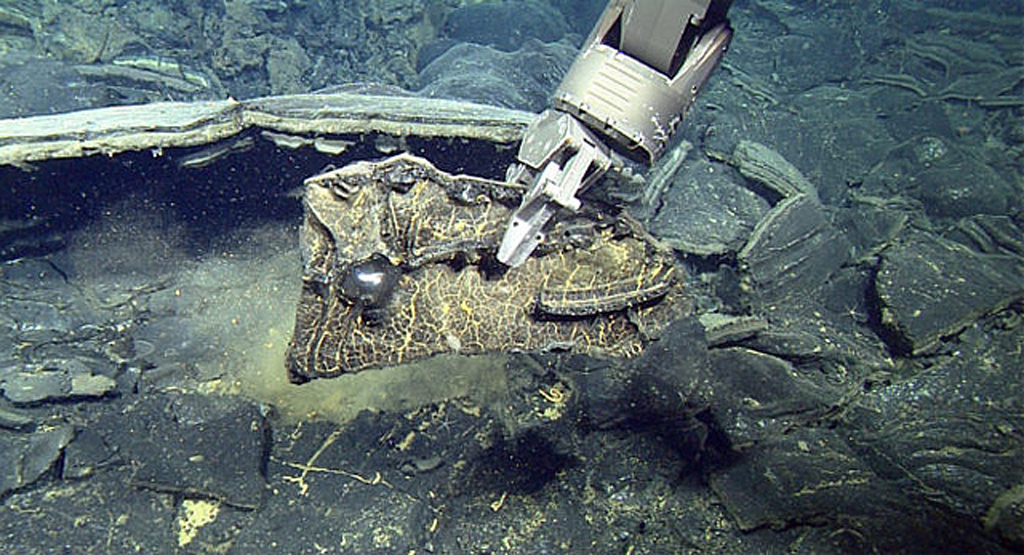 |
Figure 13. Collecting a fragment of lava from the 2015 eruption of Axial Seamount with an arm of the AUV. Credit: Monterey Bay Aquarium Research Institute (MBARI); from Phys.org (2016). |
Three recently published papers, Chadwick and others (2016), Nooner and Chadwick (2016), and Wilcock and others (2016), detail the results of eruptive activity in 1998, 2011, and 2015, based on new data from a research cruise conducted after the 2015 eruption (figures 14 and 15). Scientists from the Monterey Bay Aquarium Research Institute (MBARI) issued a new seafloor map (figure 16) of the area of Axial north of the one shown in figure 14, based on underwater surveys conducted in August 2016, uncovering a number of previously undocumented flows from the 2015 eruption (Phys.org, 2016). MBARI ran identical sets of autonomous underwater vehicles (AUV) survey lines across the entire Axial caldera in 2011, 2014, 2015, and 2016, and during the 2016 survey the AUV collected seafloor samples (figure 13).
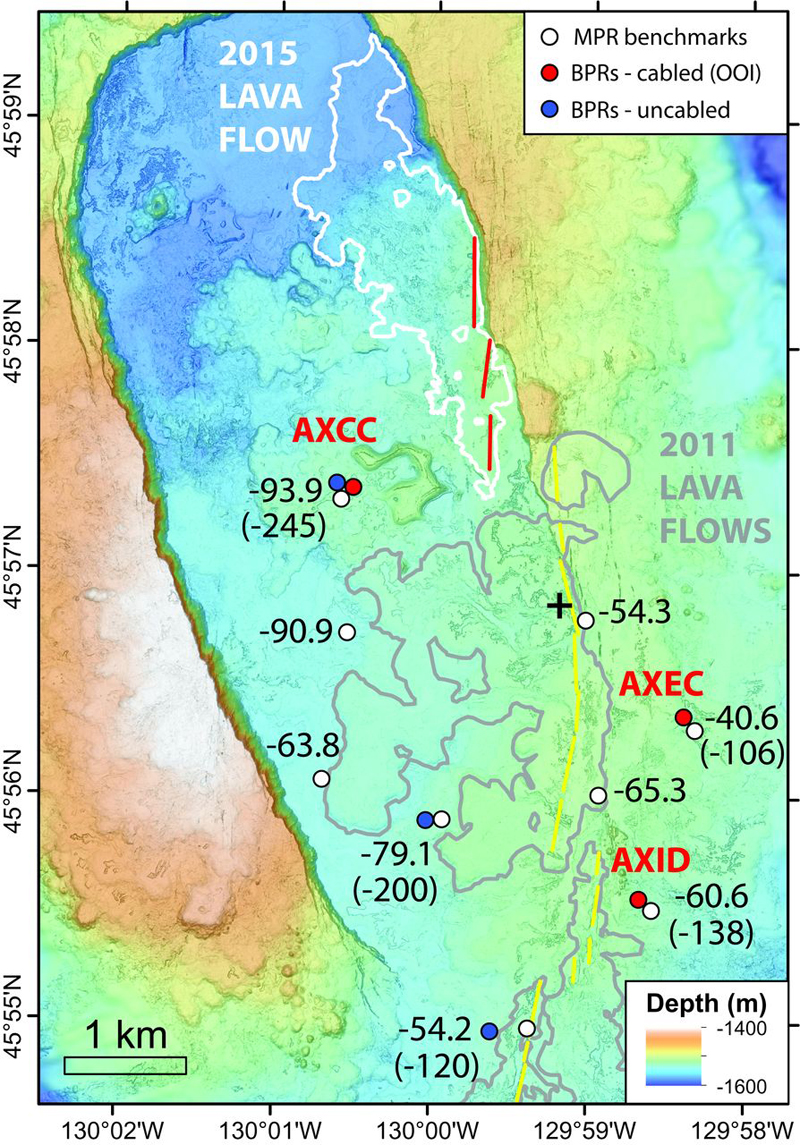 |
Figure 14. Map of the summit caldera of Axial Seamount. Locations of mobile pressure recorders (MPR) benchmarks (white circles) and bottom pressure recorders (BPR) instruments (red and blue circles) are indicated. Numbers show vertical displacements in centimeters at each of the MPR benchmarks between 14 September 2013 and 25 August 2015, a period that included pre-eruption inflation, co-eruption deflation, and post-eruption inflation. Numbers in parentheses show subsidence in centimeters during deflation only, as measured by the BPRs. BPRs on the Ocean Observatories Initiative (OOI) Cabled Array (red dots) include tiltmeters. The map also shows locations of 2015 lava flows and eruptive fissures (white outlines and red lines, respectively) and 2011 lava flows and eruptive fissures (gray outlines and yellow lines, respectively). From Nooner and Chadwick (2016). |
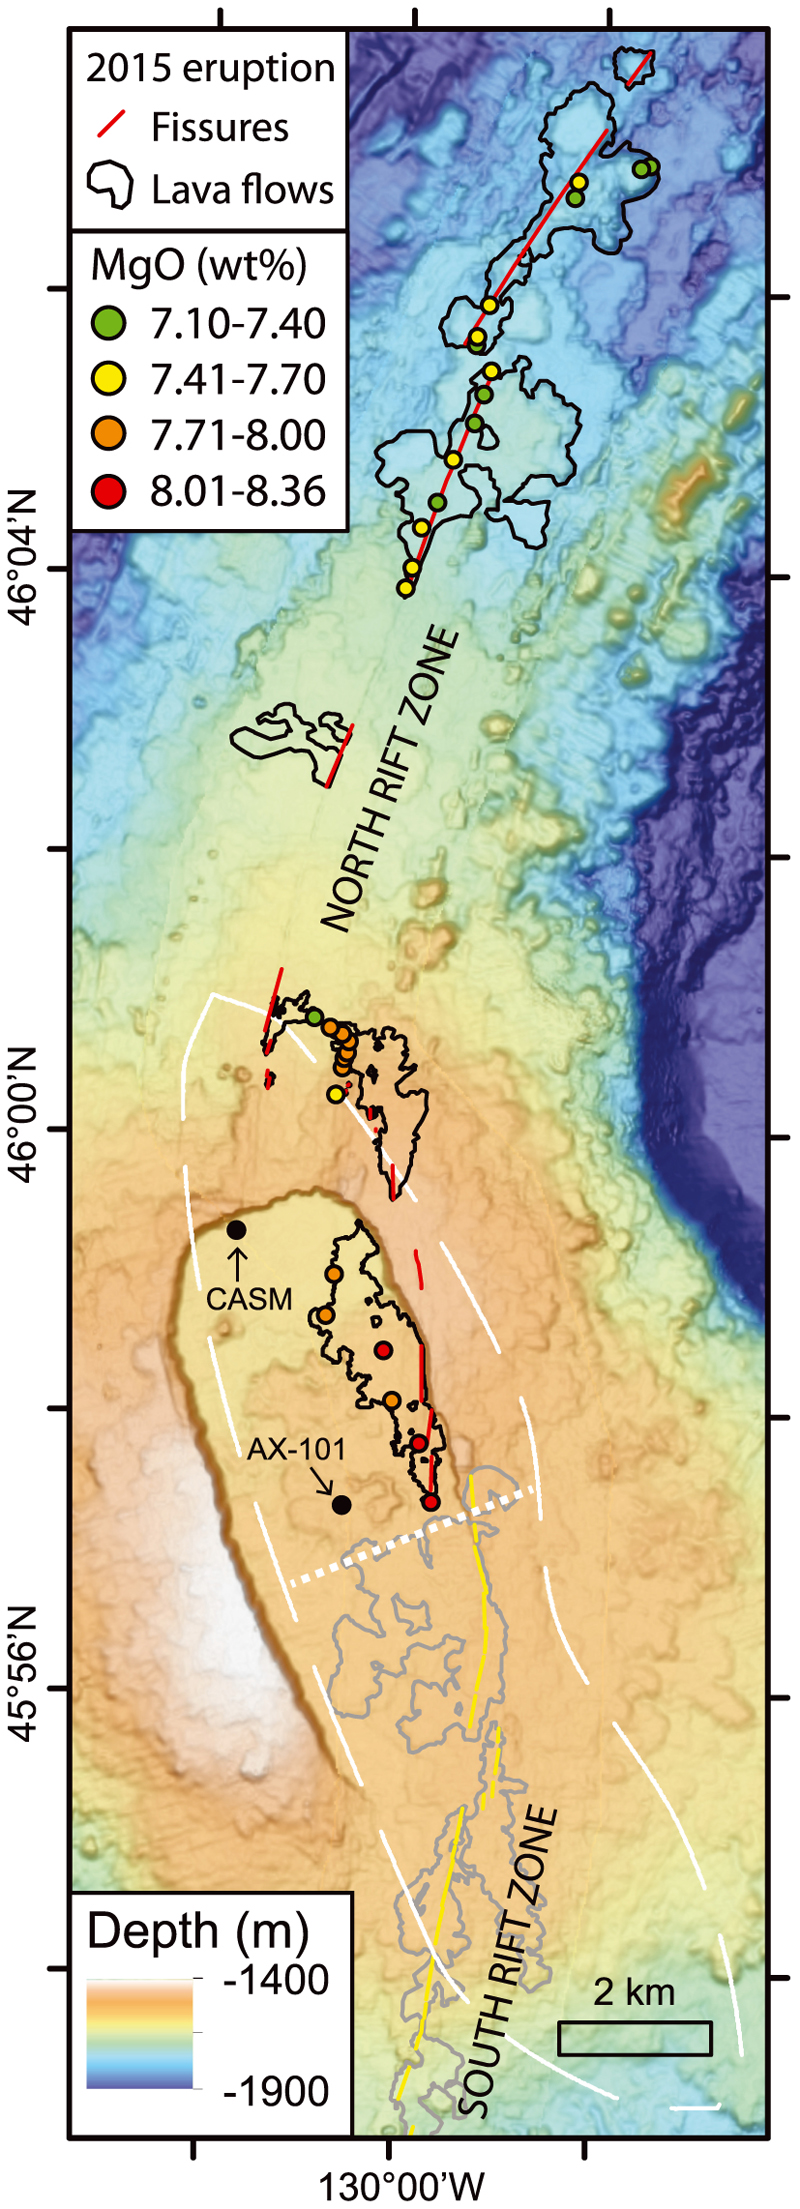 |
Figure 15. Map of 2015 lava flows (black outlines) and new fissures (red lines) in the summit caldera of Axila Seamount and on the north rift zone. Also shown are 2011 lava flows (gray outlines) and eruptive fissures (yellow lines) on the south rift zone. Lava samples collected by ROV are shown by dots, colored according to their MgO content. Dashed white outline indicates a magma reservoir from multichannel seismic results, with a dotted white line separating zones of high melt (south) from crystal mush (north). Canadian American Seamount (CASM) vent field and implanted benchmark AX-101 are labeled. From Chadwick and others (2016). |
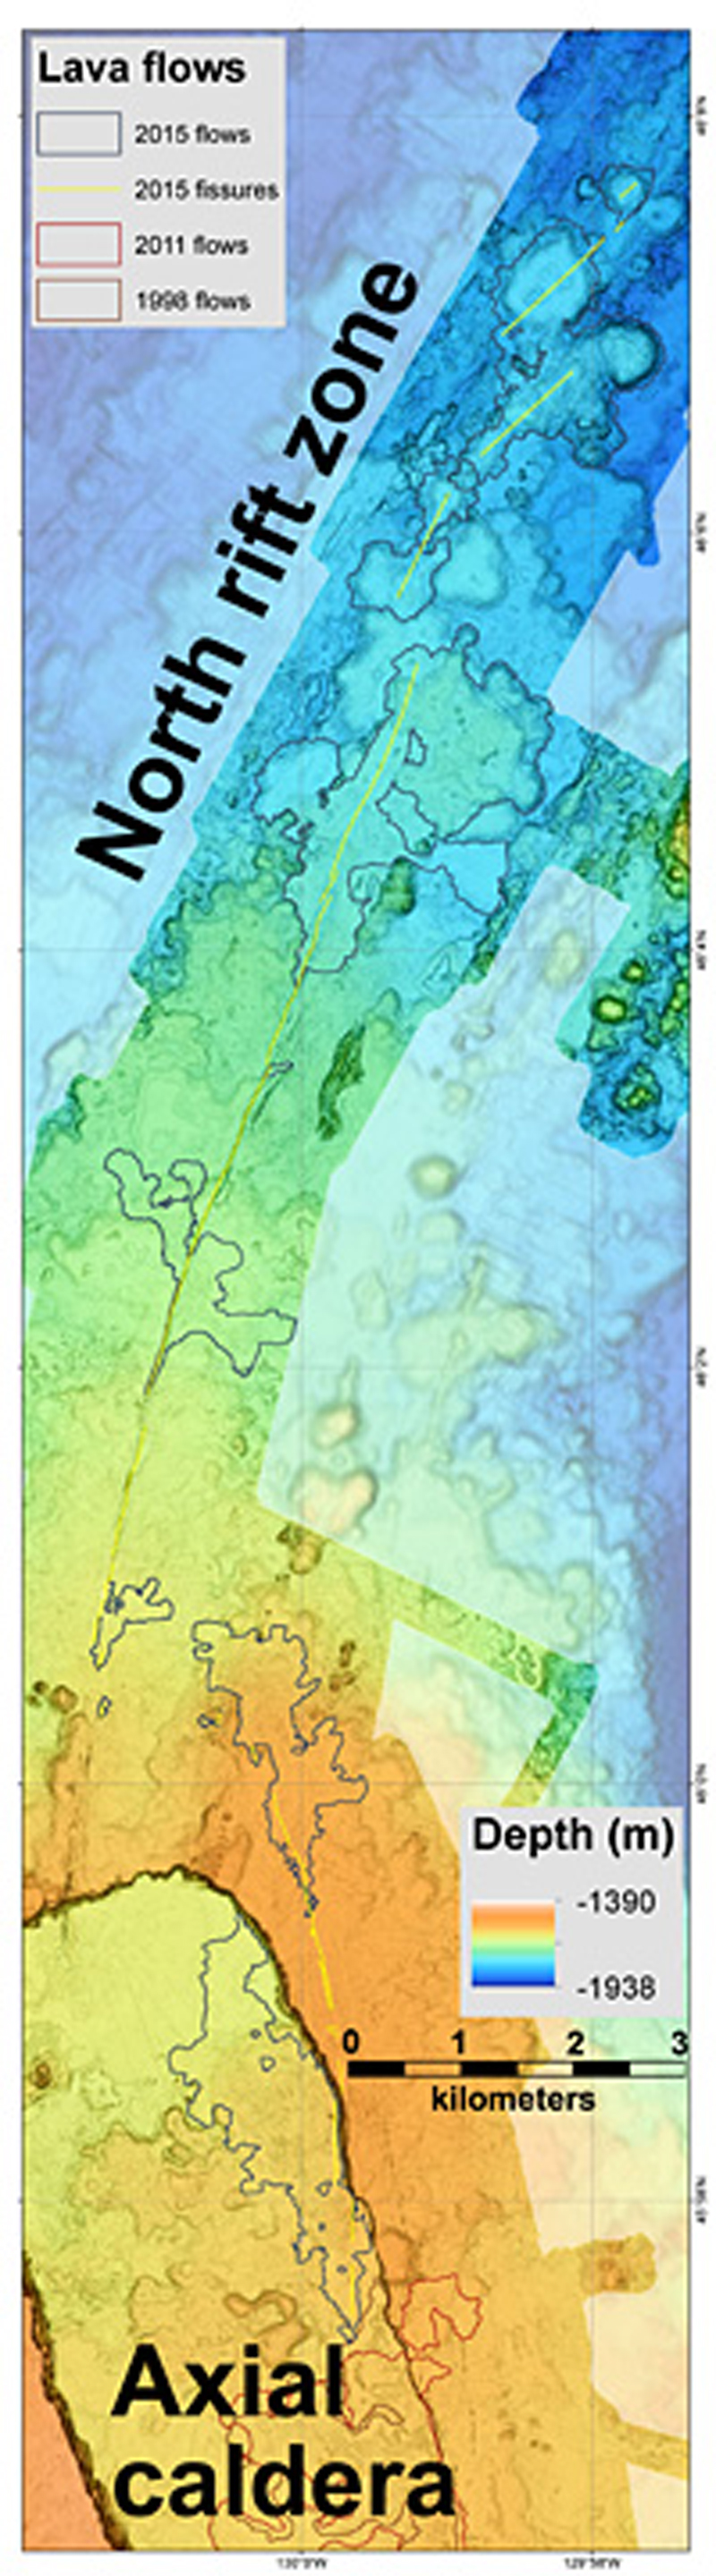 |
Figure 16. Part of the new map of Axial Seamount produced by MBARI researchers. Black outlines show lava flows from 2015 eruption. From Phys.org (2016). |
According to Wilcock and others (2016), the earthquake rates increases from less than 500 per day to as many as about 2000 per day prior to the eruption on 24 April 2015, then decreased rapidly over the next month following the seismic crisis to a background level of 20 per day. During the eruption there were 600 earthquakes measured every hour, and the seafloor at Axial dropped suddenly by about 2.4 m.
Precise pressure sensors measure vertical movements of the seafloor that take place as the volcano gradually inflates (see figure 14). Deformation of the Axial volcano seafloor as measured by pressure sensors (figure 17) indicated gradual inflation followed by rapid deflation during the three most recent eruptions in 1998, 2011, and 2015.
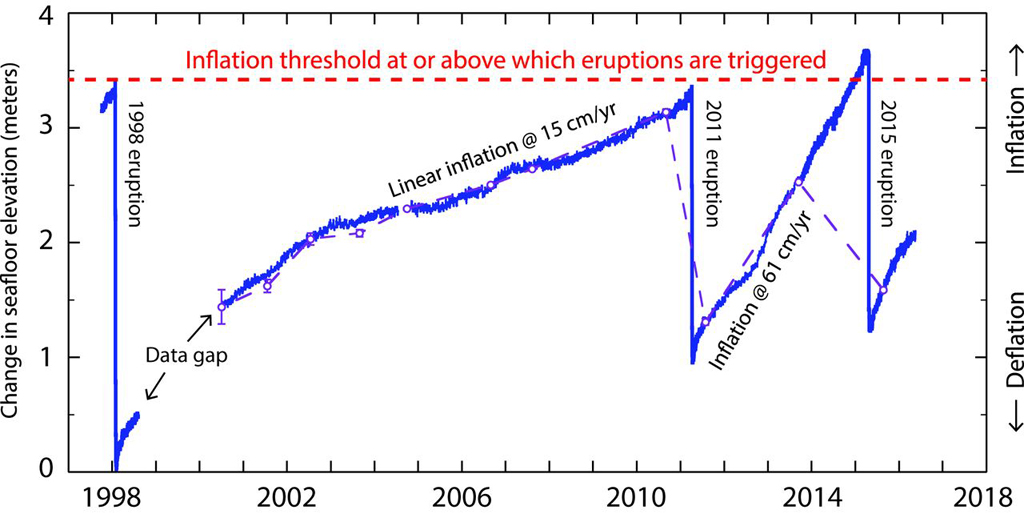 |
Figure 17. Deformation time series at the Axial Seamount caldera center, showing change in seafloor elevation as a function of time from 1998 to about May 2016. Long-term time series of inflation and deflation at the center of the caldera to 19 May 2016. Purple open dots represent mobile pressure recorder measurements (error bars indicate 1 SD); blue curves show bottom pressure recorder data (drift-corrected after 2000). The relative depth of data before and after the 1998–2000 gap in measurements is unknown. From Nooner and Chadwick (2016). |
References: Chadwick, W.W., Jr., Paduan, J.B., Clague, D.A., Dreyer, B.M., Merle, S.G., Bobbitt, A.M., Caress, D.W., Philip, B.T., Kelley, D.S., and Nooner, S.L., 2016 (15 December), Voluminous eruption from a zoned magma body after an increase in supply rate at Axial Seamount, Geophysical Research Letters, v. 43, issue 23, pp. 12,063-12,070; DOI: 10.1002/2016GL071327.
Nooner, S.L., and Chadwick, W.W., Jr., 2016 (16 December), Inflation-predictable behavior and co-eruption deformation at Axial Seamount, Science, v. 354, issue 6318, pp. 1399-1403; DOI: 10.1126/science.aah4666.
Phys.org, 2016 (15 Dec), MBARI's seafloor maps provide new information about 2015 eruption at Axial Seamount (URL: https://phys.org/news/2016-12-mbari-seafloor-eruption-axial-seamount.html).
Wilcock, W.S.D., Tolstoy, M., Waldhauser, F., Garcia, C., Tan, Y.J., Bohnenstiehl, D.R., Caplan-Auerbach, J., Dziak, R.P., Arnulf, A.F., and Mann, M.E., 2016 (16 Dec), Seismic constraints on caldera dynamics from the 2015 Axial Seamount eruption, Science, v. 354, issue 6318, pp. 1395-1399; DOI: 10.1126/science.aah5563.
Geological Summary. Axial Seamount rises 700 m above the mean level of the central Juan de Fuca Ridge crest about 480 km W of Cannon Beach, Oregon, to within about 1,400 m of the ocean surface. It is the most magmatically and seismically active site on the Juan de Fuca Ridge between the Blanco Fracture Zone and the Cobb offset. The summit is marked by an unusual rectangular-shaped caldera (3 x 8 km) that lies between two rift zones and is estimated to have formed about 31,000 years ago. The caldera is breached to the SE and is defined on three sides by boundary faults of up to 150 m relief. Hydrothermal vents with biological communities are located near the caldera fault and along the rift zones. Hydrothermal venting was discovered north of the caldera in 1983. Detailed mapping and sampling efforts have identified more than 50 lava flows emplaced since about 410 CE (Clague et al., 2013). Eruptions producing fissure-fed lava flows that buried previously installed seafloor instrumentation were detected seismically and geodetically in 1998 and 2011, and confirmed shortly after each eruption during submersible dives.
Information Contacts: William Chadwick, Cooperative Institute for Marine Resources Studies (CIMRS), Oregon State University, and NOAA/PMEL Earth-Ocean Interactions Program, Hatfield Marine Science Center, 2115 S.E. OSU Dr., Newport, OR 97365, USA (URL: http://www.pmel.noaa.gov/eoi/).