Report on Nyamulagira (DR Congo) — June 2017
Bulletin of the Global Volcanism Network, vol. 42, no. 6 (June 2017)
Managing Editor: Edward Venzke.
Edited by A. Elizabeth Crafford.
Nyamulagira (DR Congo) Large SO2 plumes and intermittent lava lake during 2013-2017
Please cite this report as:
Global Volcanism Program, 2017. Report on Nyamulagira (DR Congo) (Crafford, A.E., and Venzke, E., eds.). Bulletin of the Global Volcanism Network, 42:6. Smithsonian Institution. https://doi.org/10.5479/si.GVP.BGVN201706-223020
Nyamulagira
DR Congo
1.408°S, 29.2°E; summit elev. 3058 m
All times are local (unless otherwise noted)
The Virunga Volcanic Province (VVP) in the Democratic Republic of the Congo (DRC) is part of the western branch of the East African Rift System (EARS). Nyamuragira (or Nyamulagira), a high-potassium basaltic shield volcano on the W edge of VVP, includes a lava field that covers over 1,100 km2 and contains more than 100 flank cones in addition to a large central crater (see figure 47, BGVN 40:01). A large lava lake that had been active for many years emptied from the central crater in 1938. Numerous flank eruptions have been observed since that time, the last during November 2011-March 2012 on the NE flank. This report covers the substantial SO2 emissions from both Nyamuragira and nearby Nyiragongo (15 km SE) between November 2011 and April 2016, and the onset of eruptive activity, including a new lava lake, at the summit crater beginning in May 2014. Activity is described through April 2017.
On-the-ground information about Nyamuragira is intermittent due to the unstable political climate in the region, but some information is available from the Observatoire Volcanologique de Goma (OVG), MONUSCO (the United Nations Organization working in the area), geoscientists who study Nyamuragira, and travelers who visit the site. The most consistent data comes from satellite – thermal data from the MODIS instrument processed by the MODVOLC and MIROVA systems, SO2 data from the AURA instrument on NASA's OMI satellite, and NASA Earth Observatory images from a variety of satellites.
A substantial flank eruption took place from November 2011 through March 2012. This was followed by a period of degassing with SO2-rich plumes, but no observed thermal activity, from April 2012 through April 2014. Increased seismicity and minor thermal activity was observed at the central crater during April 2014; lava fountains first seen in early July 2014 continued through September. A lava lake in the crater was confirmed on 6 November 2014, and it produced a consistent and strengthening thermal anomaly through the first week of April 2016, when it stopped abruptly. Thermal activity suggesting reappearance of the lava lake began again in early November 2016, and strengthened in both frequency and magnitude into early January 2017, continuing with a strong signal through April 2017.
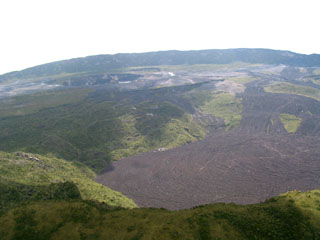
Activity during November 2011-March 2012. Nyamuragira erupted from cones and fissures on the NE flank between early November 2011 and mid-March 2012 (BGVN 39:03). The vent area, 12 km ENE of the central crater, was an E-W fissure 500-1,000 m long. Lava fountains up to 300 m high produced flows that advanced nearly 12 km N in the first 10 days. Three scoria cones formed adjacent to the fissure during the eruption, and a small lava lake appeared in the center of the largest cone. During January 2012, lava flowed from the vent area and from numerous small breakouts within 2 km of the cones (figures 51 and 52). Dario Tedesco reported that the eruptions ceased in March 2012 after a series of explosion earthquakes recorded by the OVG had ended; the last MODVOLC thermal alert in the area of the eruption was captured on 14 March 2012, and none were reported again until 2014.
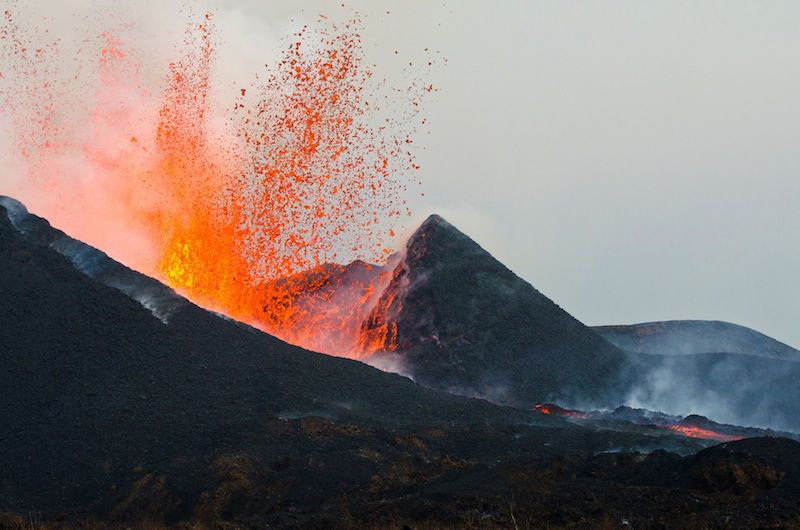 |
Figure 51. Lava fountain and active lava flow emerging from the breach of the erupting flank cone of Nyamuragira volcano on 8 January 2012. Courtesy of Volcano Discovery. |
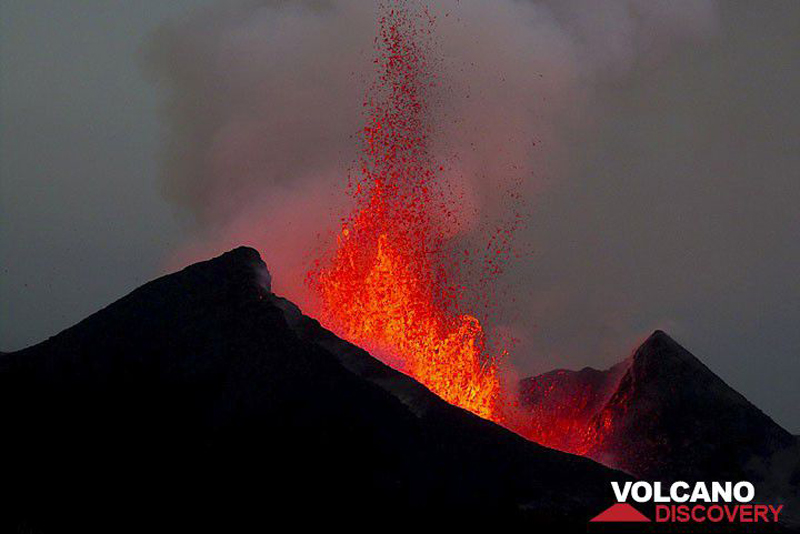 |
Figure 52. Lava fountains around 150 m high erupt on 8 January 2012 from the active flank vent during the 2011-2012 eruption of Nyamuragira. Photo by Lorraine Field, courtesy of Volcano Discovery. |
Activity during April 2012-May 2014. Periodic field surveys at Nyamuragira have been carried out since 2009 by helicopter, thanks to the support of the United Nations Organization Stabilization Mission in the DR Congo (MONUSCO). Since 2013, observations of the crater have also been done once or twice a month by helicopter. The team has included researchers from the OVG, Dario Tedesco, and other international scientists. This area is a high-risk sector due to the presence of armed groups, and it is impossible, due to the lack of security, to make detailed field surveys (Coppola et al., 2016).
Dario Tedesco reported SO2-rich fumaroles in Nyamuragira's central crater beginning in early March 2012, shortly before the NE-flank fissure eruptions ended (BGVN 40:01). A progressive collapse of the 400-m-wide, 50-80 m deep pit crater located in the NE part of the caldera began as soon as the eruptions ended. They noted that during the second half of April, large SO2 plumes continuously emerged from the pit crater.
NASA's Global Sulfur Dioxide Monitoring program captured major SO2 plumes from the area for an extended period between November 2011 and February 2014. The plumes represent combined emissions from both Nyamuragira and Nyiragongo, which are too close together to distinguish the source in the satellite data. Campion (2014), however, noted that SO2 emissions from the VVG increased several fold after the end of the 2011-2012 Nyamuragira eruption; they interpreted that 60-90 % of these emissions should be attributed to Nyamuragira.
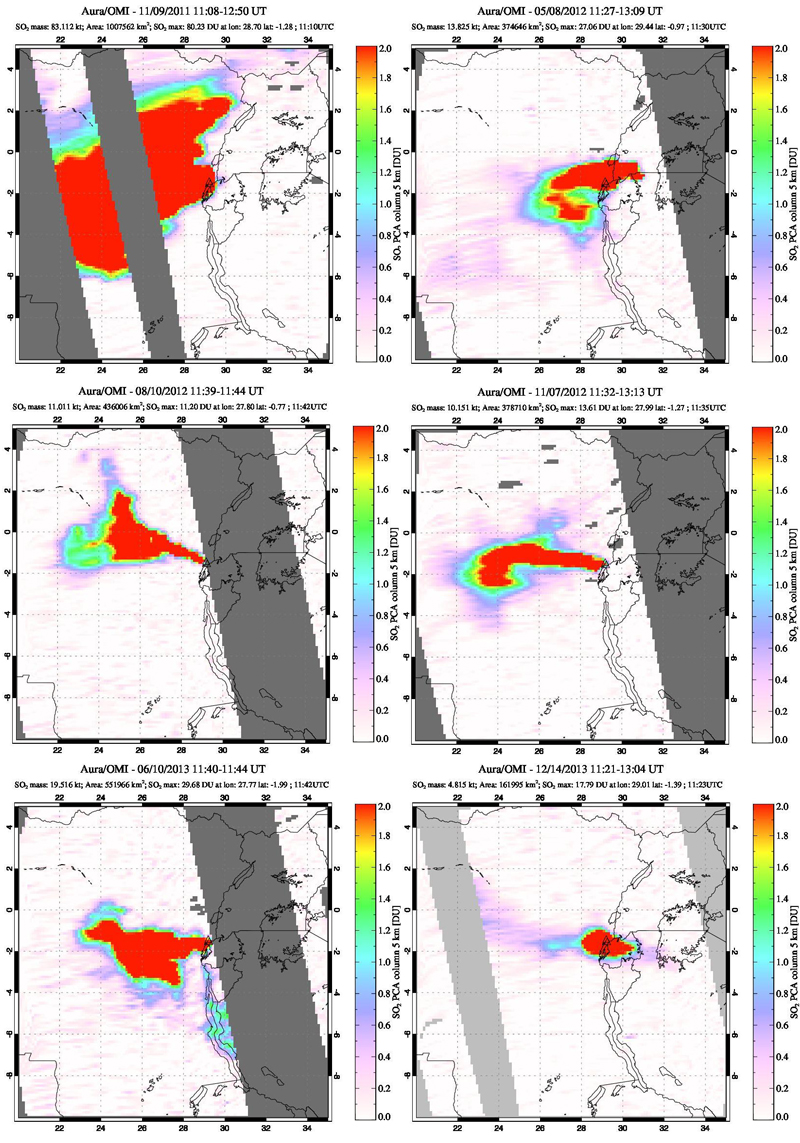
Significant areas of SO2 plumes with DU > 2 (shown as red pixels on the Aura/OMI images, figure 53) were captured by the OMI instrument at the beginning of the November 2011 eruption and continued through February 2012. Beginning in April 2012 elevated values occurred more than 20 days per month through December 2012. Values were more variable in both frequency and magnitude during 2013 with a notable surge of activity during 6-19 June 2013 that resulted in daily SO2 plumes. Details of monthly SO2 values are given in the last section of this report (see table 3).
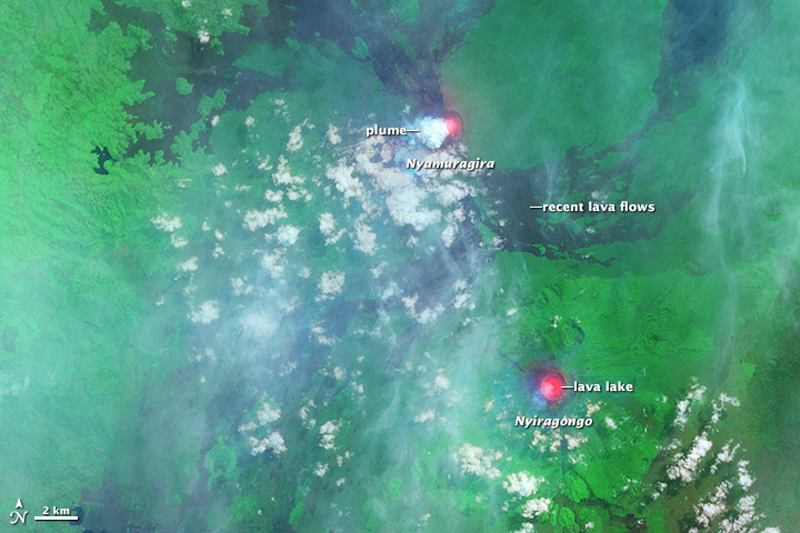
Activity during June 2014-April 2017. Incandescence at the summit and increased seismicity was reported again in April 2014, along with increasing SO2 values. A strong MODVOLC thermal alert signal appeared on 22 June 2014, and a satellite image from 30 June showed clear hotspots at both Nyamuragira and Nyiragongo (figure 54).
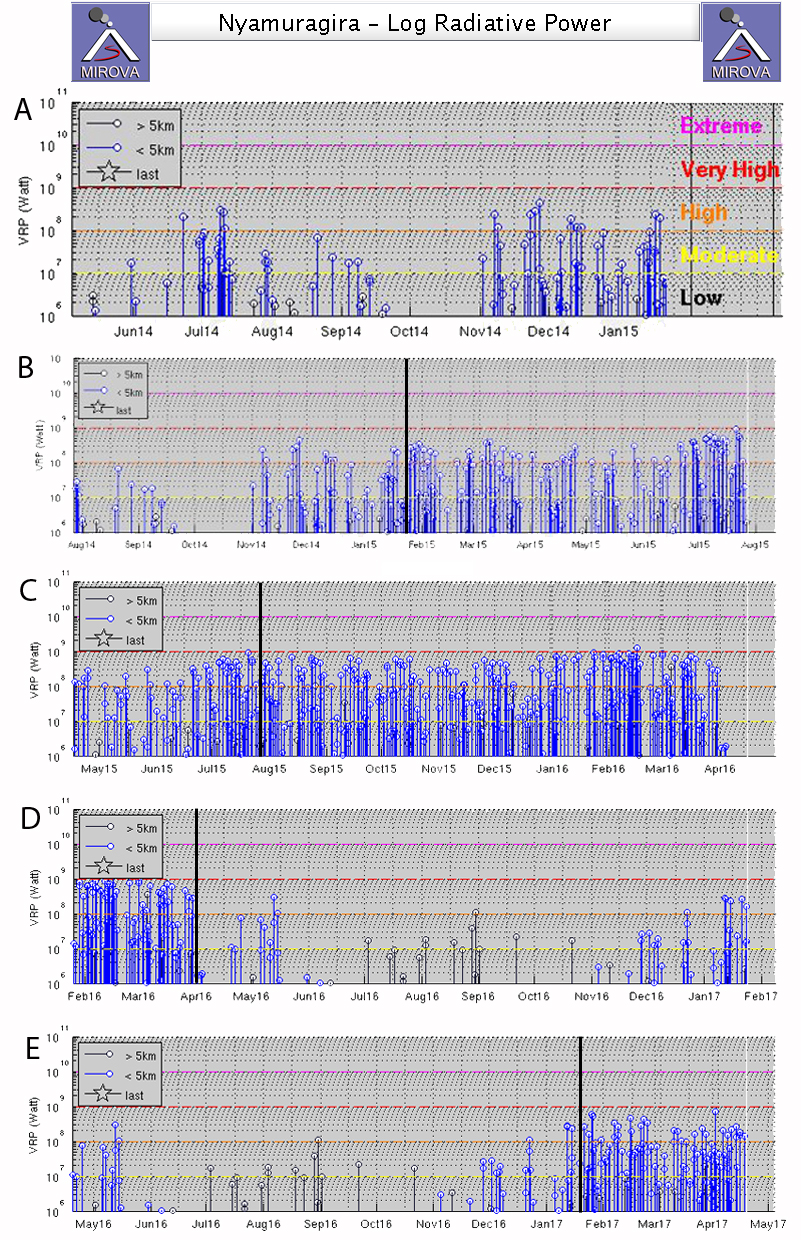
An extended series of MIROVA thermal anomaly data beginning in May 2014 clearly shows the episodic periods of active heat flow at Nyamuragira from late May 2014 through April 2017 (figure 55). During the first episode, from late May to early September 2014, lava fountains were observed in early July, and reported to be active through September (BGVN 40.01). Campion (2014) and Smets and others (2014) debated whether the lava lake first appeared in April or not until November. On 6 November 2014 a small lava lake was confirmed at the base of the summit pit when sighted during an OVG helicopter survey. Both MODVOLC and MIROVA thermal anomalies appeared again in early November and persisted through the end of the year.
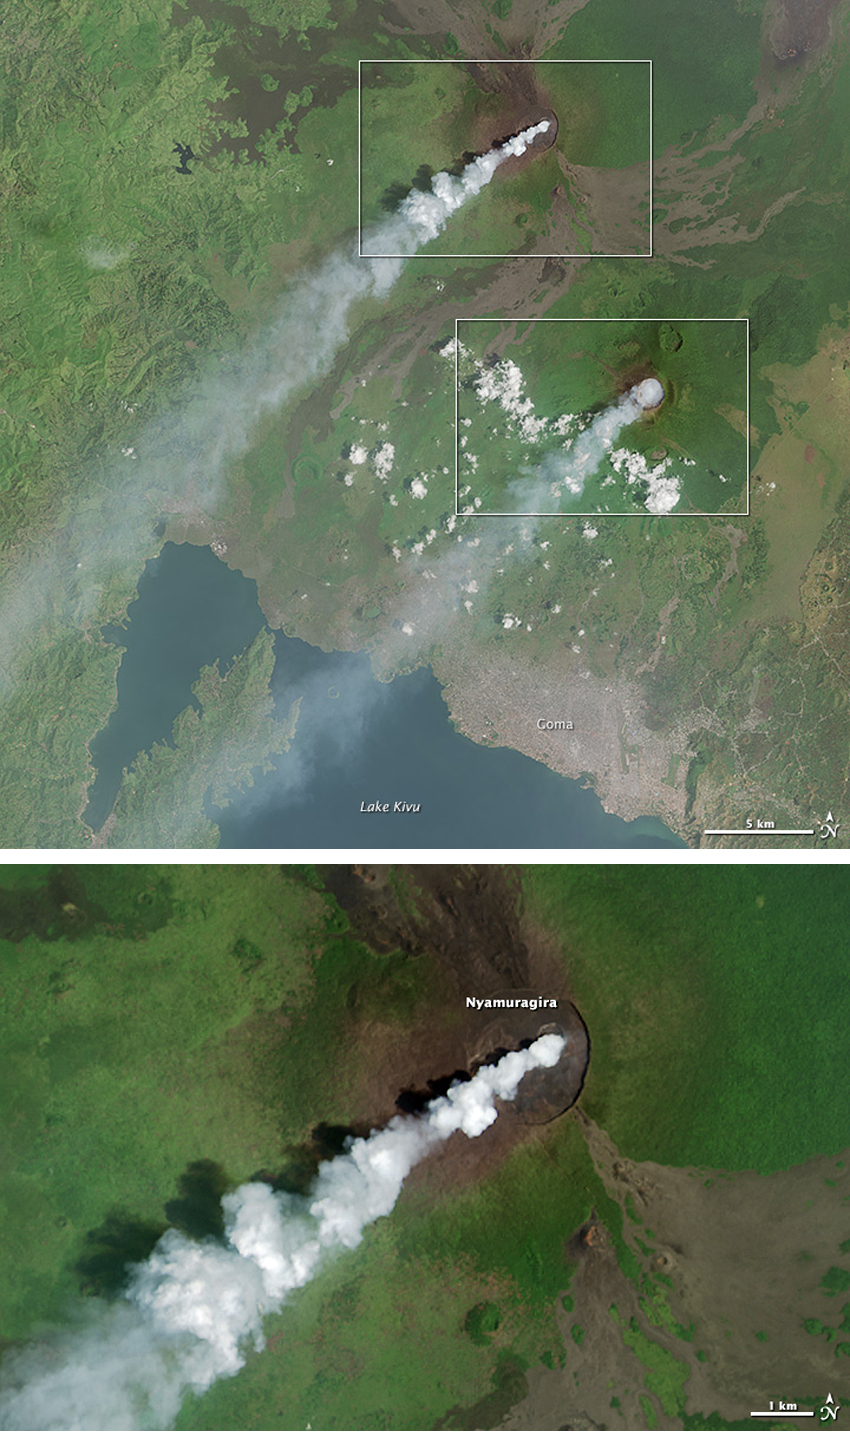
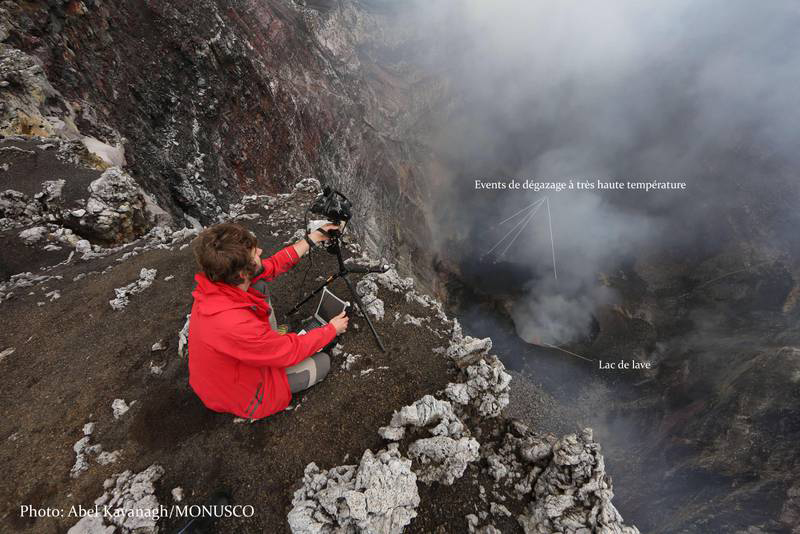
Thermal anomalies were persistent throughout 2015, with a noted increase in both frequency and magnitude during July (figure 55 C). A NASA Earth Observatory image from 9 February 2015 clearly shows active plumes venting from both Nyamuragira and Nyiragongo (figure 56). MONUSCO-supported summit crater visits by researchers on 2 April 2015, and photographer Oliver Grunwald on 10 July 2015, confirmed the presence of an active lava lake during both visits (figure 57, and video link in Information Contacts).
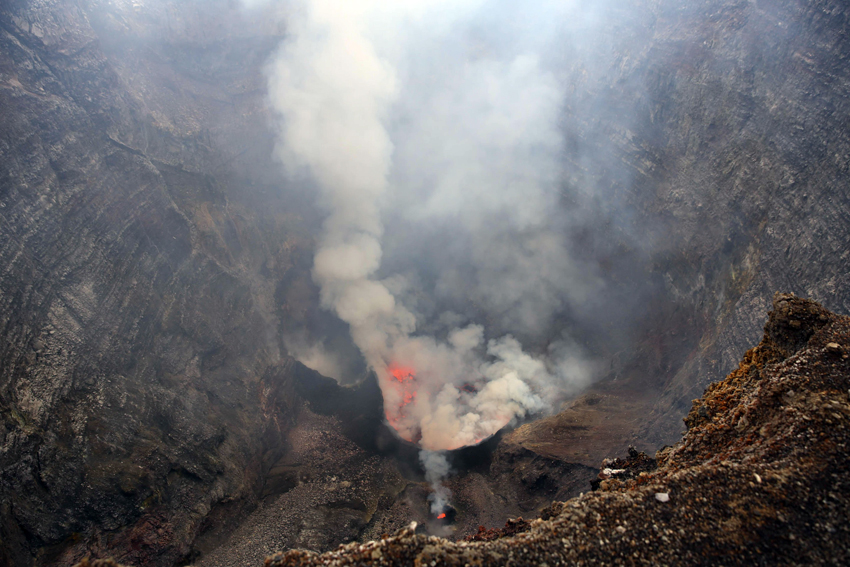 |
Figure 57. An active lava lake at Nyamuragira crater on 2 April 2015. Courtesy of MONUSCO/Abel Kavanagh. |
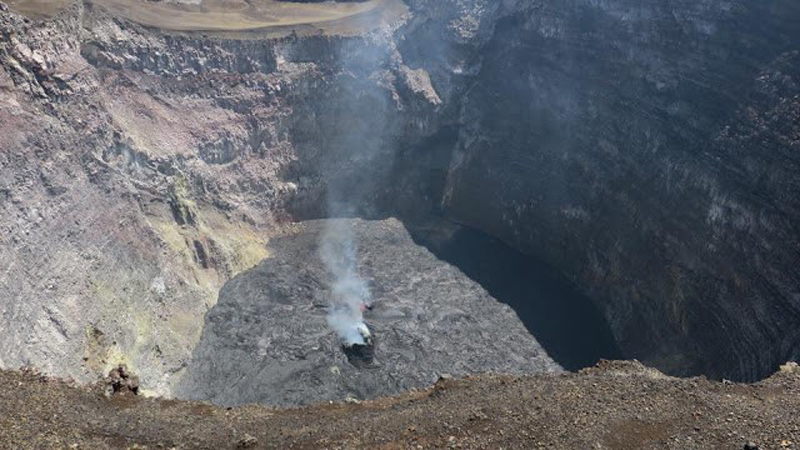
The MIROVA and MODVOLC thermal anomaly data suggest that the lava lake at Nyamuragira was active until 4 April 2016 when the signals abruptly ended (figure 55 D). This also corresponds closely in time to when the major SO2 emissions captured by NASA also ceased. Observations by Dario Tedesco at the summit on 6 April 2016, during a UNICEF and MONUSCO-sponsored helicopter overflight, showed only an incandescent vent releasing hot gases, and no active lava lake. A small lava lake was again visible in the pit crater on 27 April 2016 when observed by Sebastien Valade of the University of Florence on another MONUSCO-sponsored flight (figure 58).
Thermal anomaly data from MIROVA suggest a pulse of activity during late April through early June 2016 (figure 55 D). This was followed by a period from early June through early November 2016 with no record of activity at Nyamuragira. The MIROVA signal reappeared in early November, followed by intermittent MODVOLC thermal alerts beginning on 27 November. A new pulse of thermal activity, with values similar to those observed during July 2015-April 2016, reappeared in early January 2017 (figure 55 E) and continued through April 2017. On an OVG-sponsored visit to the summit crater on 11 March 2017, independent journalist Charly Kasereka photographed the summit crater with incandescent lava covering the crater floor (figure 59).
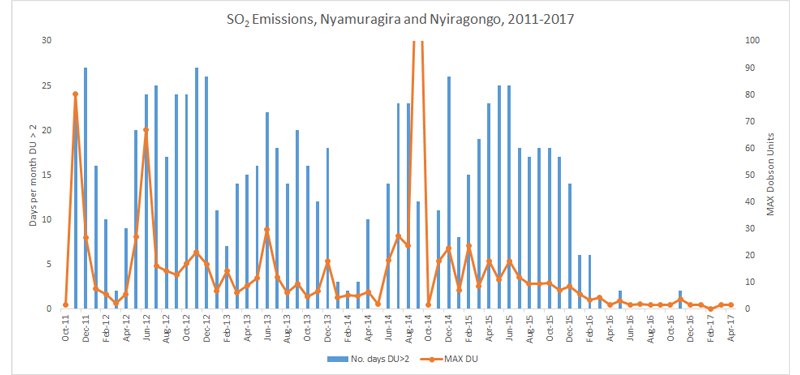
Sulfur dioxide and thermal anomaly data. Abundant sulfur dioxide emissions at Nyamuragira during November 2011-April 2017 show large variations in both magnitude and frequency during the period (table 3). A plot of the SO2 data (figure 60) reveals a sharp increase in both the number of days per month with DU greater than 2 and the actual maximum DU value during the active flank eruption between November 2011 and February 2012. After lower values during March 2012, they rise steadily and remain significantly elevated for all of 2013. Values drop briefly in early 2014 and then rise again during April 2014, remaining elevated through February 2016 before dropping off significantly.
A similar plot of the number of monthly MODVOLC thermal alert pixels for Nyamuragira from November 2011 through April 2017 (figure 61) shows that there were no thermal alerts for the period from April 2012-February 2014 when SO2 emissions were large and frequent. In contrast, there were frequent thermal alerts from June 2014-April 2016 when SO2 emissions were also high.
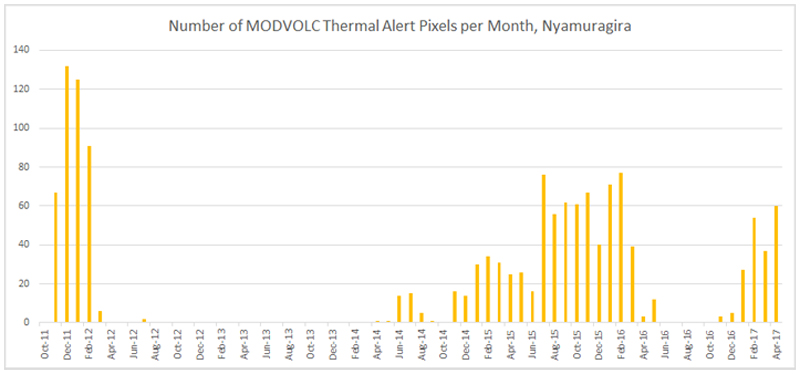 |
Figure 61. Number of MODVOLC thermal alert pixels per month at Nyamuragira from October 2011 through April 2017. Data courtesy of MODVOLC. |
Table 3. Days per month that SO2 values over the Nyamuragira and Nyiragongo area exceeded 2 Dobson Units (DU), October 2011-April 2017, and maximum DU values for each month. Data represent minimum values due to OMI row anomaly missing data (gray stripes), and missing days. SO2 is measured over the entire earth using NASA's Ozone Monitoring Instrument (OMI) on the AURA spacecraft. The gas is measured in Dobson Units (DU), the number of molecules in a square centimeter of the atmosphere. If you were to compress all of the sulfur dioxide in a column of the atmosphere into a flat layer at standard temperature and pressure (0 C and 1013.25 hPa), one Dobson Unit would be 0.01 millimeters thick and would contain 0.0285 grams of SO2 per square meter.
| MONTH | No. days DU > 2 | MAX DU (>2) | Date of Max DU | Comments |
| Oct 2011 | 0 | -- | -- | -- |
| Nov 2011 | 23 | 80.23 | 9 | -- |
| Dec 2011 | 27 | 26.70 | 30 | -- |
| Jan 2012 | 16 | 7.71 | 8 | Only 21 days of data |
| Feb 2012 | 10 | 5.32 | 18 | -- |
| Mar 2012 | 2 | 2.22 | 31 | -- |
| April 2012 | 9 | 5.31 | 27 | Daily >2 values begin ~ 20 April |
| May 2012 | 20 | 27.06 | 8 | Surge, 5-10 May |
| Jun 2012 | 24 | 67.10 | 7 | Large plumes all month |
| Jul 2012 | 25 | 15.91 | 9 | -- |
| Aug 2012 | 17 | 14.27 | 28 | -- |
| Sep 2012 | 24 | 12.78 | 11 | Several days DU>10 |
| Oct 2012 | 24 | 16.86 | 31 | Constant large plumes |
| Nov 2012 | 27 | 21.09 | 1 | Many high DU values |
| Dec 2012 | 26 | 16.69 | 16 | -- |
| Jan 2013 | 11 | 6.80 | 10 | -- |
| Feb 2013 | 7 | 14.34 | 2 | -- |
| Mar 2013 | 14 | 6.15 | 22 | -- |
| Apr 2013 | 15 | 8.93 | 16 | -- |
| May 2013 | 16 | 11.45 | 25 | -- |
| Jun 2013 | 22 | 29.68 | 10 | Big surge 6-14 |
| Jul 2013 | 18 | 11.82 | 12 | -- |
| Aug 2013 | 14 | 6.11 | 29 | -- |
| Sep 2013 | 20 | 9.46 | 25 | -- |
| Oct 2013 | 16 | 4.45 | 28 | -- |
| Nov 2013 | 12 | 6.76 | 10 | -- |
| Dec 2013 | 18 | 17.79 | 14 | -- |
| Jan 2014 | 3 | 4.13 | 27 | -- |
| Feb 2014 | 2 | 5.18 | 10 | -- |
| Mar 2014 | 3 | 4.86 | 11 | -- |
| Apr 2014 | 10 | 6.49 | 10 | -- |
| May 2014 | 0 | -- | -- | -- |
| Jun 2014 | 14 | 18.24 | 29 | Surge begins 24 June |
| Jul 2014 | 23 | 27.40 | 24 | Large plumes most of the month |
| Aug 2014 | 23 | 23.65 | 25 | -- |
| Sep 2014 | 12 | 158.92 | 10 | Big surge begins late Aug – 13 Sep, then stops abruptly. Largest plumes of interval |
| Oct 2014 | 0 | -- | -- | -- |
| Nov 2014 | 11 | 17.86 | 29 | 6-11, 23, 27-30 |
| Dec 2014 | 26 | 22.82 | 22 | 1-27 |
| Jan 2015 | 8 | 6.96 | 18 | -- |
| Feb 2015 | 15 | 23.73 | 19 | -- |
| Mar 2015 | 19 | 8.56 | 28 | -- |
| Apr 2015 | 23 | 17.80 | 29 | -- |
| May 2015 | 25 | 10.78 | 10 | -- |
| un 2015 | 25 | 17.74 | 25 | -- |
| Jul 2015 | 18 | 11.95 | 18 | -- |
| Aug 2015 | 17 | 9.32 | 19 | -- |
| Sep 2015 | 18 | 9.51 | 4 | -- |
| Oct 2015 | 18 | 9.61 | 31 | -- |
| Nov 2015 | 17 | 7.06 | 16 | -- |
| Dec 2015 | 14 | 8.42 | 13 | -- |
| Jan 2016 | 6 | 5.40 | 19 | -- |
| Feb 2016 | 6 | 3.34 | 11 | -- |
| Mar 2016 | 1 | 4.15 | 9 | -- |
| Apr 2016 | 0 | -- | -- | -- |
| May 2016 | 2 | 3.06 | 19 | -- |
| Jun 2016 | 0 | -- | -- | Only 18 days data |
| Jul 2016 | 0 | -- | -- | -- |
| Aug 2016 | 0 | -- | -- | -- |
| Sep 2016 | 0 | -- | -- | -- |
| Oct 2016 | 0 | -- | -- | -- |
| Nov 2016 | 2 | 3.50 | 27 | -- |
| Dec 2016 | 0 | -- | -- | -- |
| Jan 2017 | 0 | -- | -- | -- |
| Feb 2017 | No Data | No Data | -- | -- |
| Mar 2017 | 0 | 1.5 | -- | -- |
| Apr 2017 | 0 | 1.5 | -- | -- |
References: Campion, R., 2014, New lava lake at Nyamuragira volcano revealed by combined ASTER and OMI SO2 measurements, 7 November 2014, Geophysical Research Letters (URL: http://onlinelibrary.wiley.com/doi/10.1002/2014GL061808/full).
Coppola, D., Campion, R., Laiolo, M., Cuoco, E., Balagizi, C., Ripepe, M., Cigolini, C., Tedesco, D., 2016, Birth of a lava lake:Nyamulagira volcano 2011-2015. Bull Volcanol (2016) 78: 20. doi:10.1007/s00445-016-1014-7.
Smets, B., d'Oreye, N., Kervyn, F., 2014, Toward Another Lava Lake in the Virunga Volcanic Field?, 21 October 2014, EOS, Transactions American Geophysical Union (URL: http://onlinelibrary.wiley.com/doi/10.1002/2014EO420001/pdf).
Smets, B., d'Oreye, N., Kervyn, F., Kervyn, M., Albino, F., Arellano, S., Bagalwa, M., Balagizi, C., Carn, S.A., Darrah, T.H., Fernández, J., Galle, B., González, P.J., Head, E., Karume, K., Kavotha, D., Lukaya, F., Mashagiro, N., Mavonga, G., Norman, P., Osodundu, E., Pallero, J.L.G., Prieto, J.F., Samsonov, S., Syauswa, M., Tedesco, D., Tiampo, K., Wauthier, C., Yalire, M.M., 2014. Detailed multidisciplinary monitoring reveals pre- and co-eruptive signals at Nyamulagira volcano (North Kivu, Democratic Republic of Congo). Bull Volcanol 76 (787): 35 pp.
Smets, B., Kervyn, M., Kervyn, F., d'Oreye, N., 2015. Spatio-temporal dynamics of eruptions in a youthful extensional setting: Insights from Nyamulagira volcano (D.R. Congo), in the western branch of the East African Rift. Earth-Science Review 150, 305-328. doi:10.1016/j.earscirev.2015.08.008
Geological Summary. Africa's most active volcano, Nyamulagira (also known as Nyamuragira), is a massive high-potassium basaltic shield about 25 km N of Lake Kivu and 13 km NNW of the steep-sided Nyiragongo volcano. The summit is truncated by a small 2 x 2.3 km caldera that has walls up to about 100 m high. Documented eruptions have occurred within the summit caldera, as well as from the numerous flank fissures and cinder cones. A lava lake in the summit crater, active since at least 1921, drained in 1938, at the time of a major flank eruption. Recent lava flows extend down the flanks more than 30 km from the summit as far as Lake Kivu; extensive lava flows from this volcano have covered 1,500 km2 of the western branch of the East African Rift.
Information Contacts: Observatoire Volcanologique de Goma (OVG), Departement de Geophysique, Centre de Recherche en Sciences Naturelles, Lwiro, D.S. Bukavu, DR Congo; NASA Goddard Space Flight Center (NASA/GSFC), Global Sulfur Dioxide Monitoring Page, Atmospheric Chemistry and Dynamics Laboratory, 8800 Greenbelt Road, Goddard, Maryland, USA (URL: https://so2.gsfc.nasa.gov/); NASA Earth Observatory, EOS Project Science Office, NASA Goddard Space Flight Center, Goddard, Maryland, USA (URL: http://earthobservatory.nasa.gov/); Hawai'i Institute of Geophysics and Planetology (HIGP), MODVOLC Thermal Alerts System, School of Ocean and Earth Science and Technology (SOEST), Univ. of Hawai'i, 2525 Correa Road, Honolulu, HI 96822, USA (URL: http://modis.higp.hawaii.edu/); MIROVA (Middle InfraRed Observation of Volcanic Activity), a collaborative project between the Universities of Turin and Florence (Italy) supported by the Centre for Volcanic Risk of the Italian Civil Protection Department (URL: http://www.mirovaweb.it/); Tom Pfeiffer, Volcano Discovery (URL: http://www.volcanodiscovery.com/); Erik Klemetti, Eruptions Blog, Wired (URL: https://www.wired.com/author/erikvolc/); Cultur Volcan, Journal d'un volcanophile (URL: https://laculturevolcan.blogspot.com/); MONUSCO, United Nations Organization Stabilization Mission in the DR Congo (URL: https://monusco.unmissions.org/en/); Oliver Grunewald, Video filmed on 10 July 2015 (URL: https://laculturevolcan.blogspot.fr/2015/07/le-lac-de-lave-du-volcan-nyamuragira.html).

