Report on Kilauea (United States) — August 2017
Bulletin of the Global Volcanism Network, vol. 42, no. 8 (August 2017)
Managing Editor: Edward Venzke.
Edited by A. Elizabeth Crafford.
Kilauea (United States) New flow from Pu'u 'O'o reaches the sea on 26 July; Kamokuna delta collapses on 31 December 2016
Please cite this report as:
Global Volcanism Program, 2017. Report on Kilauea (United States) (Crafford, A.E., and Venzke, E., eds.). Bulletin of the Global Volcanism Network, 42:8. Smithsonian Institution. https://doi.org/10.5479/si.GVP.BGVN201708-332010
Kilauea
United States
19.421°N, 155.287°W; summit elev. 1222 m
All times are local (unless otherwise noted)
Hawaii's Kīlauea volcano continues the long-term eruptive activity that began in 1983 with lava flows from the East Rift Zone (ERZ) and a convecting lava lake inside Halema'uma'u crater. The US Geological Survey's (USGS) Hawaiian Volcano Observatory (HVO) has been monitoring and researching the volcano for over a century since its founding in 1912. HVO provided quarterly reports of activity for July-December 2016, which are summarized below.
Summary of July-December 2016 activity. Activity at Kīlauea during the second half of 2016 was consistent with long-term trends of summit inflation punctuated by DI (Deflation-Inflation) events and a slowly rising average lava lake level inside Halema?uma?u crater. Two explosive events prompted by rockfalls into the lake sent spatter high enough to reach the Halema?uma?u rim; a small overflow at the crater occurred in October, the first since April-May 2015.
Pu'u 'O'o activity continued with little change except for the steady advance of the episode 61g lava flow towards the coast. The pahoehoe front reached the Emergency Access Road near the coast on 25 July and cascaded slowly over the seacliff into the ocean on 26 July just after midnight. It was the first time since August 2013 that lava from Pu'u 'O'o entered the sea. A growing lava delta of about 10 hectares (25 acres) at the Kamokuna entry was the focus of attention by visitors until most of it collapsed into the sea on 31 December 2016.
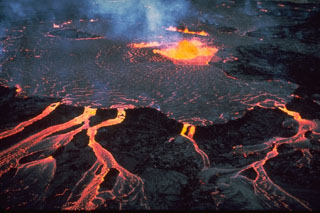
Activity at Halema'uma'u. Eruptive activity at Halema'uma'u crater was typical during July-December 2016, with a slightly elevated lake level for the last quarter of the year. The lava lake circulation pattern continued in the usual N-S direction, with occasional shifts due to short-lived spattering in areas other than the normal Southeast sink. The lake level rose and fell in concert with the regular summit DI events. On 7 September, the lake level rose to the level of the old rim prior to the April/May 2015 crater overflow, 8 m below the current rim (figure 267).
 |
Figure 267. Halema'uma'u lava lake at Kīlauea on 7 September 2016 at 1842 HST when the surface level was at the level of the old crater rim, 8 m below the current rim. Photo by M. Patrick, courtesy of Hawaiian Volcano Observatory (HVO) (Hawaiian Volcano Observatory Quarterly Report for July-September 2016). |
The lowest lake level of the period was 55 m below the floor of Halema'uma'u on 6 October; the lake reached its highest level when it overflowed the rim on 15 October. This was the highest lake level since the overflows in late April to early May 2015, and it covered a small area of about 5,000 m² of the Halema'uma'u crater floor. The latest overflows consisted of two small lobes that spilled onto the crater floor on the SE and NW sides of the lake (figure 268).
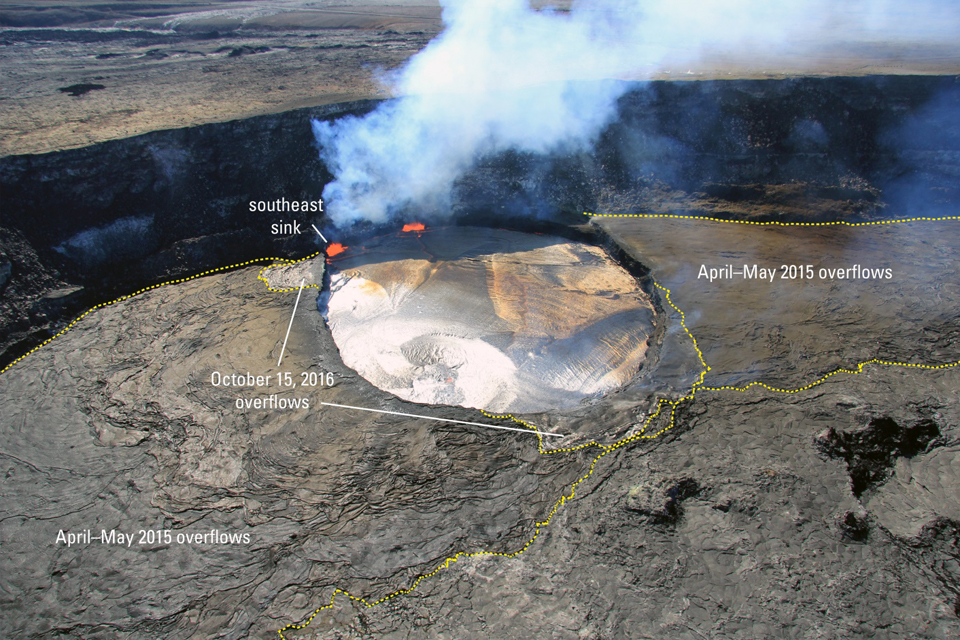 |
Figure 268. Aerial photo of Halema'uma'u crater and lava lake at Kīlauea, looking south, showing the two areas where the lake overflowed onto the crater floor on 15 October 2016. The first overflow is on the upper-left side of the lake; the later overflow at is at the lower right side. Photo by T. Orr, 3 November 2016, courtesy of HVO (Hawaiian Volcano Observatory Quarterly Report for October-December 2016). |
The lava lake surface or spatter from the lake was visible intermittently from the Jaggar Overlook on the NW rim of the caldera. During a few of the deflation phases of the DI events, newly exposed juvenile veneer on the crater walls detached and collapsed into the lake. Many of these collapses were too small to notice on the webcams or produce seismic events, but several events were noteworthy.
On 6 August there was a large collapse at the base of the Halema'uma'u crater wall (above the Southeast sink). The collapse produced a large explosive event, along with a composite seismic event, and vigorous spattering. The main explosive deposit blanketed the rim just east of the closed overlook, with tephra forming a continuous layer up to 20 cm thick. Bombs were deposited over an area 220 m wide (along the rim) and up to 90 m beyond the crater rim, with sparse lapilli thrown across the parking lot. HVO monitoring equipment and some of the remaining wooden fencing for the overlook were burned.
A second explosive event occurred on 19 September, also triggered by a collapse of the crater wall above the Southeast sink. Bombs and smaller scoria reached the Halema'uma'u crater rim and ash was deposited across the parking area and road. Large events also occurred on 4 October around 1100, and again at around noon. The first triggered a composite seismic event and spattering when veneer on the E wall fell into the lake, and the other triggered brief spattering when a large sheet of veneer fell from the SW wall. On 19 and 20 October, explosive events were triggered by rockfalls below the overlook (figure 269). The first, at 0745, deposited spatter and ribbon bombs up to 30 cm long on the rim of Halema'uma'u, and produced muted composite seismicity. The 20 October event occurred at 1225, producing a tephra deposit that extended across the road past the parking lot, and generated weak composite seismicity.
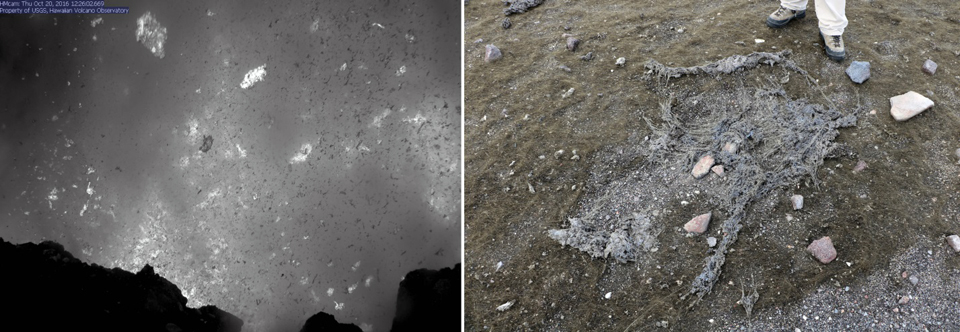 |
Figure 269. Bombs and spatter from Halema'uma'u crater at Kīlauea during October and November 2016. Left: the 20 October explosive event from the HMcam (a webcam on the SE rim of the crater) taken at 1226, showing spatter bombarding the overlook, after the collapse of the crater wall below the webcam. Right: a large bomb thrown from the lava lake during the 28 November explosive event. The fluidity of the spatter allowed it to splat upon impact. Photo by M. Patrick, 28 November 2016, courtesy of HVO (Hawaiian Volcano Observatory Quarterly Report for October-December 2016). |
At 1159 on 28 November, another slice of crater wall below the HMcam (one of two Halema'uma'u webcams) fell and triggered an explosive event that again threw tephra onto the rim. The tephra deposit was sparse and confined to a narrow area 90-100 m wide along the rim between the two webcams on the SE rim. While most of the spatter bombs were less than 30 cm in size, the largest was about 160 cm long. The clasts were relatively fluidal in texture and most splatted upon impact (figure 269). The power and Ethernet cables for one of the webcams were damaged during this event. A similar event occurred on 2 December at 0658, when a large slab from the overlook crater wall directly below one of the webcams collapsed. This also triggered a small explosive event which bombarded the rim with spatter near the two cameras, and produced rare ribbon bombs close to a meter long. Another large veneer collapse occurred on 13 December at about 1355, when a slab fell from the N wall into the lake and triggered spattering.
Activity at Pu'u 'O'o and the East Rift Zone. There were few notable changes at Pu'u 'O'o cone from July through December. Very slight uplift was observed during 2-4 July that may have corresponded to inflationary tilt. The forked lava stream in the vent on the NE spillway was visible on a 15 July overflight. Subsequent overflights found the streams progressively more crusted over, and no lava was visible in the vent on the 19 August overflight. The W pit had a large collapse of its NE rim that was noticed on 1 September. A few meters had shaved off the rim of the pit, making a pile of rubble on the pit floor.
One of the two vents on the NE spillway re-opened at some point during the day on 2 November. Fieldwork on 3 November showed that the W-pit lava pond was 52 m across and 22 m below the pit rim, at an elevation of 848 m. The pond level was at 847 m when seen again on 29 November, with weak spattering at a few places around the pond perimeter.
The new flow (episode 61g), which began from the NE flank of Pu'u 'O'o cone on 24 May 2016, had reached the top of Pulama pali (cliff) on 28 June 2016 (BGVN 41:08, figure 263). It reached the base of the pali on the last day of June, and began to advance quickly across the coastal plain (figure 270). It was initially quite narrow, about 100 m across, possibly because of the flow high advance rate and confining topography in the area, according to HVO. The flow had slowed by 5 July; it was half way across the coastal plain, with the leading tip about 1.7 km from both the base of the pali and the ocean, and 1.6 km from the closest portion of the FEMA evacuation road that runs along the coast.
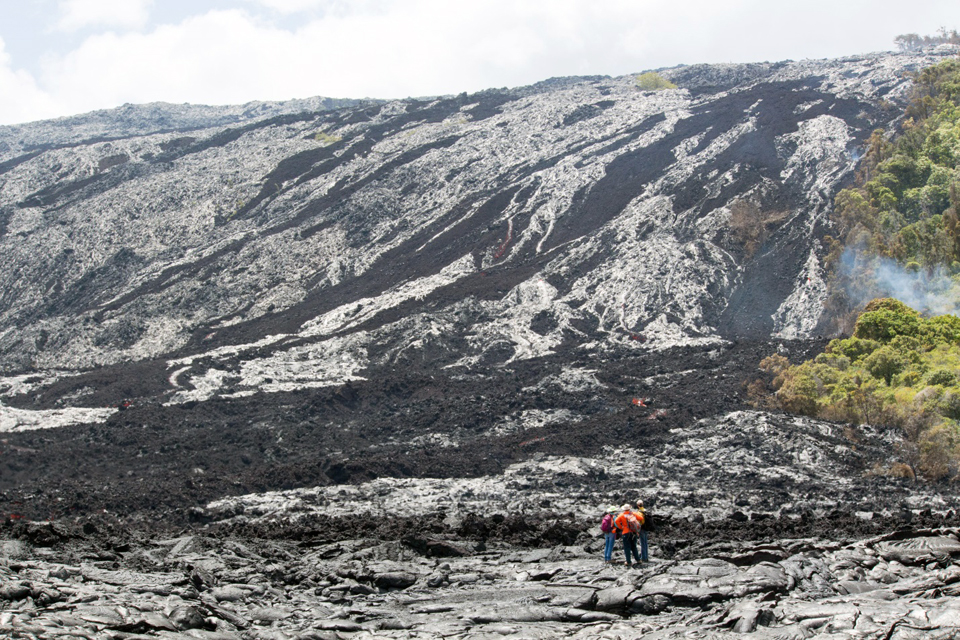 |
Figure 270. Episode 61g lava flow at Kīlauea leaves the base of Pulama pali headed across the coastal plain on 2 July 2016. Several channelized 'a'a flows are visible coming down the slope. Location is at the eastern boundary of the National Park and western boundary of the Royal Gardens subdivision. Photo by Kirsten Stephens, courtesy of Hawaiian Volcano Observatory (HVO) (Hawaiian Volcano Observatory Quarterly Report for July-September 2016). |
The flow front continued to advance slowly over the next few weeks and eventually stalled in mid-July. The stalled front was soon overtaken, however, by breakouts that had been steadily advancing downslope behind the front. These breakouts formed a new front that continued to advance rapidly at up to 170 m/day. By 24 July, the flow front had reached to within about 260 m of the FEMA emergency access road. The next day (25 July) at 1520 HST, the 61g flow crossed the FEMA road (figure 271), and at 0112 HST on 26 July lava spilled over the sea cliff and into the water, marking the start of the rapid growth of the Kamokuna ocean entry.
 |
Figure 271. Episode 61g lava flow of Kīlauea crosses the FEMA emergency access road. Left: the lava flow on 25 July 2016 at 1616 HST about 30 minutes after it crossed the road in a thin sheet, photo by L. DeSmither. Right: on 5 August (almost two weeks later), in the same general location as the first, note the amount of flow inflation (HVO geologist for scale), photo by M. Patrick. Both images courtesy of Hawaiian Volcano Observatory (HVO) (Hawaiian Volcano Observatory Quarterly Report for July-September 2016). |
The flow field continued to widen over the next few months, as scattered breakouts crept down the flow (figure 272). One of these breakouts formed a second ocean entry point several hundred meters to the W of the initial entry. Other, smaller breakouts reached the ocean along the stretch of land between the two main entry points, forming short-lived entries (figure 273). Persistent breakouts near the base of the Pulama pali began to build a ramp, making the pali less steep.
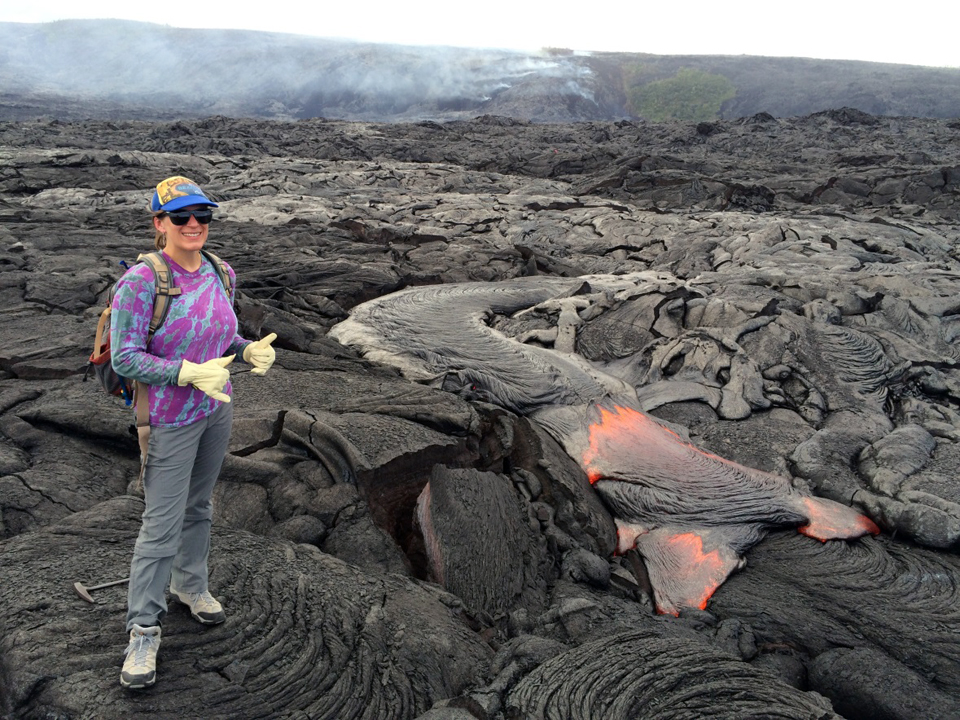 |
Figure 272. A breakout from the episode 61g flow on the coastal plain of Kīlauea on 20 September 2016. Burning vegetation on the pali from the recent flow is visible in the background. Photo by Matt Patrick, courtesy of Hawaiian Volcano Observatory (HVO) (Hawaiian Volcano Observatory Quarterly Report for July-September 2016). |
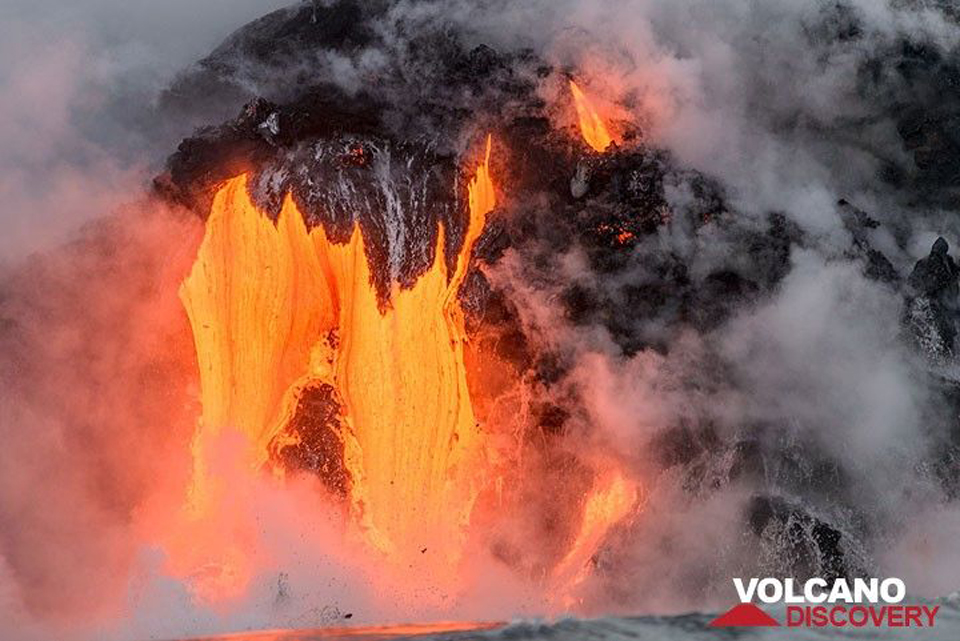 |
Figure 273. Lava flows into the sea at Kīlauea from one of the entry points along the Kamokuna ocean entry, as viewed from the sea, on 11 September 2016. Photo by Tom Pfeiffer, courtesy of Volcano Discovery. |
Numerous small delta collapses on both the E and W deltas were reported during August and September, but the deltas overall continued to grow. By the end of September the E delta was about 5.2 hectares (12.9 acres), and had developed several large coast-parallel cracks that suggested it was becoming unstable (figure 274). Activity at the W delta was always subordinate to that at the E delta and was abandoned in late September, having reached about 2.6 ha in size.
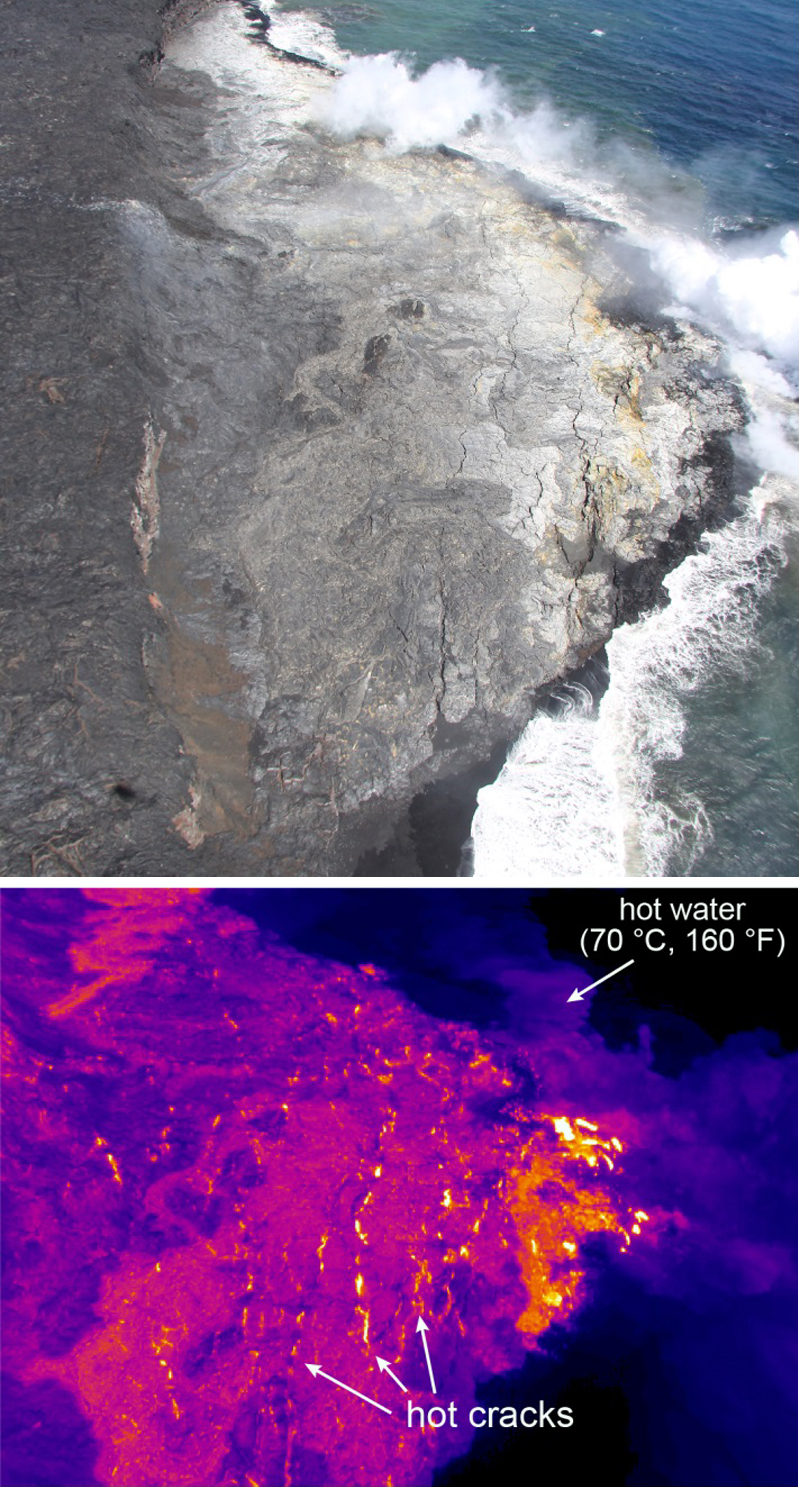 |
Figure 274. The E lava delta at the Kamokuna ocean entry at Kīlauea on 30 September 2016. Top: the E Kamokuna ocean entry and lava delta, showing large cracks parallel to the sea cliff. Photo by T. Orr. Bottom: thermal image of the delta showing heat in the cracks, and hot water plumes extending out from the ocean entry points. Courtesy of Hawaiian Volcano Observatory (HVO) (Hawaiian Volcano Observatory Quarterly Report for July-September 2016). |
The only surface activity not on the lower half of the flow field (from the top of the pali to the coast) during July-September was a large breakout from the episode 61g vent on the east flank of Pu'u 'O'o cone that started 29 August. The breakout was active for only a few days and died during the first week of September. On 27 September a skylight abruptly opened a few hundred meters inland from the ocean entry, producing a strong glow at night. Very little surface activity was present on the coastal plain near the Kamokuna ocean entry during October-December. A small breakout started about a kilometer upslope from the park rope line on 24 November, and remained active until the evening of 28 November.
However, breakouts did continue near the Pulama pali during October-December, further building up the intermediate-sloped ramp at the base of the pali (figure 275). The first of these started on 1 October and continued until at least 23 October, having extended a short distance beyond the base of the pali. A breakout started near the bottom of the steepest part of the pali during 22-23 November, producing short-lived channelized flows. The breakout remained active until at least 30 November, but was apparently inactive by 6 December.
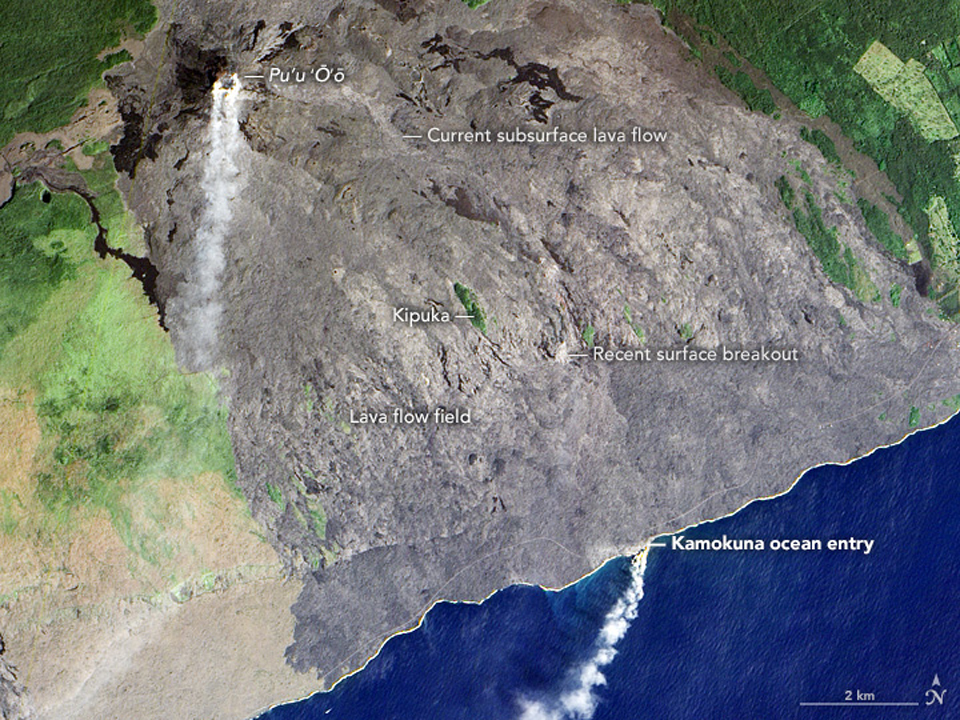 |
Figure 275. Episode 61g eruption of Kīlauea on 13 November 2016, captured by the Advanced Land Imager (ALI) on NASA's Earth Observing-1 satellite. The lava first reached the ocean on 26 July, and most of the lava delta created at the Kamokuna entry collapsed into the sea on 31 December 2016. The gray areas in the image show lava that has accumulated since 1983. The 2016 active flow started at a vent just east of the Pu'u 'O'o crater. It moved SE and S through lava tubes below the surface. The signature of a recent surface breakout is the lighter gray area at the base of the Pulama pali (cliff). Courtesy of NASA Earth Observatory. |
At the episode 61g vent near Pu'u 'O'o cone, a new breakout started between 0830 and 0840 on 21 November 2016. The ground surface over and just upslope from the vent was fractured and uplifted 3-4 m. The breakout consisted of two branches, one of which generally headed S and was short lived, stagnating during the day of 26 November. The other flowed NE and surrounded the nearby Pu?u Halulu cone before turning to the SE. The flow front of this second branch was about 2 km from the vent when mapped on 17 December (figure 276), but continued to advance through the end of the year. In addition to the 21 November breakout, other short-lived breakouts from the episode 61g vent were active during 1-3 December, 11-12 December, and 25-28 December.
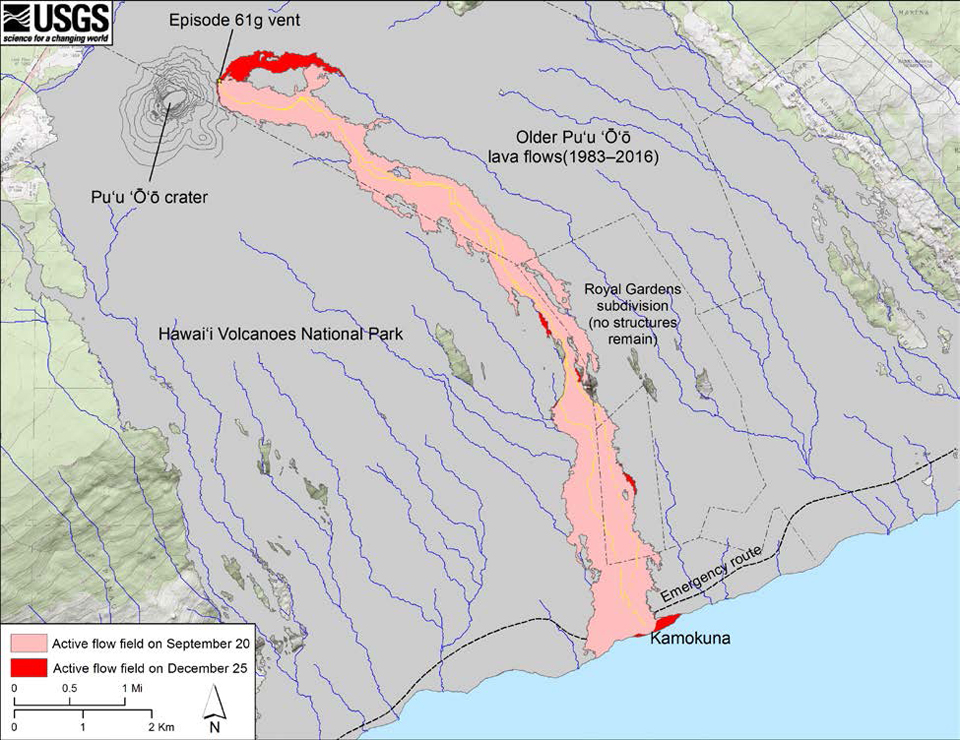 |
Figure 276. Changes to the flow field of the episode 61g flow between 20 September and 25 December 2016. Courtesy of HVO (Hawaiian Volcano Observatory Quarterly Report for October-December 2016). |
During an overflight on 3 November, HVO found that the W delta, which became inactive in late September, was approximately 2 ha after losing about 0.6 ha to wave erosion. The E delta at the Kamokuna ocean entry remained very active through December, reaching a relatively stable size of around 10 ha, kept in check by frequent small collapses. Large cracks on the delta parallel to the old sea cliff were apparent, and the delta on the seaward side of the cracks appeared to be tilted, indicating instability. The delta was about 9 ha in size in late December.
During mid-afternoon on 31 December 2016, the E delta began to collapse in pieces. Over the course of a few hours, most of the delta had disappeared into the water, leaving about 1 ha as narrow remnant ledges at the base of the sea cliff (figures 277 and 278). In addition to the delta collapse, roughly 1.6 ha of the older, post-1986 sea cliff also fell into the ocean, likely due to undercutting promoted by the delta collapse. This portion of the old sea cliff was partially above the E edge of the delta, but most of it was adjacent to the delta to the east (figure 278), and included part of the National Park viewing area. The sea cliff collapses produced thick, dusty plumes and large waves that splashed back onto the sea cliff, in some instances. In the days that followed, a few more small slices of unstable sea cliff collapsed into the water. The total area that collapsed, including the delta and the older sea cliff, was approximately 10 ha.
 |
Figure 277. Eastern Kamokuna lava delta (episode 61g flow) at Kīlauea, before and after the 31 December 2016 collapse. Left: The delta on 14 October when it was about 6 ha (15 acres) in size. Photo by L. DeSmither. Right: After the 31 December collapse, showing remnants of the delta. Photo by M. Patrick on 1 January 2017. Courtesy of HVO (Hawaiian Volcano Observatory Quarterly Report for October-December 2016). |
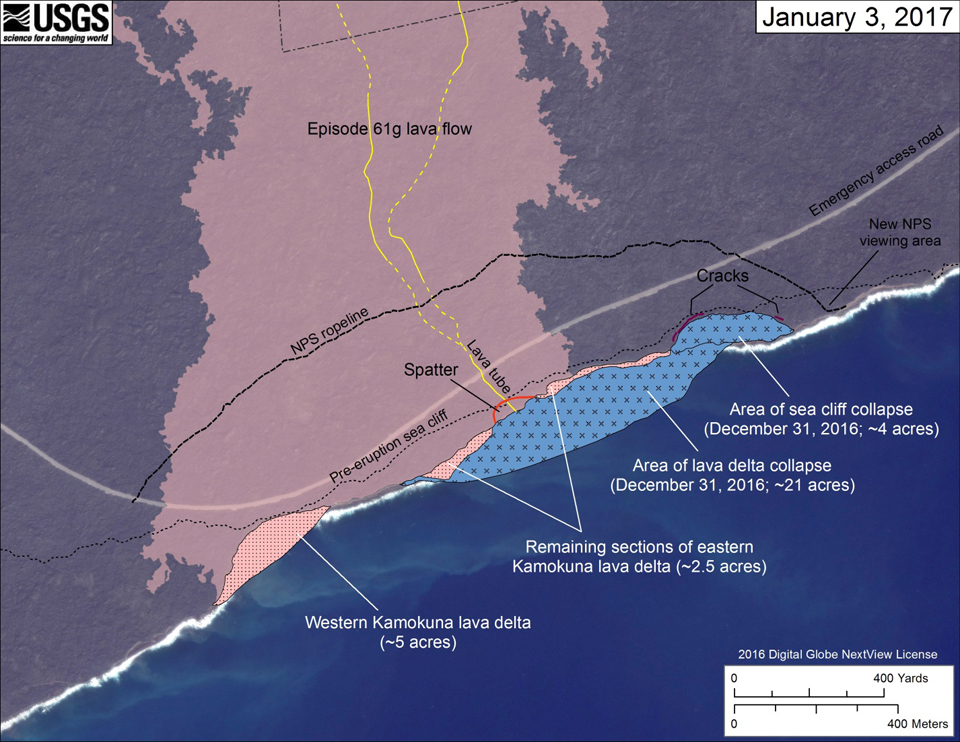 |
Figure 278. Map of the Kamokuna ocean entry at Kīlauea as of 3 January 2017, showing areas of collapse, remaining delta, and other features. Courtesy of HVO (Hawaiian Volcano Observatory Quarterly Report for October-December 2016). |
Thermal anomaly data. Satellite-based thermal anomaly data from the MODIS instrument generates a strong continuous signal from Kīlauea that closely follows the distribution of the active lava flows. As the episode 61g flow emerged from Pu'u 'O'o and headed SE, the thermal signature was strong between Pu'u 'O'o and the Pulama pali during the last week of June as recorded by the University of Hawaii's MODVOLC thermal alert system. By mid-August, a few weeks after the flow had reached the sea, the thermal activity extended from the pali to the Kamokuna ocean entry site (figure 279).
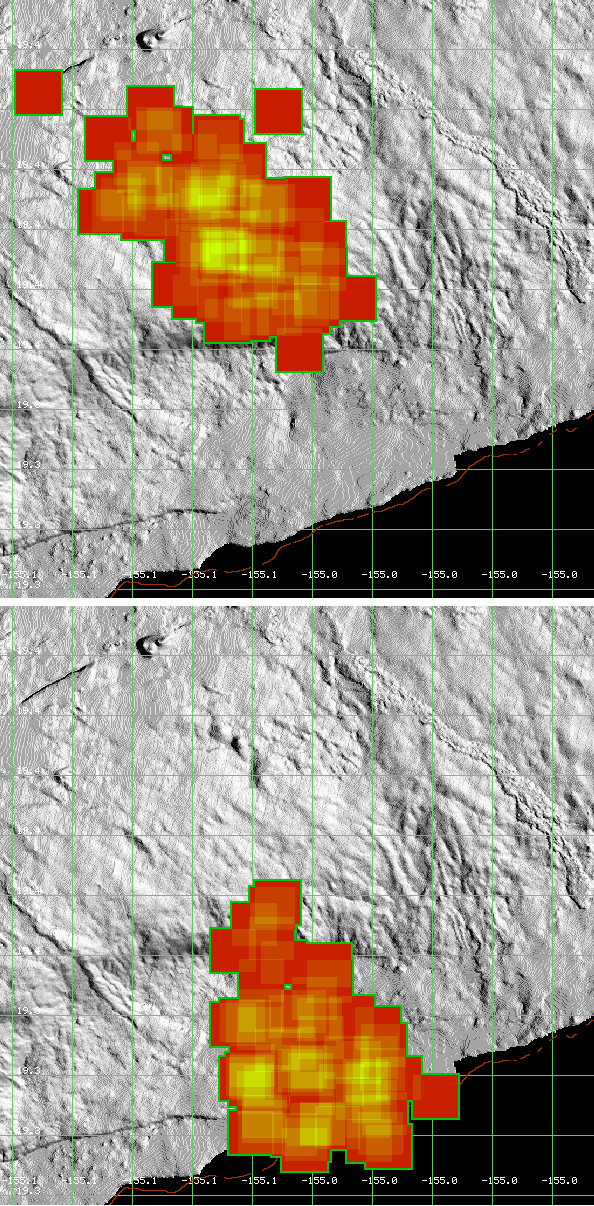 |
Figure 279. Thermal alerts from MODVOLC at Kīlauea during late June and August 2016. Pu'u 'O'o is beneath the pixel in the upper left of the top image. Top: Alerts during 26 June-1 July 2016. The Pulama pali shows as the shaded area underneath the leading SE edge of the flow. Bottom: Alerts during 12-19 August 2016. The lava was hottest between the Pulama pali on the N and the new Kamokuna ocean entry at the bottom of the image. Courtesy of HIGP MODVOLC Thermal Alerts System. |
New breakouts from the Pulama pali area were recorded as thermal alerts during the second week of November along with the evidence for continued thermal alerts from the Kamokuna delta at the shoreline. At the vent area of episode 61g, near Pu'u 'O'o cone, new breakouts flowed NE of the cone and were captured as thermal alerts during early December (figure 280).
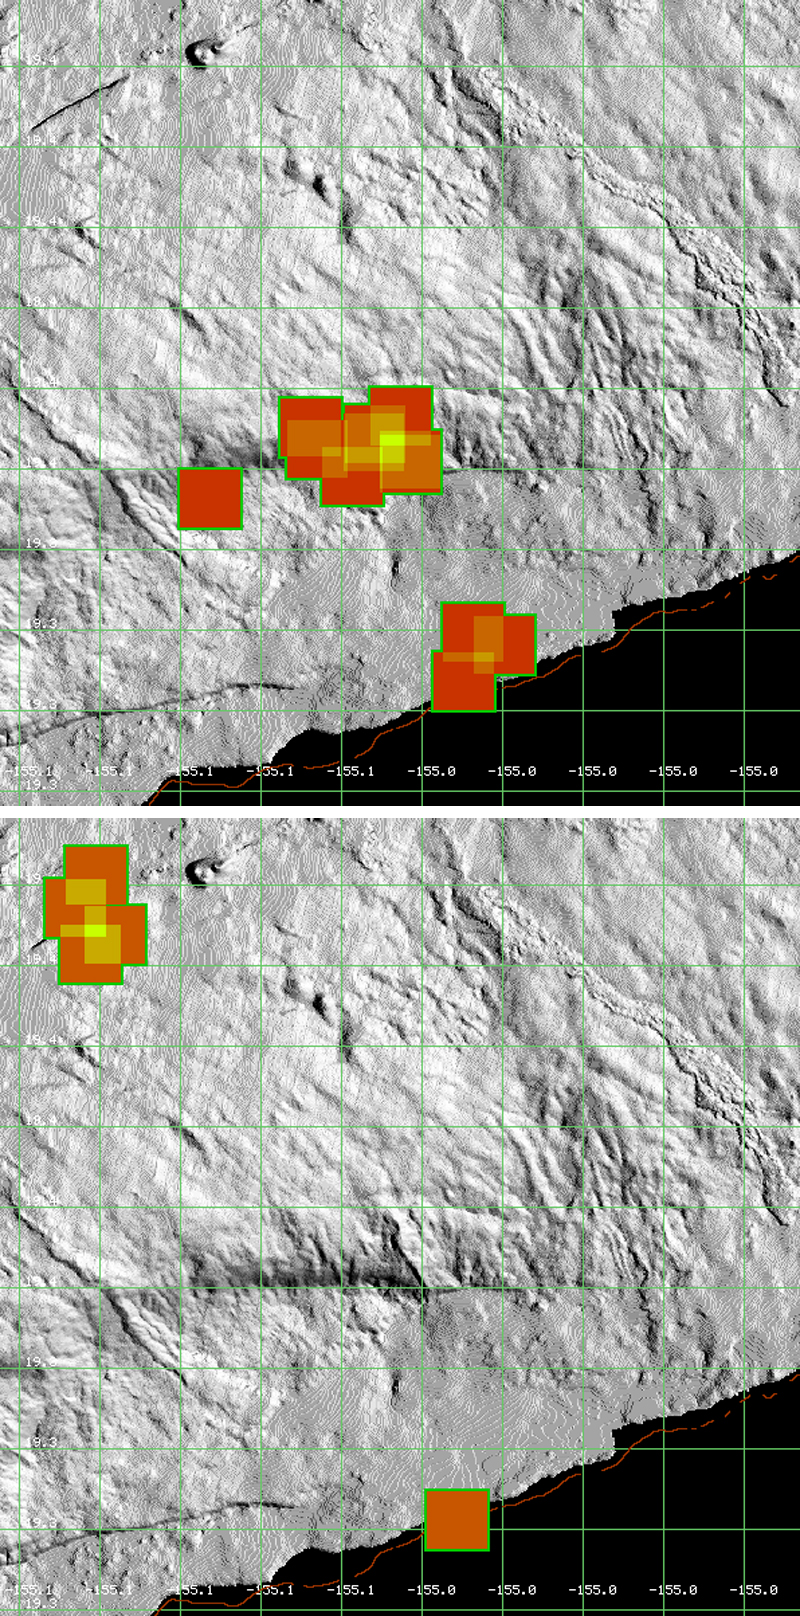 |
Figure 280. Thermal alerts from MODVOLC at Kīlauea during November and December 2016. Top: New breakouts were reported from the Pulama pali area and were visible in the thermal data during 5-11 November along with the thermal alerts from the Kamokuna lava delta at the shoreline. Bottom: Alerts during 10-16 December 2016 show renewed breakout activity at the episode 61g vent near Pu'u 'O'o (upper left of image) as well as continued activity at the Kamokuna ocean entry on the shoreline. Courtesy of HIGP MODVOLC Thermal Alerts System. |
Geological Summary. Kilauea overlaps the E flank of the massive Mauna Loa shield volcano in the island of Hawaii. Eruptions are prominent in Polynesian legends; written documentation since 1820 records frequent summit and flank lava flow eruptions interspersed with periods of long-term lava lake activity at Halemaumau crater in the summit caldera until 1924. The 3 x 5 km caldera was formed in several stages about 1,500 years ago and during the 18th century; eruptions have also originated from the lengthy East and Southwest rift zones, which extend to the ocean in both directions. About 90% of the surface of the basaltic shield volcano is formed of lava flows less than about 1,100 years old; 70% of the surface is younger than 600 years. The long-term eruption from the East rift zone between 1983 and 2018 produced lava flows covering more than 100 km2, destroyed hundreds of houses, and added new coastline.
Information Contacts: Hawaiian Volcano Observatory (HVO), U.S. Geological Survey, PO Box 51, Hawai'i National Park, HI 96718, USA (URL: https://volcanoes.usgs.gov/observatories/hvo/); NASA Earth Observatory, EOS Project Science Office, NASA Goddard Space Flight Center, Goddard, Maryland, USA (URL: http://earthobservatory.nasa.gov/); Hawai'i Institute of Geophysics and Planetology (HIGP), MODVOLC Thermal Alerts System, School of Ocean and Earth Science and Technology (SOEST), Univ. of Hawai'i, 2525 Correa Road, Honolulu, HI 96822, USA (URL: http://modis.higp.hawaii.edu/); Tom Pfeiffer, Volcano Discovery (URL: http://www.volcanodiscovery.com/).