Report on Bogoslof (United States) — September 2017
Bulletin of the Global Volcanism Network, vol. 42, no. 9 (September 2017)
Managing Editor: Edward Venzke.
Edited by A. Elizabeth Crafford.
Bogoslof (United States) Ash-bearing explosions begin in December 2016; lava dome emerges in June 2017
Please cite this report as:
Global Volcanism Program, 2017. Report on Bogoslof (United States) (Crafford, A.E., and Venzke, E., eds.). Bulletin of the Global Volcanism Network, 42:9. Smithsonian Institution. https://doi.org/10.5479/si.GVP.BGVN201709-311300
Bogoslof
United States
53.93°N, 168.03°W; summit elev. 150 m
All times are local (unless otherwise noted)
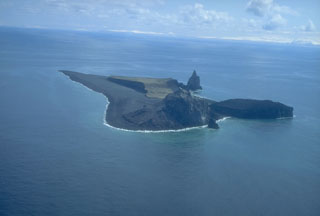
Bogoslof lies 40 km N of the main Aleutian arc, over 1,350 km SW of Anchorage, Alaska (figure 2). Its intermittent eruptive history, first recorded in the late 18th century, has created and destroyed several distinct islands that are responsible for a unique and changing landscape at the summit of this submarine volcano, and produced multiple explosive ash-bearing plumes. The last subaerial eruption, in July 1992, created a lava dome on the N side of the island, adjacent to an eroded dome created in 1927 (BGVN 17:07, figure 1). A new eruption began on 20 December 2016, and was ongoing through July 2017. Information comes from the Alaska Volcano Observatory (AVO) and the Anchorage Volcanic Ash Advisory Center (VAAC).
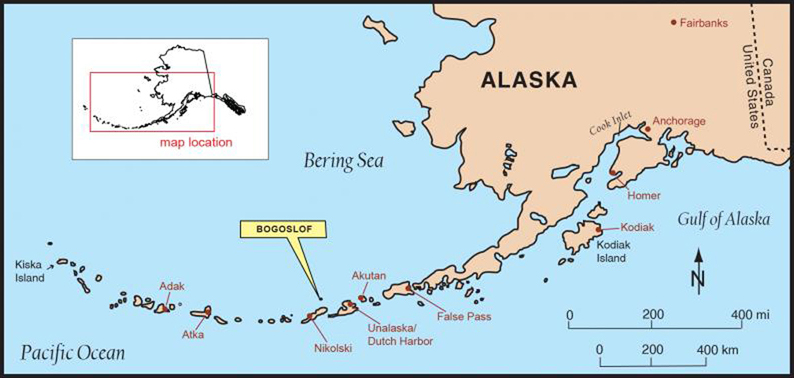 |
Figure 2. Index map showing the location of Bogoslof. Adapted from Beget et al. (2005). Courtesy of AVO. |
AVO notes that there is no ground-based monitoring equipment on Bogoslof, so monitoring is accomplished using satellite images, information from the Worldwide Lightning Location Network pertaining to volcanic-cloud lightning, and data from seismic and infrasound (airwave sensor) instruments. The infrasound instruments are located on neighboring Umnak (100 km SW) and Unalaska Islands (85 km SE) and further away at Sand Point (500 km E) on Popof Island, and on the Alaska mainland in Dillingham (825 km NE). AVO also receives reports from observers on ships and airplanes.
The first eruption at Bogoslof since 1992 began during mid-December 2016, when an ash plume was seen on 20 December. Numerous explosions were recorded via seismic, infrasound, lightning, satellite, and visual observations until 19 February 2017, and the morphology of the island changed significantly during that time. Ashfall was reported in Unalaska on 31 January. A large explosion on 7 March produced a substantial ash plume, and was followed by four days with earthquake swarms that lasted for hours. An explosion on 16 May produced an ash plume that rose to over 10 km altitude. A larger explosion on 28 May created tephra jets, pyroclastic fall and flow material around the island, and a possible 13.7-km-high ash plume. A substantial submarine sediment plume was observed in early June, followed by confirmation of a lava dome above the ocean surface during 5-6 June. A series of explosions during 10 June destroyed the lava dome. Explosions producing ash plumes that rose to altitudes above 10 km occurred on 23 June and 2 July; several additional smaller explosions were recorded through mid-July.
Activity during December 2016-February 2017. According to AVO, Bogoslof showed signs of unrest beginning on 12 December 2016 in seismic, infrasound (air-wave), and satellite data. Ash emissions may have occurred on 16 and 19 December on the basis of recorded lightning strikes, seismic data, and sulfur dioxide clouds detected by satellite instruments, though there were no direct visual observations from satellite or ground observers. On 20 December, a powerful, short-lived explosion at about 1535 AKST (0035 UTC 21 December) sent ash to over 10.3 km altitude which then drifted S (figure 3).
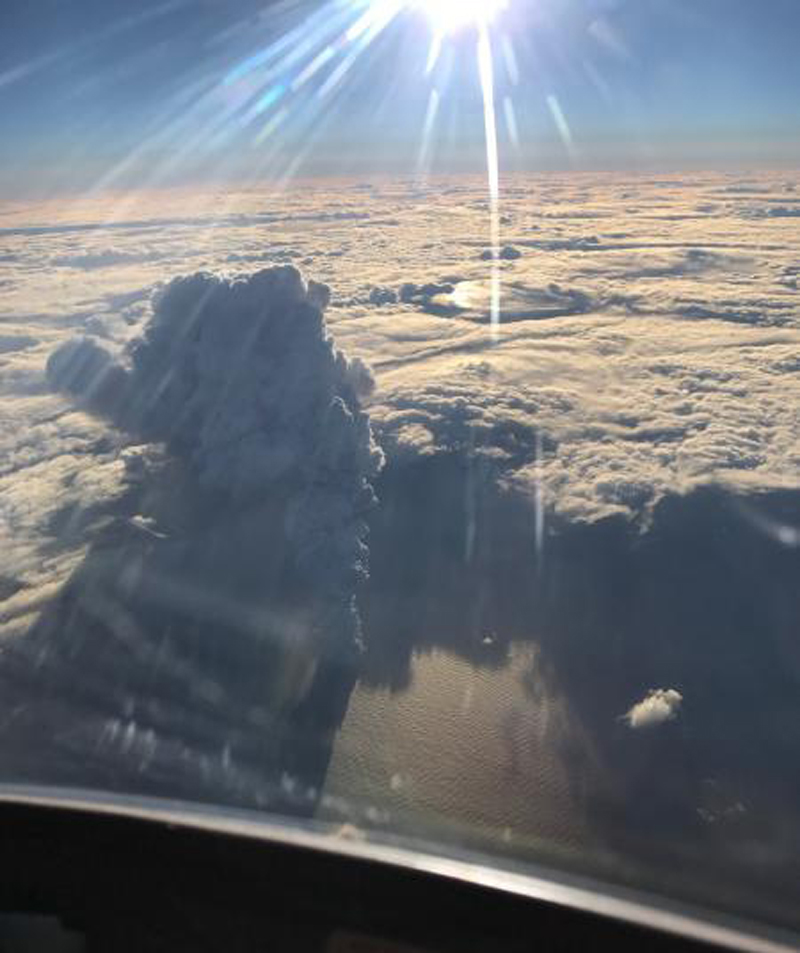 |
Figure 3. Bogoslof's eruption plume was captured on 20 December shortly after 1530 AKST from an aircraft at 36,000 feet (10.9 km). The aircraft was about 20 miles N of Bogoslof Island flying W. Photo by Paul Tuvman, courtesy of AVO. |
An explosion on 21 December at 1610 AKST was detected in satellite images and seismic data from neighboring islands. This eruption lasted about 30 minutes and sent ash as high as 10.7 km which then drifted N. Satellite images from the next day showed that a small new island had formed just offshore of the NE end of the main island. The previous shore and much of the NE side of Bogoslof Island adjacent to the new island was mostly removed and, according to AVO, was likely the site of the new, underwater vent; deposition of material was visible on the W side of the island (figure 4).
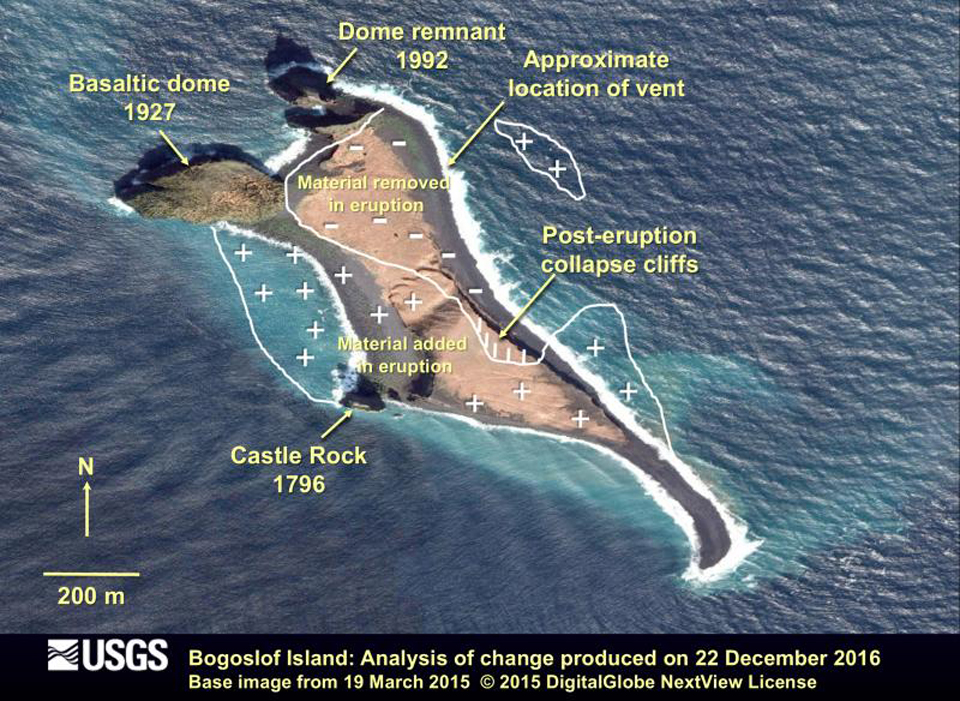 |
Figure 4. Analysis of shoreline change and vent location from the 20-21 December 2016 eruption of Bogoslof. The base image is from 19 March 2015 and the analysis was conducted using data from 22 December 2016, a day after the large explosive eruption on 21 December. Note that the location of the vent for the eruption was underwater or near the shoreline on the NE part of Bogoslof Island. Deposits have enlarged portions of the island and were interpreted by AVO to be comprised of coarse-grained volcanic ash and blocks of lava. The areas marked with "+" are material that was added during the eruption. The area marked with "-" represents material removed during the eruption. Courtesy of AVO. |
During the morning of 23 December 2016, observers aboard a Coast Guard vessel reported ash emission, lightning, and the ejection of incandescent lava and fragmental material. Ash emission and lava ejection subsided after about an hour. The ash cloud was carried N over the Bering Sea and did not penetrate above the regional cloud tops at 9.1 km altitude. Similar, repeated, short-duration explosions continued every few days through 19 February 2017 before the first break in activity (table 1).
Table 1. Observations of activity at Bogoslof, December 2016-July 2017, as reported by AVO and the Anchorage VAAC. Date is local AKST or AKDT (starting 10 June). Plume altitude in kilometers. Drift is direction and distance in kilometers.
| Date | Time (local) | Observation and notes | Plume Altitude (km) | Drift | Detection Method |
| 12 Dec 2016 | -- | "Unrest" | -- | -- | Seismic, infrasound, satellite |
| 16 Dec 2016 | -- | Possible ash emissions | -- | -- | Lightning, seismic, SO2 |
| 19 Dec 2016 | -- | Possible ash emissions | -- | -- | Lightning, seismic, SO2 |
| 20 Dec 2016 | 1530 | Explosive eruption with ash plume | 10.3 | S | Pilot, satellite |
| 21 Dec 2016 | 1610 | 30-minute-long explosion with ash plume | 10.7 | N | Satellite, seismic |
| 23 Dec 2016 | 0930 | Explosion with ash, lightning, incandescent lava, and debris, 60 minute duration | Below 9.1 | N | Coast Guard observers from nearby vessel |
| 25 Dec 2016 | evening | Tremor, possible minor, low-level ash emission, lightning | -- | -- | Seismic, lightning |
| 26 Dec 2016 | 1405 | Ash Plume | 9.1 | WSW | Lightning, seismic, satellite |
| 28 Dec 2016 | 1755 | Tremor, 50 minutes, Cloud cover obscured | -- | -- | Seismic |
| 29 Dec 2016 | 1900, 2345 | Continuous tremor at 1900, 30-minute-long ash producing event at 2345 | 6.1 | NE | Seismic station on Umnak, infrasound, satellite |
| 30 Dec 2016 | 2230 | Explosive event, 45 minutes, Cloud cover obscured | -- | -- | Seismic, infrasound, lightning |
| 31 Dec 2016 | 0500 | Low-level eruptive activity, continuous; cloud cover obscured; windy conditions affect local seismic stations | -- | -- | Dillingham infrasound |
| 02 Jan 2017 | 1353 | Minor explosions, 10 minutes of increased seismicity, cloud cover obscured | -- | -- | Seismic, infrasound |
| 03 Jan 2017 | 2118 | Seismic activity, 5 minutes, ash plume | 10.0 | N | Seismic, infrasound, lightning, satellite |
| 05 Jan 2017 | 1324 | Increased seismicity, ash plume, detached | 10.7 | NNW | Seismic, lightning, satellite, pilot |
| 08 Jan 2017 | 2233, 2256 | Two strong seismic pulses, two volcanic clouds | 10.7 | NW | Seismic, infrasound, satellite |
| 12 Jan 2017 | 1123, 1230 | Two short-lived explosions, plumes | 5.5, 4.4 | -- | Seismic, pilot |
| 14 Jan 2017 | 2126, 2216 | Six explosions, beginning 2216, no ash plumes observed | -- | -- | Seismic, lightning |
| 17 Jan 2017 | 0400, 0740 | Increasing tremor signal, Steam with minor ash | 4.6 | -- | Seismic, satellite |
| 18 Jan 2017 | 1320 | Explosion, dark ash cloud, strong thermal anomaly around vent | 9.4 | NE | Seismic, pilot, lightning, infrasound, satellite, SO2, MODVOLC |
| 20 Jan 2017 | 1317 | Explosion, ice-rich ash plume, lava at vent | 11.0 | SE | Seismic, lightning, pilot, satellite imagery of lava, infrasound |
| 22 Jan 2017 | 1409 | Explosion, ash plume | 9.1 | -- | Lightning, satellite |
| 24 Jan 2017 | 0453 | Explosion, ice-rich cloud with likely ash | 7.6-10.7 | E | Seismic, lightning |
| 26 Jan 2017 | 0650, 0706 | Exposion, ice-rich cloud with likely ash; ash drifted in multiple directions | 9.8, 6.1 | SE, NE | Seismic, lightning |
| 27 Jan 2017 | 0824 | Explosion, ice-rich cloud with likely ash | 7.6 | -- | Seismic, lightning |
| 30 Jan 2017 | 2020 | Eruption cloud, more than 10 short explosions, Trace ashfall in Dutch Harbor (98 km E) and strong SO2 odor | 7.6 | 125 km SE | Seismic, infrasound, lightning, satellite |
| 03 Feb 2017 | 0457, 0533 | Increased seismicity, small explosions, no ash detected | -- | -- | Seismic, infrasound |
| 03 Feb 2017 | 1641 | Seismic event, small plume | 7.6 | 40 km N | Infrasound, satellite, pilot |
| 5, 7, 8 Feb 2017 | -- | Weakly elevated surface temp | -- | -- | Satellite |
| 13 Feb 2017 | 0724 | Increased seismicity, no ash emissions above 3 km | -- | -- | Seismic, satellite |
| 17 Feb 2017 | 0955, 1546 | Explosive event, ash plume | 11.6, 7.6 | N | Seismic, satellite, pilot, infrasound, lightning |
| 18 Feb 2017 | 0450 | Explosion, ash emissions | 7.6 | SW | Seismic, infrasound, lightning, satellite |
| 19 Feb 2017 | 1708-1745 | Series of short explosive pulses, plume | 7.6 | 160 km SE | Seismic, infrasound, satellite |
| 07-08 Mar 2017 | 2236 | 3 hour explosive event, large ash plume, over 1,000 lightning strokes | 10.7 | E | Seismic, lightning, infrasound |
| 09-10 Mar 2017 | 1750 | Earthquake swarm, 20 hours | -- | -- | Seismic |
| 10-11 Mar 2017 | 1900 | Earthquake swarm, 10 hours | -- | -- | Seismic |
| 12 Mar 2017 | 0500 | Earthquake swarm | -- | -- | Seismic |
| 13 Mar 2017 | 1131 | Seismic event, small ash cloud, weakly elevated surface temps | 5.5 | 90 km SSW | Seismic, satellite |
| 16 May 2017 | 2232 | Increased seismicity, ash plume, 73 minutes | 10.4 | SW | Seismic, infrasound, lightning, satellite, pilot |
| 28 May 2017 | 1416 | Explosion, ash plume, 50 minutes, plume visible for 4 days | 10.7-13.7 | W, NE | Seismic, satellite, pilot |
| 31 May 2017 | 1842 | Several hour-long seismic swarm followed by short duration explosion, volcanic cloud | 7.3 | WNW | Seismic, infrasound, satellite |
| 05 Jun 2017 | 0750 | Explosion, small volcanic cloud | -- | -- | Seismic, pilot |
| 06 Jun 2017 | 0600 | Brief explosive event, possible plume, lava dome emerges | 1.8 | -- | Seismic, infrasound, satellite |
| 10 Jun 2017 | 0318 | Explosive eruption, ash-rich cloud | 10.4 | NW | Seismic, infrasound, lightning, satellite |
| 12 Jun 2017 | 1747 | Series of explosive events, ash plumes | 7.6 | SE | Seismic, infrasound |
| 13 Jun 2017 | 0817 | Six-minute long explosion, no plume observed | -- | -- | Seismic, infrasound |
| 23 Jun 2017 | 1649 | Five explosions, ash plume | 11.0 | 400-490 km E | Seismic, infrasound |
| 26 Jun 2017 | 1645 | 14-minute explosion, ash plume | 7.6 | -- | Seismic |
| 27 Jun 2017 | 0317 | 14-minute explosion, ash plume | 9.1 | NW | Seismic, lightning |
| 30 Jun 2017 | 0124 | Explosion, 20 minutes, small cloud | -- | 16 km N | Seismic |
| 02 Jul 2017 | 1248 | 16-minute explosion, ash plume | 11 | E | Seismic, infrasound |
| 04 Jul 2017 | 1651 | 13-minute explosive event, eruption cloud | 8.5 | SE | Seismic |
| 04 Jul 2017 | 1907 | 11-minute-long explosion, small cloud | 9.8 | SE | Seismic |
| 08 Jul 2017 | 1015 | Two eruption pulses, ash plume | 9.1 | N | Seismic, satellite |
| 09 Jul 2017 | 2347 | Two eruptions, 5-minutes and 7-minutes long, small ash cloud | 6.1 | SE | Seismic, satellite |
| 10 Jul 2017 | 1000, 1706 | Two explosions, no confirmed ash | -- | -- | Seismic, infrasound |
AVO reported that photos taken by a pilot on 10 January showed Bogoslof covered with dark gray ash, and a roughly 300-m-diameter submarine explosion crater on the E side of the island. The dark (ash-rich) plume from an explosion on 18 January (figure 5) was identified in satellite images and observed by a pilot; the event produced lightning strikes and infrasound signals detected by sensors in Sand Point and Dillingham. Analysis of a satellite image suggested the presence of very hot material (possibly lava) at the surface immediately surrounding the vent, which was the first such observation since the beginning of the eruption. The first MODVOLC thermal alerts were issued on 18 January.
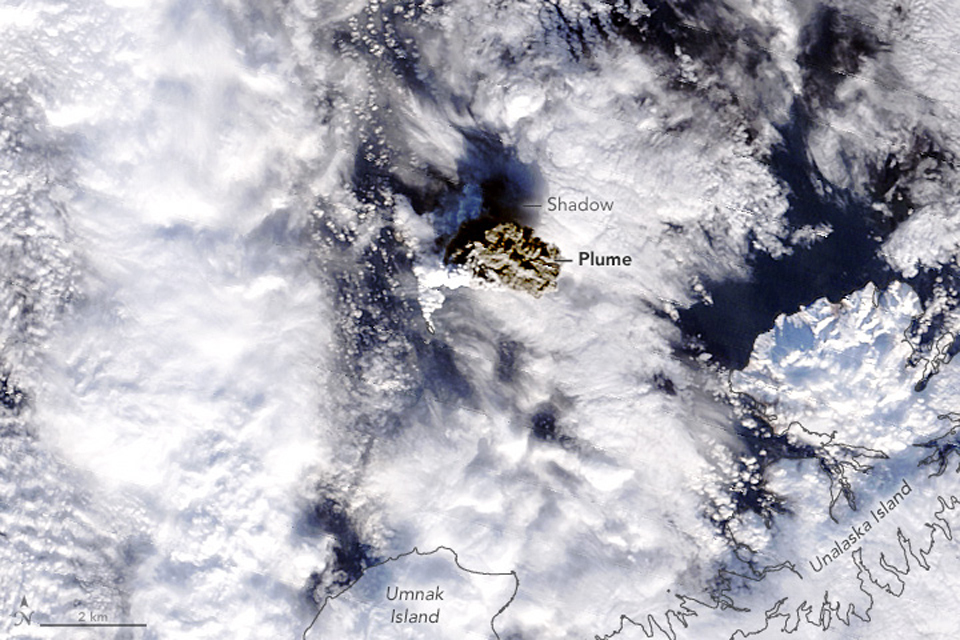 |
Figure 5. A large explosion at Bogoslof on 18 January 2017 produced a dark ash cloud that rose to 9.4 km and drifted NE. Captured by MODIS on NASA's Terra satellite. Courtesy of NASA Earth Observatory. |
AVO analysis of satellite images from 16 and 18 January 2017 (before the eruption that day) showed that the vent area, which formed on the NE end of the island in shallow water, had been filling in with eruptive material and building out of the water. On 20 January, satellite images showed an ice-rich plume and lava present at the vent. Prevailing winds carried the plume to the SE over the SW end of Unalaska Island, but no ash fall was reported. A high spatial resolution satellite image collected on 24 January showed AVO that the explosive eruptions continued to change the morphology of the island and the coastline (see figure 7). The eruptive vent, however, remained below sea level in the N portion of a figure-eight-shaped bay, as indicated by the presence of upwelling volcanic gases. There was no sign of lava at the surface.
A series of more than 10 short-duration explosions beginning on 30 January (AKST) and detected in seismic, infrasound, and lightning data, resulted in an ash plume that rose to 7.6 km altitude and drifted 125 km SE. Trace amounts of ashfall and a strong SO2 odor were reported in Dutch Harbor on Unalaska Island (98 km E) (figure 6). Satellite images acquired on 31 January showed additional significant changes to the morphology of the island (figure 7). AVO stated that freshly erupted volcanic rock and ash had formed a barrier that separated the vent from the sea.
 |
Figure 6. Trace ashfall in Unalaska, Alaska, on 31 January 2017 from Bogoslof. Courtesy of AVO. |
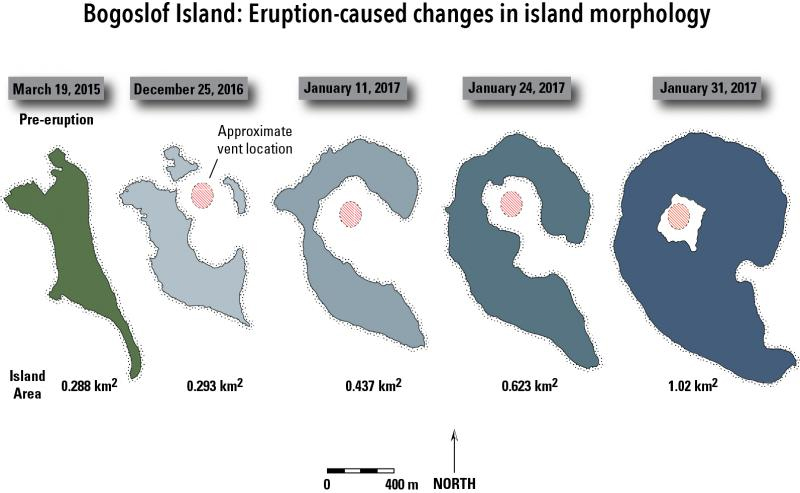 |
Figure 7. Changes in the morphology of Bogoslof Island resulting from the ongoing 2016-17 eruption. The 30-31 January 2017 eruptive activity generated roughly 0.4 square kilometers of new land. As of 31 January 2017 the island area was 1.02 square kilometers, roughly three times the size of the pre-eruption island. Nearly all of this new material consisted of unconsolidated pyroclastic fall and flow (surge) deposits that are highly susceptible to wave erosion. Courtesy of AVO. |
On 19 February 2017, a series of short-lived explosive pulses resulted in a plume that drifted 160 km SE over Unalaska Island. AVO geologists on the island described the cloud has having a white upper portion and a slightly darker lower portion. A satellite image from 23 February showed that the vent location at Bogoslof remained underwater. After the 19 February events, the volcano was quiet for two weeks.
Activity during March 2017. A 3-hour-long explosive event occurred overnight during 7-8 March 2017 and produced numerous strokes of volcanic lightning, high levels of seismicity and infrasound, and an ash cloud up to 10.7 km altitude that moved E over Unalaska Island. The seismicity was among the highest levels observed for the eruption sequence that began in mid-December 2016, and the more than 1,000 detected lightning strokes were by far the highest number observed to date. The eruptive activity again changed the shape of the island and temporarily dried out the vent area. Satellite images from 8 March showed that the W coast of the island appeared to have grown significantly due to the eruption of new volcanic ash and blocks. A new vent was also identified on the NW side of the island, and the lava dome emplaced during the 1992 eruption was partially destroyed (figure 8).
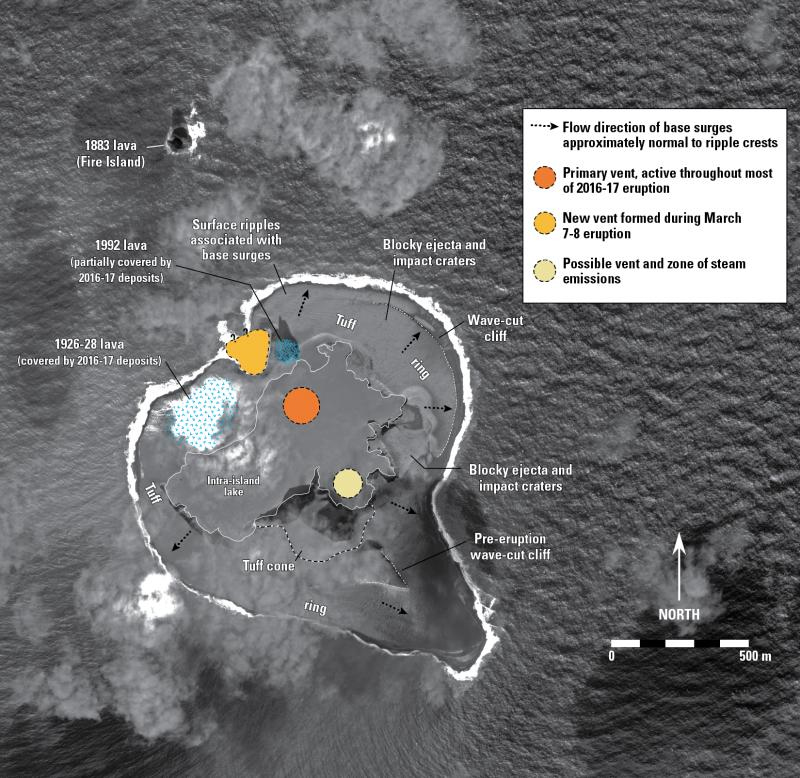 |
Figure 8. A Worldview-2 satellite image of Bogoslof Island on 11 March 2017 showing features and changes resulting from the 7-8 March 2017 activity. A new vent developed on the NW shore of the island adjacent to the lava dome that formed during the 1992 eruption. Most of the deposits on the surface appear fine-grained and were likely emplaced by pyroclastic base surges. The surface of these deposits exhibit ripples, dunes, and ballistic impact craters. The scalloped appearing shoreline of the intra-island lake is probably the result of groundwater related erosion (sapping) of the pyroclastic deposits as water refills the lake. Most or all of the water in the lake was likely expelled by the eruption column exiting the primary or other vents. The area of Bogoslof Island in this image is about 0.98 square kilometers. Image data provided under Digital Globe NextView License. Courtesy of AVO. |
Two earthquake swarms were detected during 9-11 March; the first began at 1750 on 9 March and ended at 1400 on 10 March, and the second was detected from 1900 on 10 March to 0500 on 11 March. Mildly elevated surface temperatures were identified in satellite data during 10-11 March. A third swarm began at 0500 on 12 March. A 12-minute-long explosive event, beginning at 1131 on 13 March, produced a small ash cloud that rose to an altitude of 5.5 km and drifted SSW. AVO noted that after the event, the level of seismic activity declined and the repeating earthquakes of the previous several days had stopped. Weakly elevated surface temperatures were observed in two satellite images from 13 March. A photograph taken by a pilot showed a low-level, billowy steam plume rising from the general area of the intra-island lake. Except for weakly elevated surface temperatures in satellite data, no significant activity was reported during the rest of March. The only activity detected during April 2017 was a brief increase in seismicity on 15 April. Aerial reconnaissance by the US Coast Guard on 8 May showed the dramatic changes of the island's shape (figure 9).
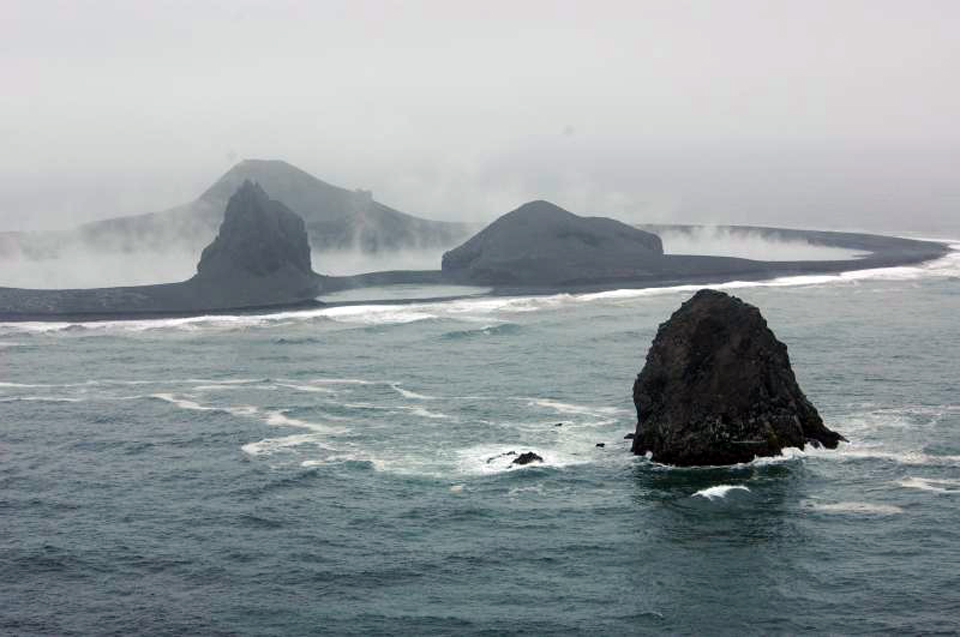 |
Figure 9. Bogoslof Island viewed from the NW on 8 May 2017. Fire Island (a remnant of lava from an 1883 eruption) is in the right foreground, and the new steaming lake that includes the submarine vent is behind the two dome remnants in the mid-ground. The 1992 lava is the remnant on the left and the 1926-28 lava is on the right. Bogoslof Island aerial reconnaissance courtesy of U.S. Coast Guard Air Station Kodiak and U.S.C.G. Cutter Mellon. Photo by Max Kaufman, courtesy of AVO. |
Activity during May-July 2017. Following a pause in explosive activity that lasted a little over two months, Bogoslof erupted explosively at 2232 (AKDT) on 16 May. The eruption, which lasted about 70 minutes, was detected by seismic and infrasound sensors on neighboring islands and the resulting ash-cloud-generated volcanic lightning that was detected by the Worldwide Lightning Location Network. A pilot report and satellite images showed that the plume rose as high as 10.4 km, and then drifted SW. Trace ashfall was reported in the community of Nikolski on Umnak Island (125 km SW). A drifting sulfur dioxide cloud from the eruption was detected for several days using satellite-based sensors. The eruption altered the northern coastline of the island, with the crater lake breached by a 550-m-wide gap along the N shore. Part of the NE shore had been extended 300 m due to new tephra deposits.
Another large explosion began at 1416 on 28 May 2017. Pilot and satellite observations indicated that ash plumes rose at least 10.7 km and possibly as high as 13.7 km altitude (figure 10). An observer on Unalaska Island reported seeing a large white-gray mushroom cloud form over Bogoslof, with ashfall to the W. The event lasted 50 minutes. On 29 May the ash cloud continued to drift NE, and on 2 June, an SO2 plume from the event was still visible in satellite data drifting over the Hudson Bay region.
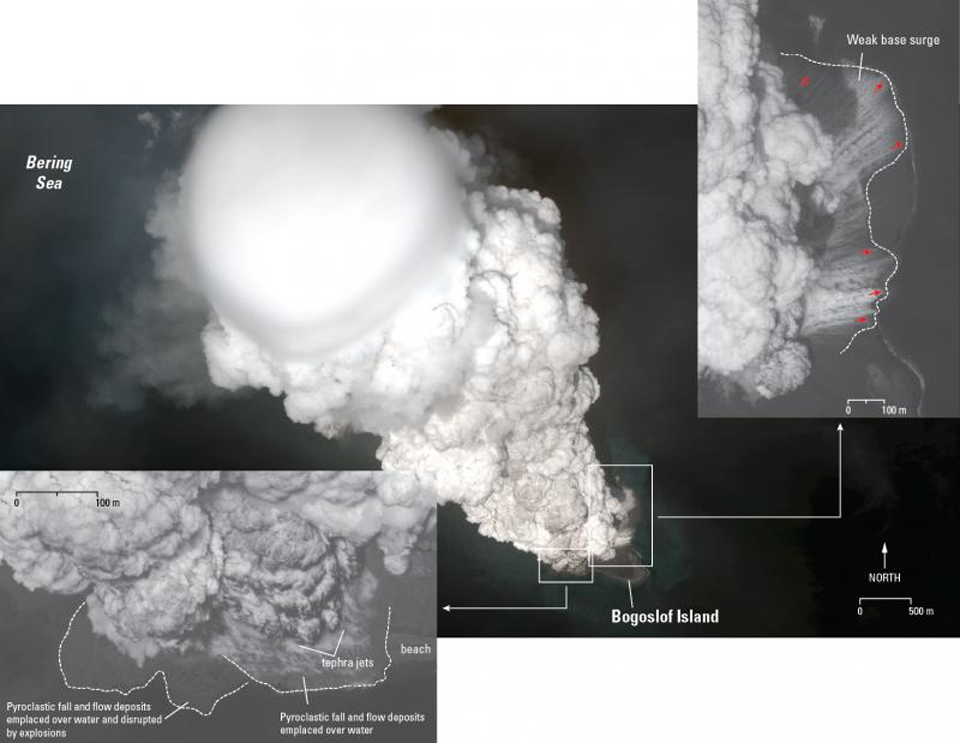 |
Figure 10. Enlarged portions of 28 May 2017 satellite image of Bogoslof Island. Inset image on lower left shows pyroclastic fall and flow material emplaced over water. Some of the material appears to have been disturbed, possibly by the force of the eruption column. It is unclear if this material represents new land or material floating on the water. Tephra jets are common features of many shallow submarine eruptions. The inset image in the upper right shows a weak base surge propagating from the base of the eruption column across the tuff ring. Image data provided under the Digital Globe NextView License. Courtesy of AVO. |
On 5 June, a vessel in the area reported vigorous steaming and a white plume rising at least a kilometer above sea level. Also, a substantial submarine sediment plume was seen in satellite imagery drifting N from the lagoon area (figure 11). A brief explosive event at 0600 on 6 June likely produced a low-level (less than 3 km) emission. A possible plume at 1.8 km that quickly dissipated was identified in a satellite image following the detection of the activity in seismic and infrasound data.
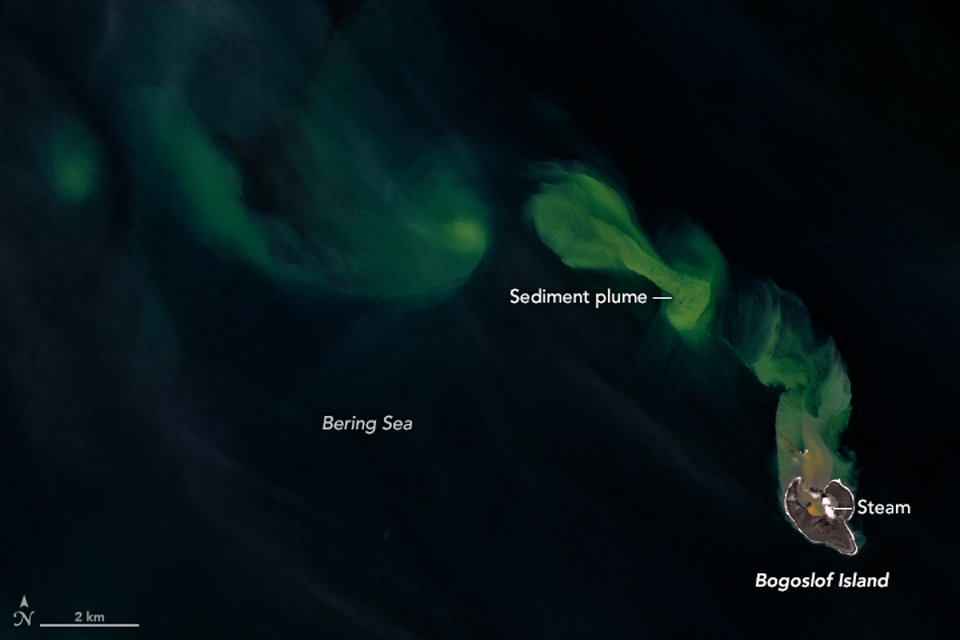 |
Figure 11. Landsat-8 image of Bogoslof from 5 June 2017 at 2200 UTC (1400 AKDT). This composite image of visible and thermal infrared data shows a sediment plume in the ocean that extends from the vent region in the horseshoe-shaped lagoon. Warm water outflow is highlighted in color extending northward from the lagoon where it mixes with colder ocean water. A hot vent just S of the lagoon can be seen in orange, and several small puffs of white steam are visible coming from this region. Courtesy of NASA Earth Observatory. |
AVO reported that a new lava dome breached the surface of the ocean on or around 6 June 2017; it was the first observation of lava at the surface since the start of the eruption in mid-December 2016 (figure 12). The dome was an estimated 110 m in diameter on 7 June, and then grew to 160 m in diameter by 9 June. Four short-duration explosions were detected in seismic and/or infrasound data between 5 and 7 June, and generated volcanic clouds that in many cases were too small to be observed in satellite data. AVO reported that robust steaming was identified in satellite data and by observers aboard a U.S. Fish and Wildlife Service ship in the region following the emergence of the lava dome likely due to, or enhanced by, the effusion of lava into the ocean.
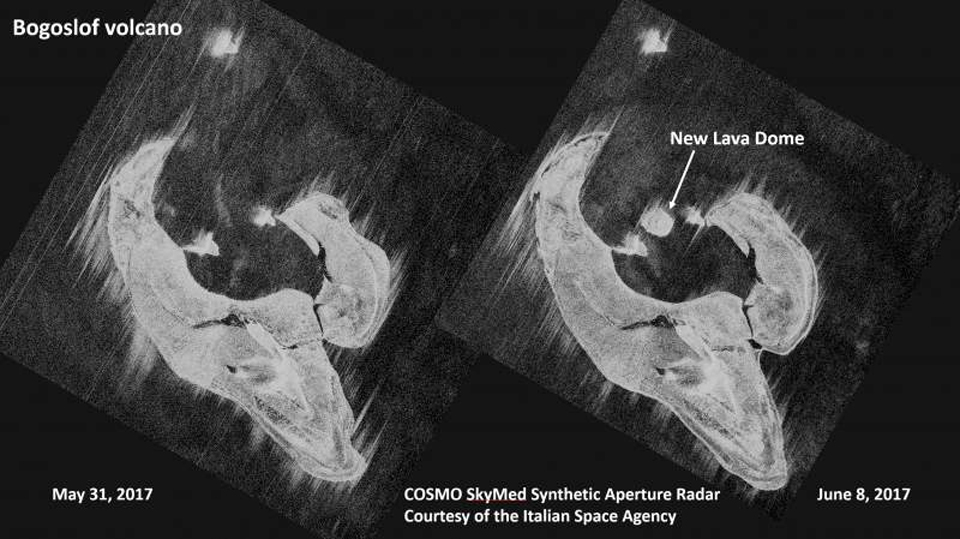 |
Figure 12. Comparison of satellite radar images from 31 May and 8 June 2017 of Bogoslof showing the newly emplaced lava dome. The diameter of the short-lived dome was about 110 m. N is to the top. Courtesy of AVO. |
A series of six explosions was detected on 10 June, starting with a 2-hour explosive event that emitted an ash-rich cloud to 10.4 km altitude that was detected in seismic, infrasound, lightning, and satellite data. This event destroyed the 160-m-diameter lava dome that was first observed on 5 June (figure 13). On 12 June, a series of four small explosions lasting 10-30 minutes each emitted volcanic clouds that rose to a maximum height of 7.6 km, and dissipated within about 30 minutes. On 13 June, a six-minute-long explosion occurred, although no ash cloud was observed in satellite imagery likely because it's altitude was below detection limits.
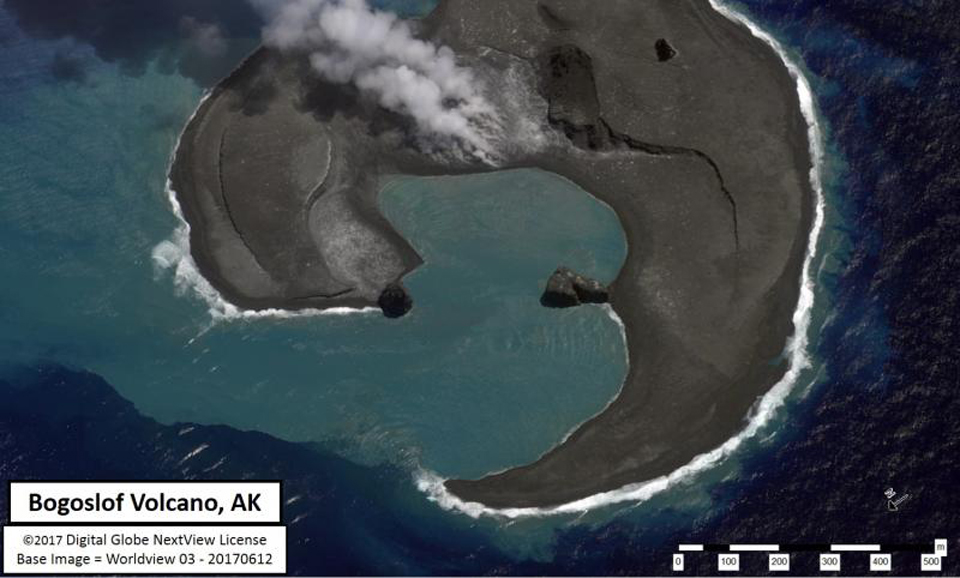 |
Figure 13. Worldview satellite image of Bogoslof taken at 2313 UTC on 12 June 2017. Note that N is to the lower left of the image. The circular embayments were formed by a series of more than 40 explosions that began in mid-December 2016. These explosions have greatly reshaped the island as material was removed and redeposited as air fall. Vigorous steaming was observed S of the most active vent areas in the lagoon. Lava extrusion produced a circular dome that first rose above the water on 5 June and grew to a diameter of ~160 m before being destroyed by an explosion early in the day on 10 June. Large blocks of the destroyed dome can be seen littering the surface of the island near the lagoon. Courtesy of AVO. |
Weakly elevated surface temperatures detected in satellite imagery on 10 and 11 June suggested to AVO that a new lava dome was extruding beneath the ocean surface. Satellite imagery showed persistent degassing from the island in between explosions. In addition, residents of Unalaska/Dutch Harbor reported smelling sulfur on 12 June, and winds were consistent with a source at Bogoslof. AVO reported that elevated surface temperatures and a small steam emission were identified in satellite images during 13-14 and 16 June. A 13-km-long steam plume was visible on 18 June.
A series of nine explosions were detected in seismic and/or infrasound data during the night of 23 June, the largest of which produced a volcanic cloud reaching an altitude of 11 km that drifted well over 400 km E (figure 14). Additional explosions on 26 and 27 June sent volcanic clouds to 7.6 and 9.1 km altitude, respectively. Winds carried most of these plumes N and NE; AVO received no reports of ashfall from local communities. Bogoslof erupted again on 29 June and produced a small plume, and several times during the first two weeks of July explosions produced larger plumes that rose to 8.5-11 km altitude. Two explosions that occurred on 10 July without producing observed ash were the last for the rest of the month. Weakly elevated surface temperatures were observed in clear satellite images on 12 and 16 July. No further activity was reported for the rest of July 2017.
 |
Figure 14. Ash plume rising above Bogoslof, 1814 AKDT, 23 June 2017. The view is from Mutton Cove on SW Unalaska Island about 67 km SE of the volcano. AVO estimated the volcanic cloud reached about 11 km above sea level. Photo by Masami Sugiyama courtesy of Allison Everett and AVO. |
A modest thermal signal was detected by the MIROVA system between February and July 2017 consistent with the activity that suggested lava dome growth during that time (figure 15).
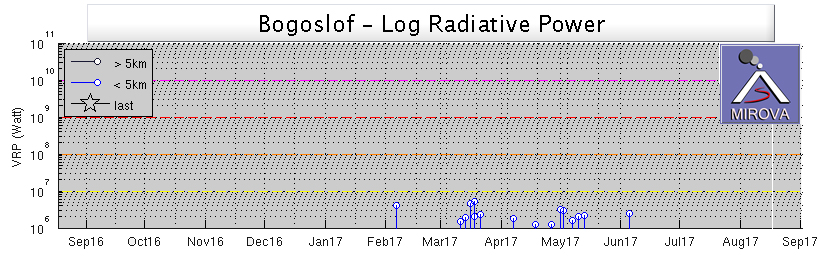 |
Figure 15. MIROVA Log Radiative Power graph of thermal energy at Bogoslof for the year ending on 17 August 2017. A low-level thermal anomaly was first detected in early March, and was intermittent through early July. Courtesy of MIROVA. |
References: Beget, J.E., Larsen, J.F., Neal, C.A., Nye, C.J., and Schaefer, J.R., 2005, Preliminary volcano-hazard assessment for Okmok Volcano, Umnak Island, Alaska: Alaska Division of Geological & Geophysical Surveys Report of Investigation 2004-3, 32 p., 1 sheet, scale 1:150,000.
Geological Summary. Bogoslof is the emergent summit of a submarine volcano that lies 40 km N of the main Aleutian arc. It rises 1,500 m above the Bering Sea floor. Repeated construction and destruction of lava domes at different locations during historical time has greatly modified the appearance of this "Jack-in-the-Box" volcano and has introduced a confusing nomenclature applied during frequent visits by exploring expeditions. The present triangular-shaped, 0.75 x 2 km island consists of remnants of lava domes emplaced from 1796 to 1992. Castle Rock (Old Bogoslof) is a steep-sided pinnacle that is a remnant of a spine from the 1796 eruption. The small Fire Island (New Bogoslof), about 600 m NW of Bogoslof Island, is a remnant of a lava dome formed in 1883.
Information Contacts: Alaska Volcano Observatory (AVO), a cooperative program of a) U.S. Geological Survey, 4200 University Drive, Anchorage, AK 99508-4667 USA (URL: http://www.avo.alaska.edu/), b) Geophysical Institute, University of Alaska, PO Box 757320, Fairbanks, AK 99775-7320, USA, and c) Alaska Division of Geological & Geophysical Surveys, 794 University Ave., Suite 200, Fairbanks, AK 99709, USA (URL: http://www.dggs.alaska.gov/); Anchorage Volcanic Ash Advisory Center (VAAC), Alaska Aviation Weather Unit, NWS NOAA US Dept of Commerce, 6930 Sand Lake Road, Anchorage, AK 99502-1845(URL: http://vaac.arh.noaa.gov/); NASA Earth Observatory, EOS Project Science Office, NASA Goddard Space Flight Center, Goddard, Maryland, USA (URL: http://earthobservatory.nasa.gov/).