Nishinoshima
Japan
27.247°N, 140.874°E; summit elev. 100 m
All times are local (unless otherwise noted)
Japan's Nishinoshima volcano erupted above sea level in November 2013 for the first time in 40 years. Between then and November 2015 the island grew from 0.29 to 2.63 km2 as a result of numerous lava flows erupting from vents around a central pyroclastic cone (BGVN 41:09). Eruptive activity ended in November 2015, and no additional activity was observed during 2016. A new eruption that included ash emissions and lava flows began in April 2017, and continued until mid-August 2017. Two major lobes of lava emerged from the central crater of the pyroclastic cone and flowed SW and W, expanding the size of the island to about 2.2 km in the E-W dimension and 1.9 km in the N-S dimension, a total area of about 3 km2.
Information comes primarily from monthly reports provided by the Japan Meteorological Agency (JMA) and reports and photographs taken by the Japan Coast Guard (JCG), which monitors the volcano due to its remote location in the Pacific Ocean, approximately 940 km S of Tokyo along the Izu-Bonin arc. Satellite thermal data (MODIS) also provides valuable information about the active heat flow at the volcano.
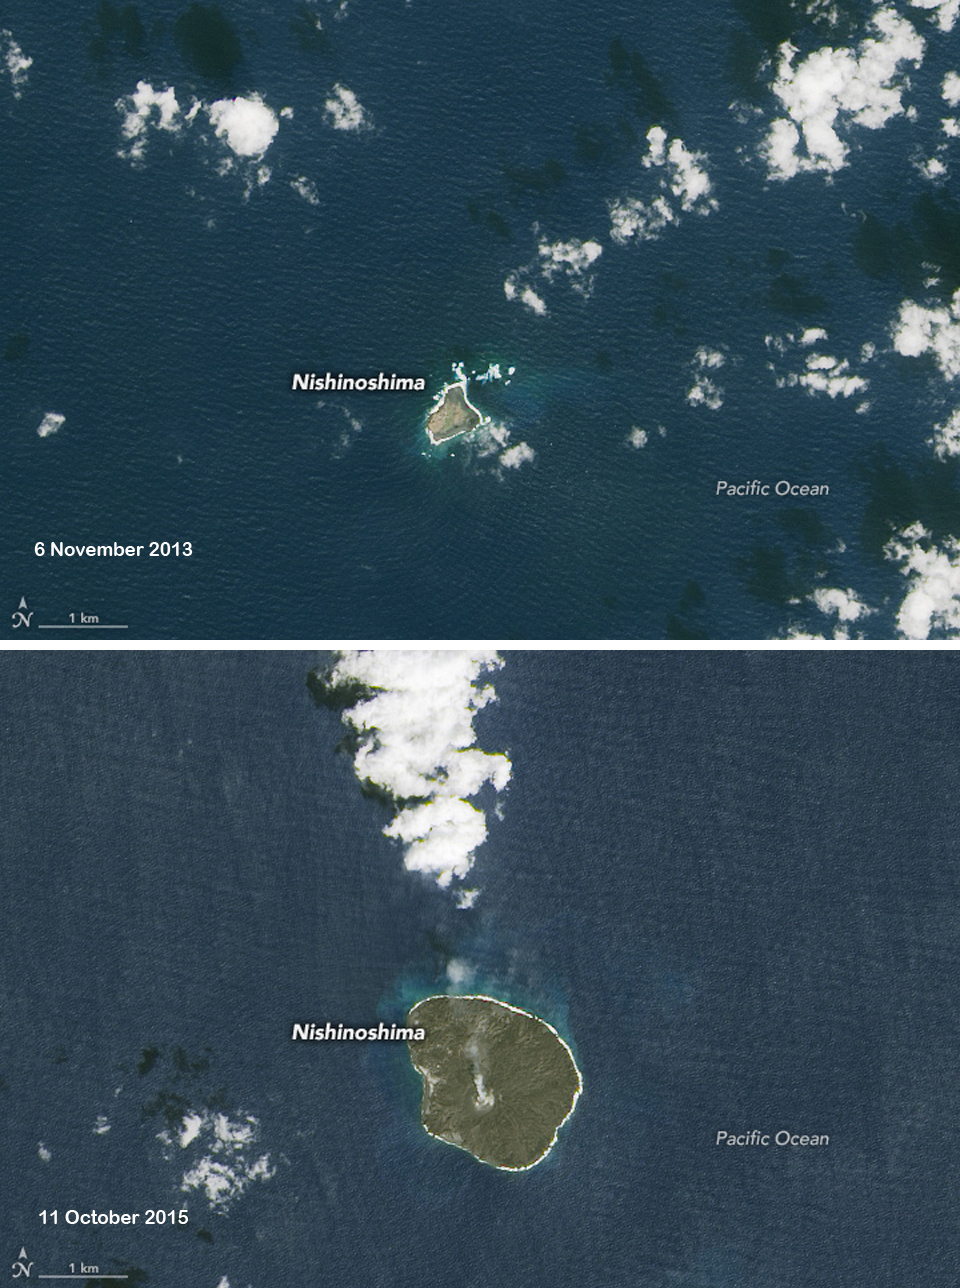
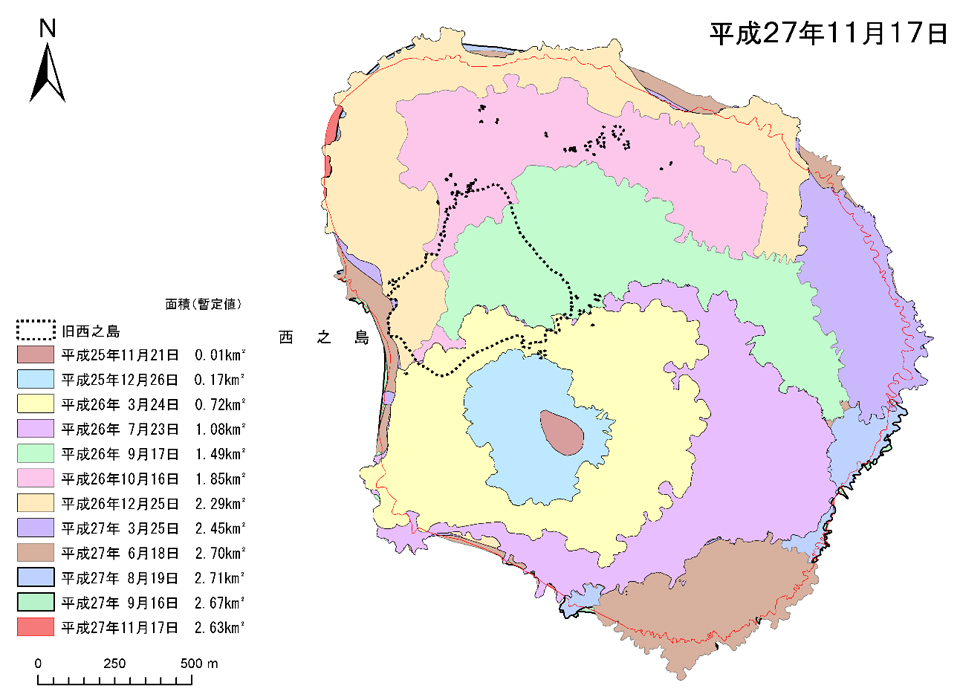
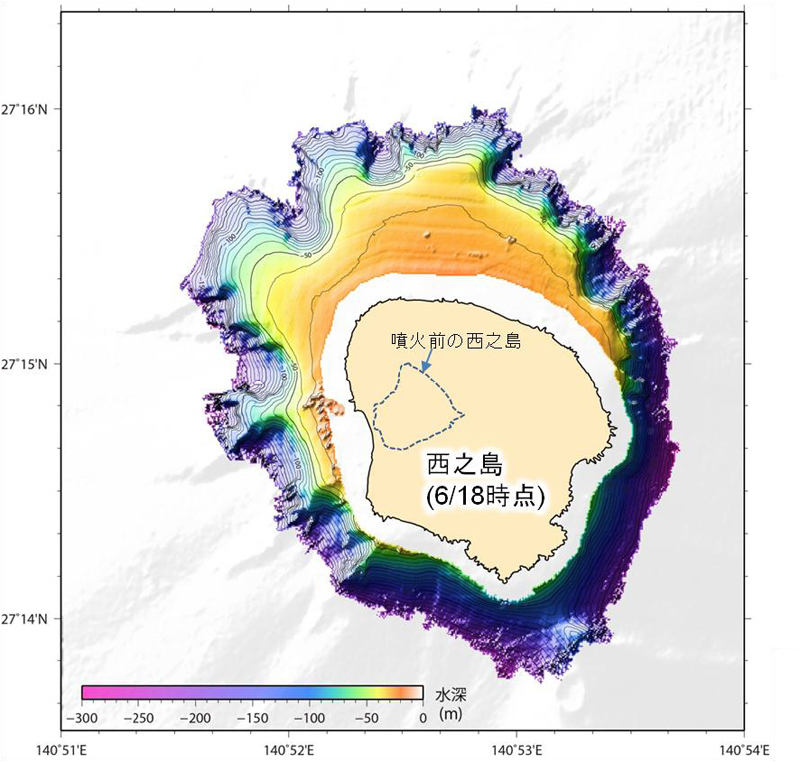
Changes during November 2013-October 2015. Nishinoshima grew about twelve times in area between 6 November 2013 and 11 October 2015, after nearly two years of constant eruptive activity (figure 39). JCG presented a map in November 2015 showing the areas added to Nishinoshima between November 2013 and November 2015 (figure 40). The Ocean Information Division of JMA conducted a seabed topographic survey in a 4-km radius around the island between 22 June and 9 July 2015 that revealed the new submarine topography (figure 41).
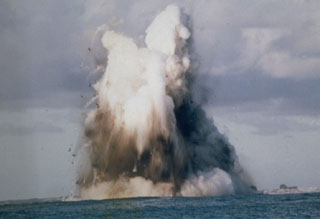
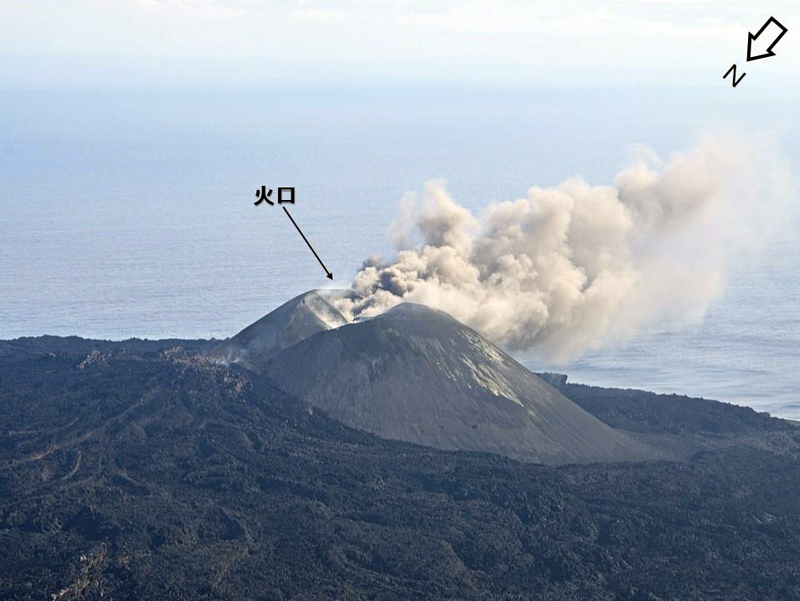
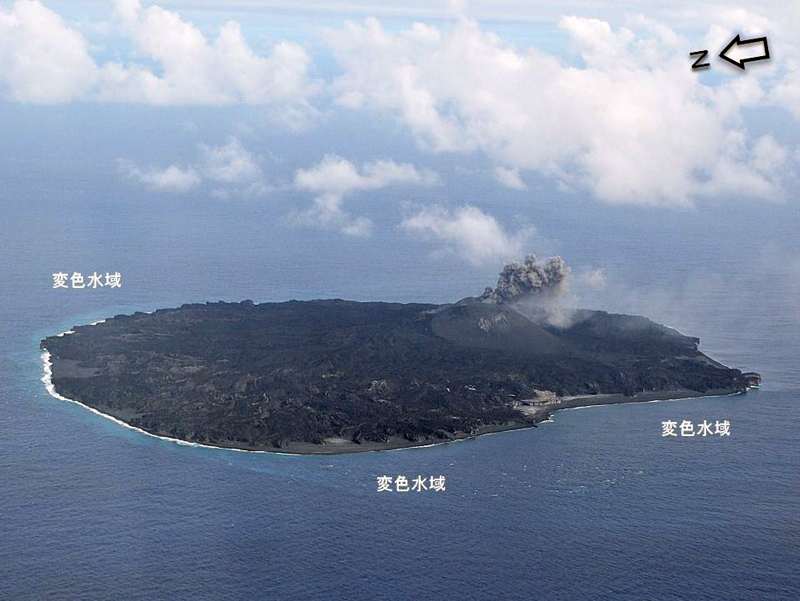
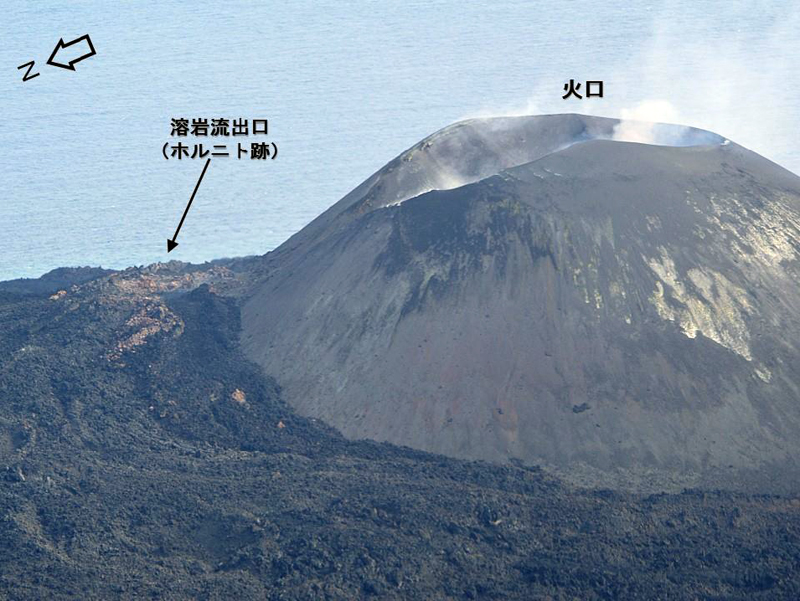
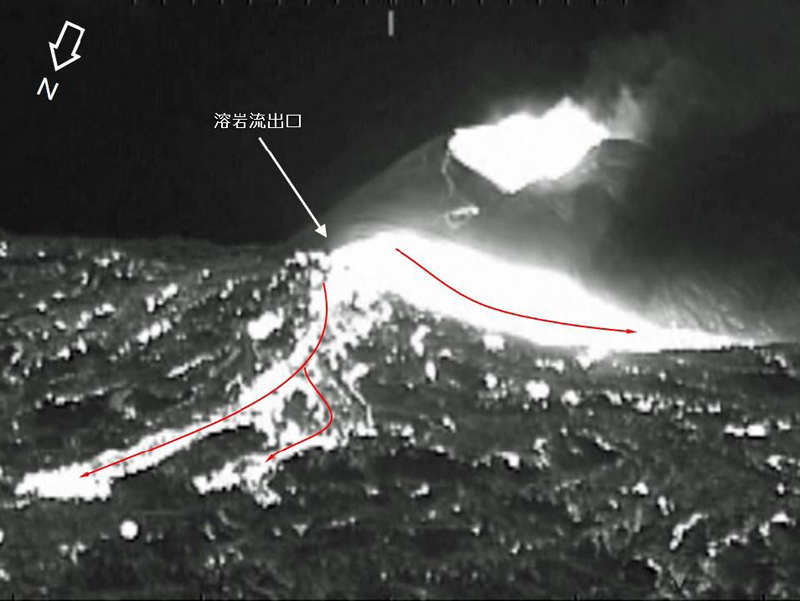
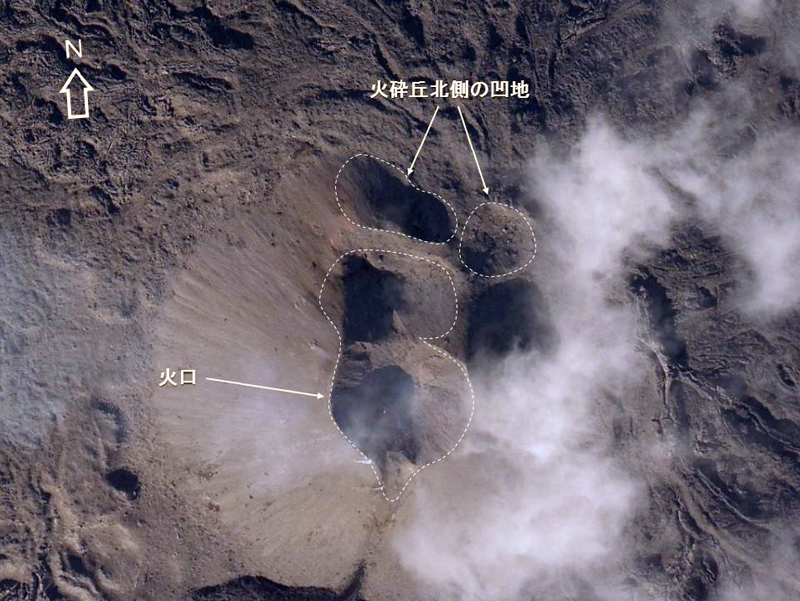
Activity during October-December 2015. The JCG visited Nishinoshima on 13 October, 17 November, and 22 December 2015 (BGVN 41:09). Explosions with ash plumes (figures 42 and 43) and active lava flows from a hornito on the flank (figures 44 and 45) were observed on 13 October. On 17 November they observed crater-like depressions on the N flank of the pyroclastic cone (figure 46).
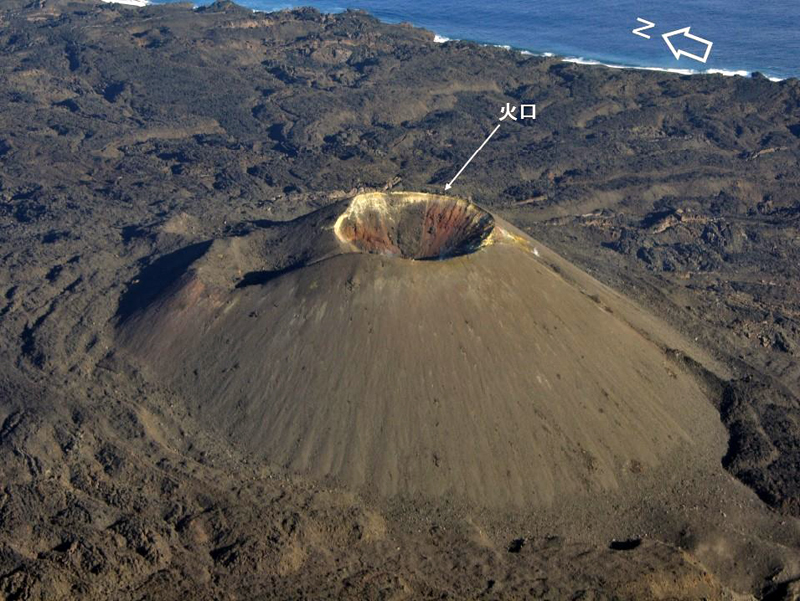
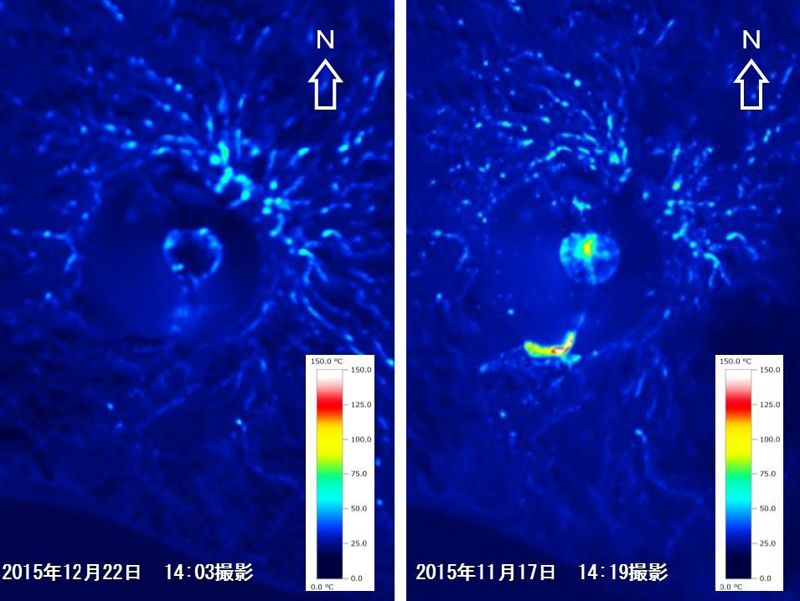
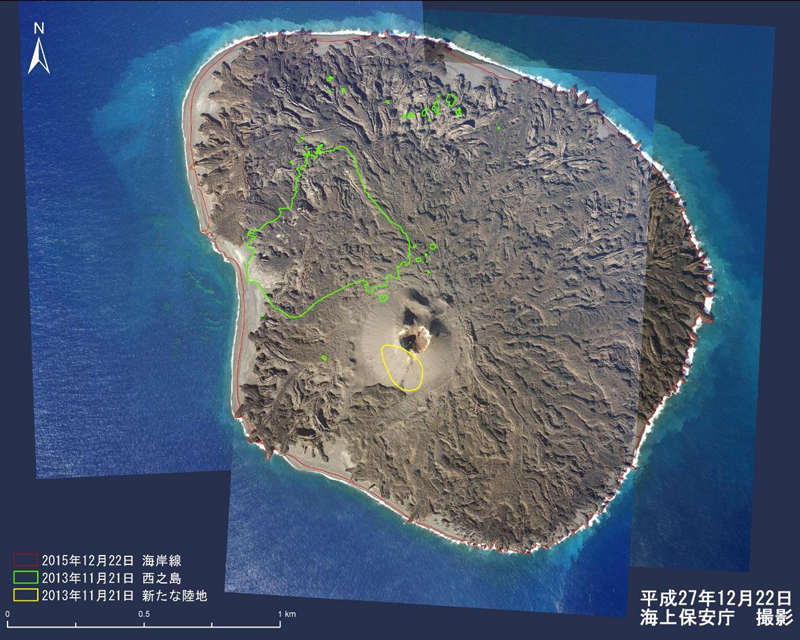
By the time of their visit on 22 December, there were no further signs of activity from the pyroclastic cone (figure 47), and a comparison of thermal imagery between 17 November and 22 December (figure 48) showed a dramatic decline in heat flow. Aerial photography of the island that day revealed the extent of the new island compared with the pre-November 2013 landmass (figure 49).
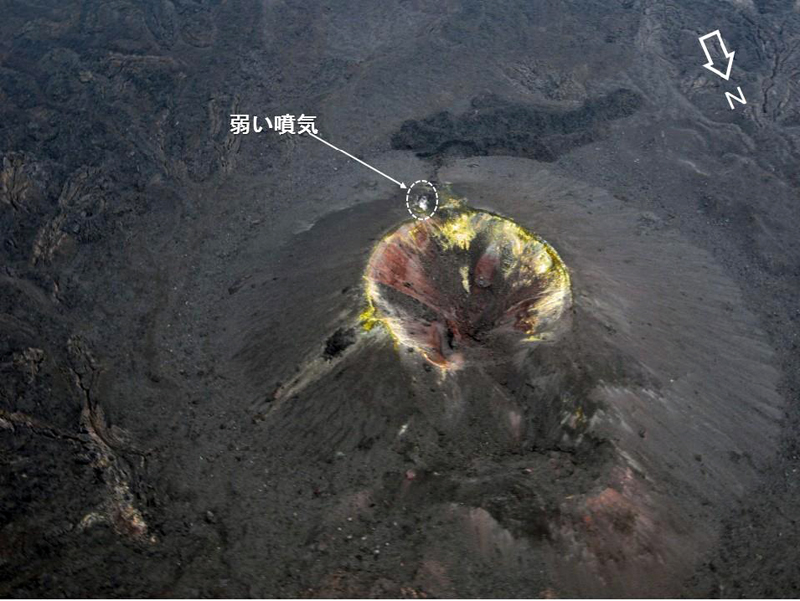
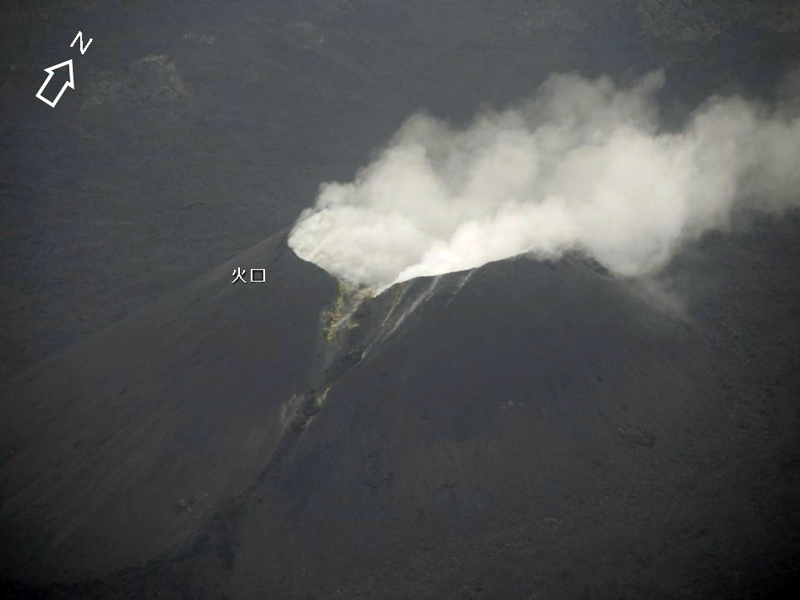
Activity during 2016. The Japan Coast Guard continued with monthly observations during 2016, with visits on 19 January, 3 February, 5 March, 14 April, 20 May, 7 June, 19 July, 18 August, 15 September, and 6 October 2016. Only weak fumarolic activity was observed during the February visit (figure 50). Thermal measurements consistently remained at or below 100°C during the year; plumes of light brown to yellowish-green discolored water generally extended 200-400 m away from the coastline, suggesting continued submarine hydrothermal activity. The discolored water extended 1,000 m off the N coast during the 5 March visit. Dense steam filled the summit crater of the pyroclastic cone on 14 April (figure 51). During their 20 May visit, JCG noted a slight increase in size of the beach areas around the shoreline; this increase continued for several months, likely a result of fresh lava flows breaking down into sand from the wave action. During May and June, small amounts of magmatic gas were visible rising a few tens of meters above the summit crater.
On 17 August, JMA cancelled the maritime volcano warning (preventing vessels from approaching within 1.5 km), as a result of the decreased activity. Professor Kenji Nogami of the Tokyo Institute of Volcanic Fluid Research Center noted an increase in the discolored water area, extending about 1,000 m on the S side of the island during the JCG overflight on 15 September. JCG conducted a new submarine survey of the area during 22 October-10 November 2016 to provide data for new maritime charts. No additional reports were issued until a new eruptive episode was observed on 20 April 2017.
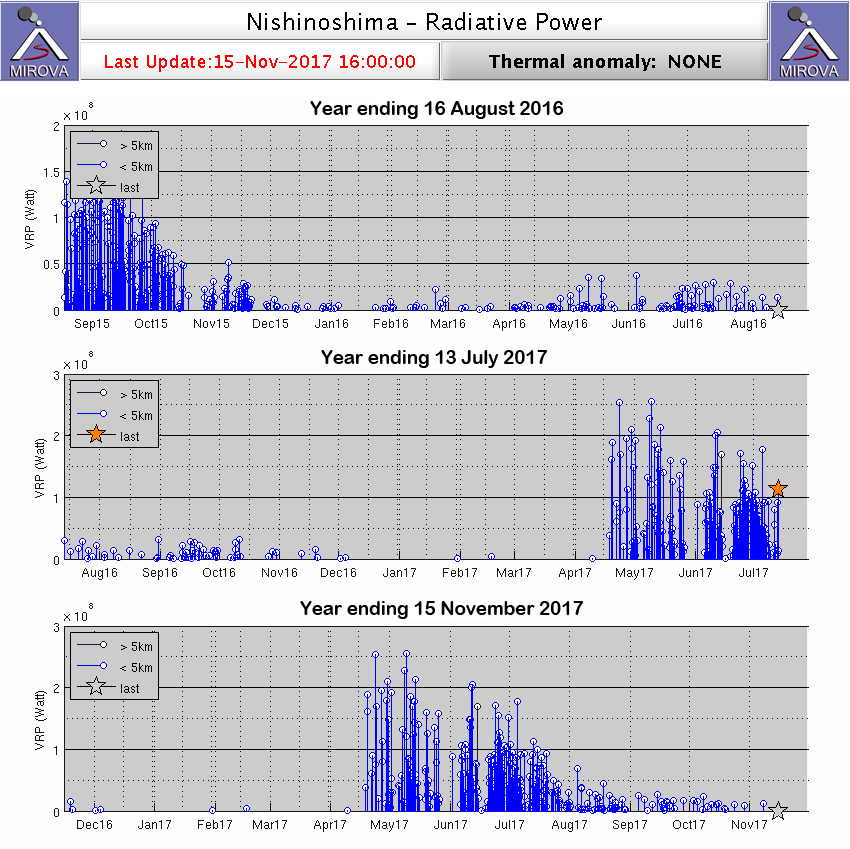
While the Japan Coast Guard did not observe volcanic activity during 2016, the MIROVA data suggests that low levels of heat flow were intermittent throughout the year, with slight increases during May-June, July-August, and September-October 2016 (figure 52). The heat flow recorded by MIROVA during 2016 was about an order of magnitude less that that during the period with active lava flows in September-November 2015.
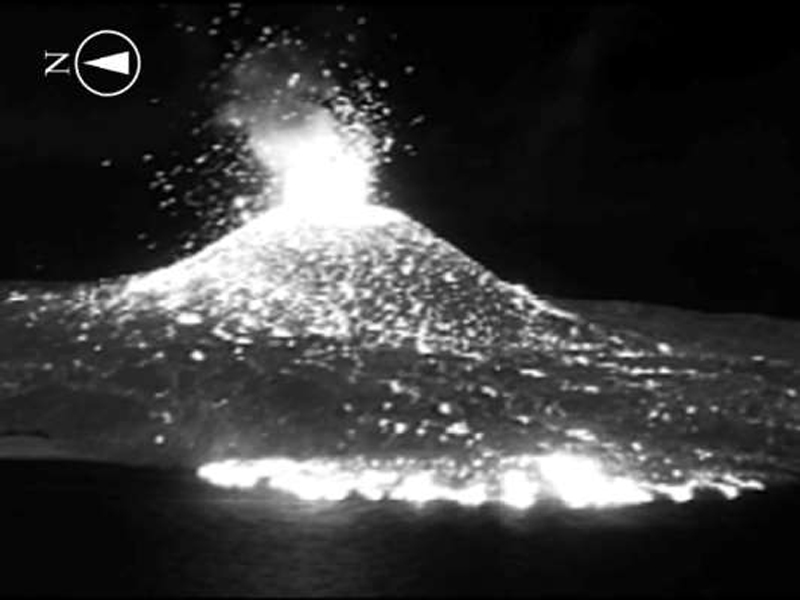
Activity during April-October 2017. The JCG observed renewed eruptive activity when they visited Nishinoshima on 20 April 2017. They confirmed the existence of a new lava flow from the summit crater of the pyroclastic cone on 21 April. They also observed a gray ash plume 500 m wide rising 1,000 m above the crater, Strombolian explosions at intervals of tens of seconds, and molten lava within the crater. A new lava flow appeared on the N side of the cone, although it had not yet reached the ocean. By the time of the next overflight on 27 April, JCG confirmed that the lava flow had reach the ocean on the W and SW coast of the island (figure 53), and a new pyroclastic cone had formed within the summit crater. Strong MODVOLC multi-pixel thermal alerts first appeared on 18 April, and persisted with no more than a few day's break until early August 2017. The Tokyo VAAC reported an ash plume on 20 April at 2.4 km altitude drifting W, but it was not identifiable in satellite data.
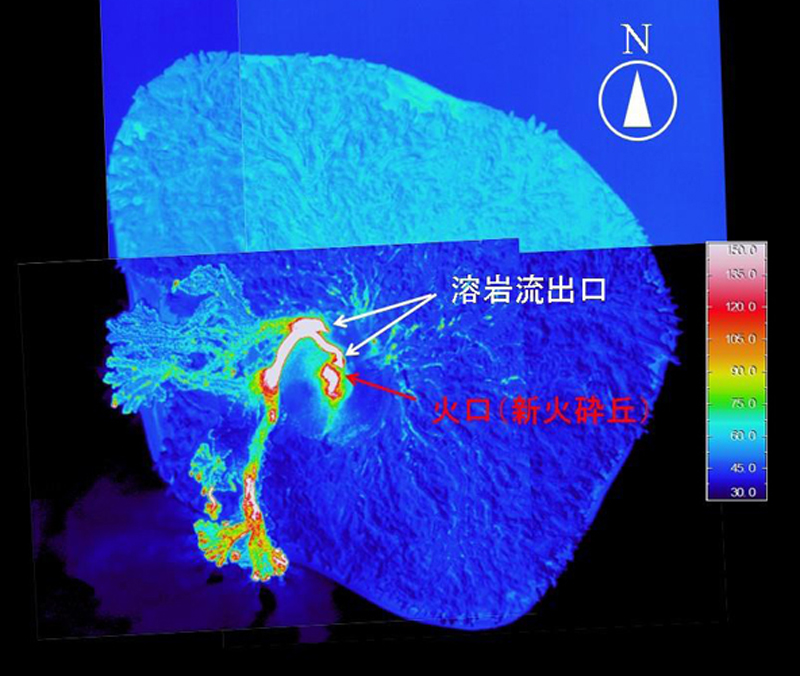
Strombolian explosions were observed every 40-60 seconds during an overflight on 2 May 2017. They emerged from the new pyroclastic cone at the center of the summit crater. Ash plumes rose 500 m and drifted SW. Two vents on the N side of the crater produced lava that flowed to the ocean on the SW coast of the island (figure 54). Areas of new lava extended about 170 m W and 180 m SW into the ocean. Continued ash emissions were drifting N from the island on 24 May, and lava continued flowing into the sea along the SW shore.
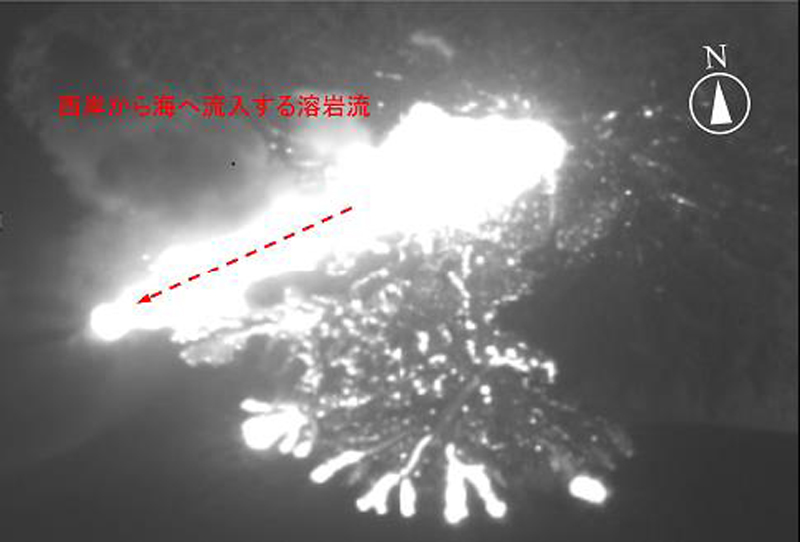
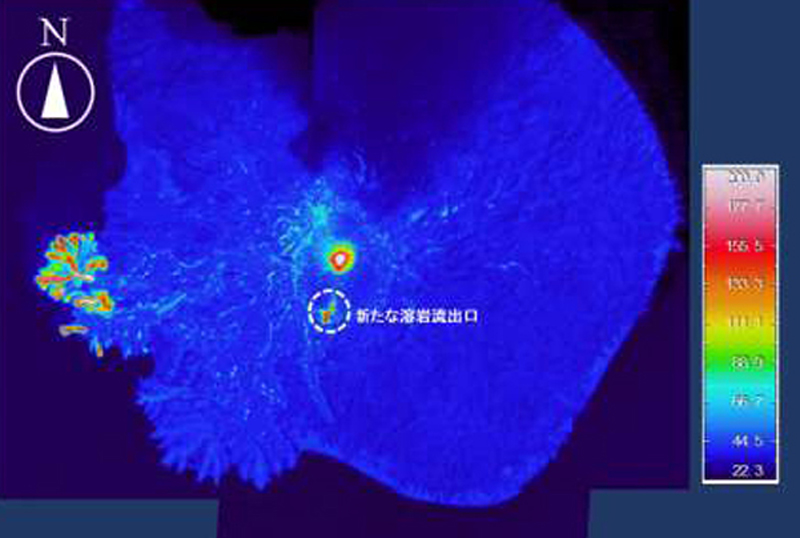
During the next overflight on 6 June, JCG confirmed a new lava flow emerging from the W flank of the pyroclastic cone and flowing to the sea (figure 55). In late June 2017, JMA published a new bathymetric map of Nishinoshima and surrounding waters as of October 2016. JCG noted that explosions continued at 30-second intervals during their 29 June overflight. Ash plumes rose to about 200 m above the crater rim, and lava was entering the sea on the W side of the island (figure 56). The new lava flows now extended into the sea about 330 m to the W and 310 m to the SW (figure 57).
The Tokyo VAAC reported multiple ash emissions during June. An eruption generated an ash plume on 8 June that rose to 1.2 km altitude and drifted SW. Emissions were observed in satellite imagery for the next 24 hours before dissipating. Another ash plume on 26 June was reported drifting NE at 3 km altitude. Ash seen on 30 June was reported drifting W at 2.1 km altitude for most of the day before dissipating. The Tokyo VAAC reported a possible eruption on 2 July that sent an E-drifting ash plume to 1.5 km altitude. It was later reported at 3 km altitude before dissipating. Ash and bombs were observed exploding from the central crater during the 11 July 2017 JCG overflight. Lava was also still entering the sea on the W side of the island (figure 58).
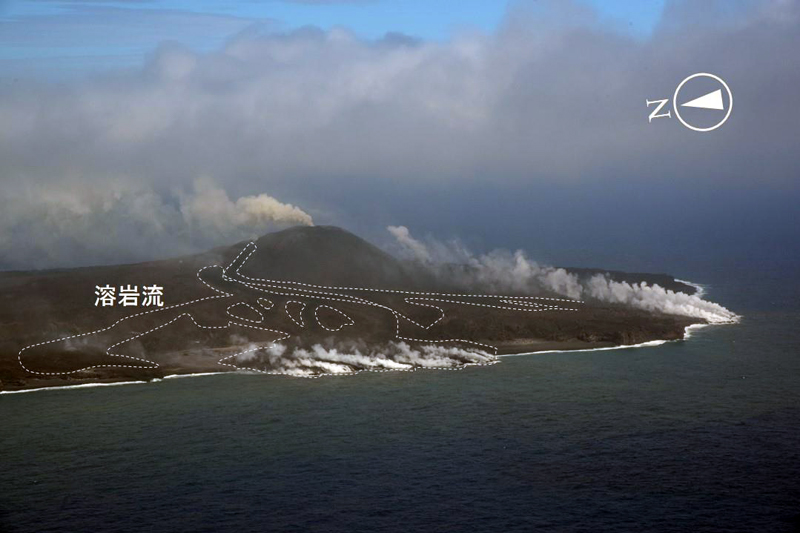
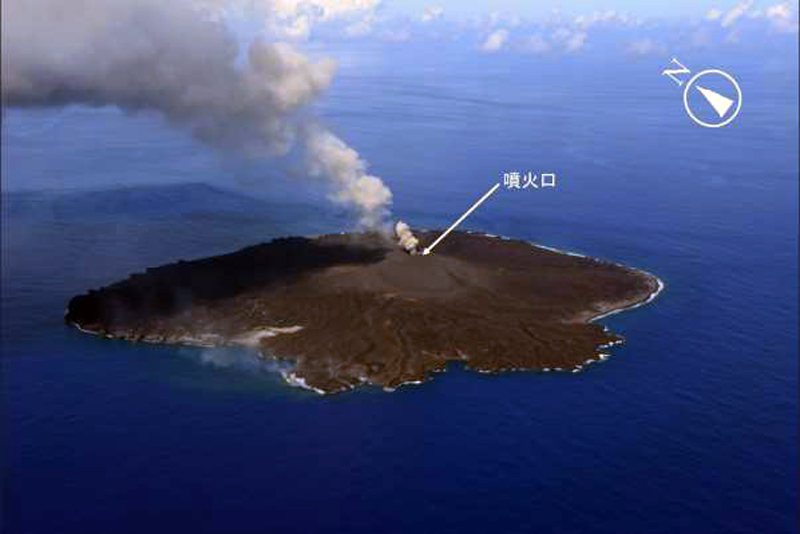
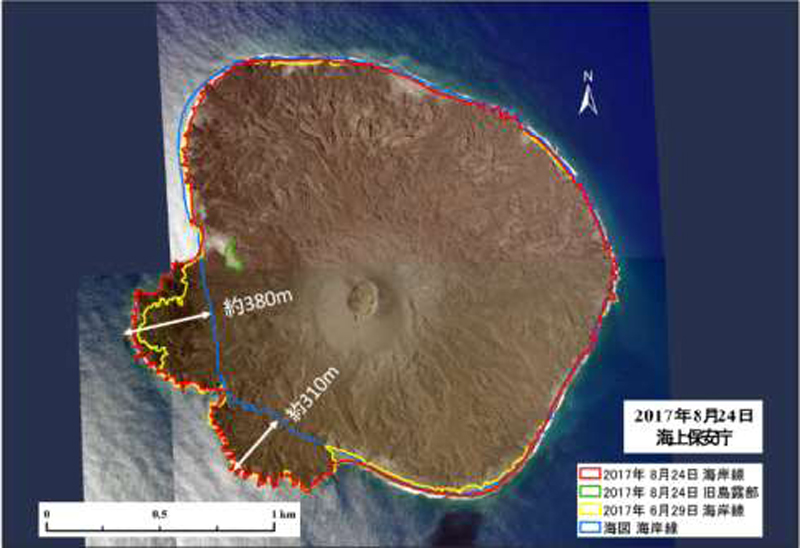
The JCG visited the island on 11 and 24 August 2017. They did not witness any eruptive activity, but diffuse steam plumes were seen rising from the crater rim. They also noted steam plumes from lava that was still entering the sea on the W side of the island on 11 August, but not during the 24 August flyover. Aerial photos taken that day showed the extent of new land formed since late April (figure 59). Additional flyovers by JCG on 15 September and 7 October confirmed a lack of active lava flows, and only minor steam plumes were reported rising from the crater rim. The last MODVOLC thermal alert appeared on 5 August. The MIROVA thermal anomaly signals that had abruptly reappeared in late April gradually tapered off throughout August, confirming a decrease in the heat flow as the lava flows cooled (figure 52).
Geological Summary. The small island of Nishinoshima was enlarged when several new islands coalesced during an eruption in 1973-74. Multiple eruptions that began in 2013 completely covered the previous exposed surface and continued to enlarge the island. The island is the summit of a massive submarine volcano that has prominent peaks to the S, W, and NE. The summit of the southern cone rises to within 214 m of the ocean surface 9 km SSE.
Information Contacts: Japan Meteorological Agency (JMA), Otemachi, 1-3-4, Chiyoda-ku Tokyo 100-8122, Japan (URL: http://www.jma.go.jp/jma/indexe.html); Japan Coast Guard (JCG), Policy Evaluation and Public Relations Office, 100-8918, 2-1-3 Kasumigaseki, Chiyoda-ku, Tokyo, Telephone, 03-3591-6361 (URL: http://www.kaiho.mlit.go.jp/info/kouhou/h29/index.html); NASA Earth Observatory, EOS Project Science Office, NASA Goddard Space Flight Center, Goddard, Maryland, USA (URL: http://earthobservatory.nasa.gov/); Hawai'i Institute of Geophysics and Planetology (HIGP) - MODVOLC Thermal Alerts System, School of Ocean and Earth Science and Technology (SOEST), Univ. of Hawai'i, 2525 Correa Road, Honolulu, HI 96822, USA (URL: http://modis.higp.hawaii.edu/); MIROVA (Middle InfraRed Observation of Volcanic Activity), a collaborative project between the Universities of Turin and Florence (Italy) supported by the Centre for Volcanic Risk of the Italian Civil Protection Department (URL: http://www.mirovaweb.it/).