Report on Piton de la Fournaise (France) — March 2018
Bulletin of the Global Volcanism Network, vol. 43, no. 3 (March 2018)
Managing Editor: Edward Venzke.
Edited by A. Elizabeth Crafford.
Piton de la Fournaise (France) Second eruption of 2017; July-August, fissure with flows on the SE flank
Please cite this report as:
Global Volcanism Program, 2018. Report on Piton de la Fournaise (France) (Crafford, A.E., and Venzke, E., eds.). Bulletin of the Global Volcanism Network, 43:3. Smithsonian Institution. https://doi.org/10.5479/si.GVP.BGVN201803-233020
Piton de la Fournaise
France
21.244°S, 55.708°E; summit elev. 2632 m
All times are local (unless otherwise noted)
Short pulses of intermittent eruptive activity have characterized Piton de la Fournaise, the large basaltic shield volcano on Reunion Island in the western Indian Ocean, for several thousand years. The most recent episode occurred during 31 January-27 February 2017 with an active vent located inside the Enclos caldera on the S flank, about 1 km SE of Château Fort and about 2.5 km ENE of Piton de Bert (BGVN 42:07). The next episode, discussed here, began on 14 July 2017 and lasted for about six weeks. Activity through February 2018 is covered in this report. Information is provided by the Observatoire Volcanologique du Piton de la Fournaise (OVPF) and satellite instruments.
A new fissure eruption began on 14 July 2017 on the S flank inside the caldera about 850 m W of Château Fort and lasted through 28 August. The fissure was initially 450 m long with seven active lava fountains. Within 48 hours the flow had reached its farthest extent, about 2.8 km from the fissure. Activity continued from the southernmost cone of the fissure with three active vents for a few weeks. Surface lava flows diminished, and activity was concentrated in lava tubes flowing SE from the cone with occasional breakouts and ephemeral vents along the flow field. The tremor signal briefly spiked with lava fountains on 16-17 August, and then ceased altogether on 28 August. A brief seismic swarm during 24 August-1 September led OVPF to conclude that magma had moved but did not open a new fissure. Inflation was intermittent through December, and then increased significantly during January before leveling off during February 2018.
Activity during June-July 2017. The brief seismic swarm of 17-18 May 2017 was followed by another brief increase in seismicity during the first few days of June 2017, but no surface eruption was reported. The inflation that occurred during the May event tapered off by early June. The volcano remained quiet until seismicity began increasing on 10 July 2017; this was accompanied by inflation recorded at the GPS stations as well. The observatory (OVPF) noted the beginning of seismic tremors, indicative of a new eruption, around 0050 on 14 July 2017. Webcams revealed that eruptive fissures opened on the S flank of the cone inside the Enclos caldera. A reconnaissance flight conducted later in the morning on 14 July indicated that the eruptive site was located 750 m SE of the Kala-Pele peak and 850 m W of Château Fort, about 2.2 km NE of Piton Bert (Figure 110).
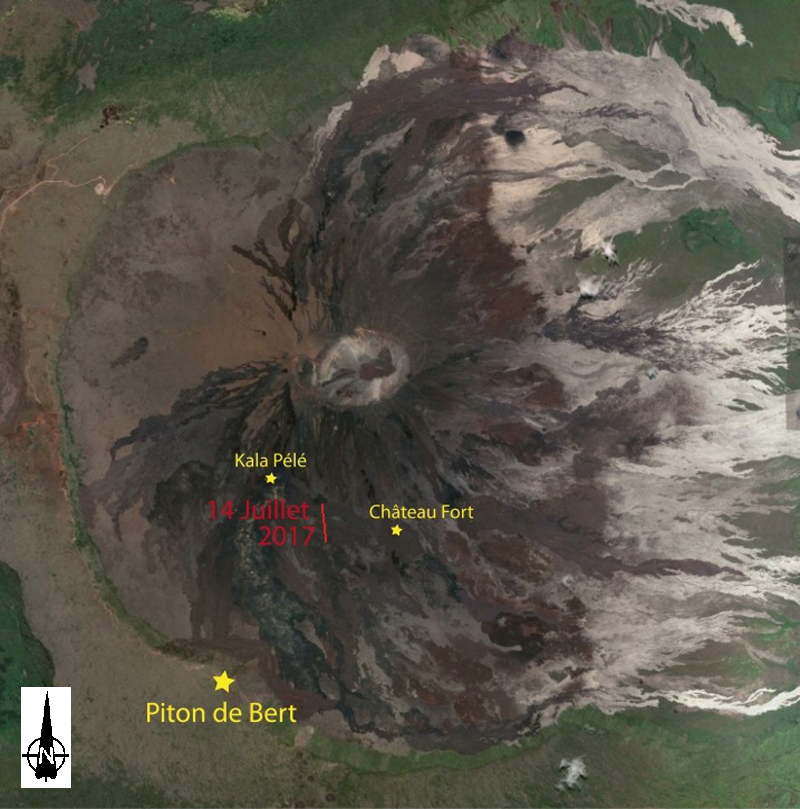 |
Figure 110. Location of the Piton de la Fournaise eruption that began on 14 July 2017. Courtesy of OVPF/IPGP (Bulletin d'activité du vendredi 14 juillet 2017 à 15h30 Heure locale). |
By 0930 that morning, the fissure extended over a total length of approximately 450 m. Seven lava fountains with a maximum height of 30 m were active (figure 111). The fountain farthest downstream began to build a cone with two arms of flowing lava. Satellite measurements indicated an initial flow rate of about 22-30 m3/s at the beginning of the eruption.
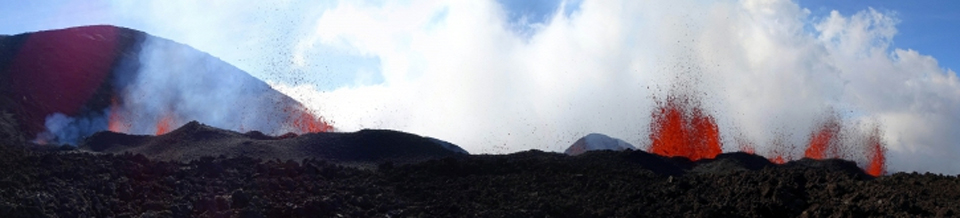 |
Figure 111. A new fissure opened on the S flank of the cone inside the Enclos caldera at Piton de la Fournaise on 14 July 2017. Courtesy of and copyright by OVPF/IPGP (Bulletin d'activité du vendredi 14 juillet 2017 à 15h30 Heure locale). |
The tremor intensity decreased significantly the following day; this was reflected in the decrease in the flow rates and the distribution of activity on the fissure. Only three lava fountains were active on 15 July 2017 near the downstream end of the fissure; they began to form two small cones with lava flows that merged into a single channel (figure 112). The fountains did not exceed 30 m in height. By 1400 on 15 July the flow front was 2.2 km SE from the fissure. Satellite instrument measurements suggested the flow rate had dropped to two m3/s. Sulfur dioxide anomalies were measured by the OMI satellite instrument during 14-16 July (figure 113).
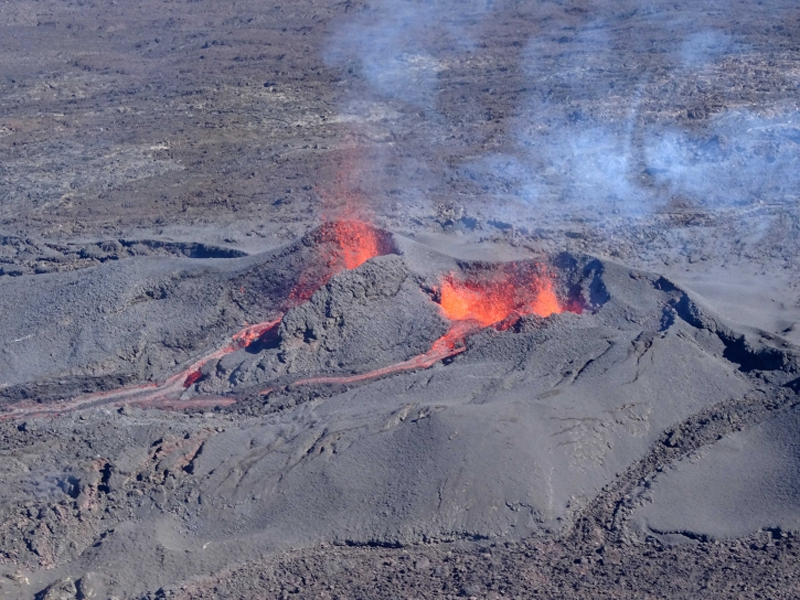 |
Figure 112. Lava emerged from two vents and merged into a single flow at the eruptive site at Piton de la Fournaise on 15 July 2017 at 1400 local time. Courtesy of and copyright by OVPF/IPGP (Bulletin d'activité du samedi 15 juillet 2017 à 16h30 Heure locale). |
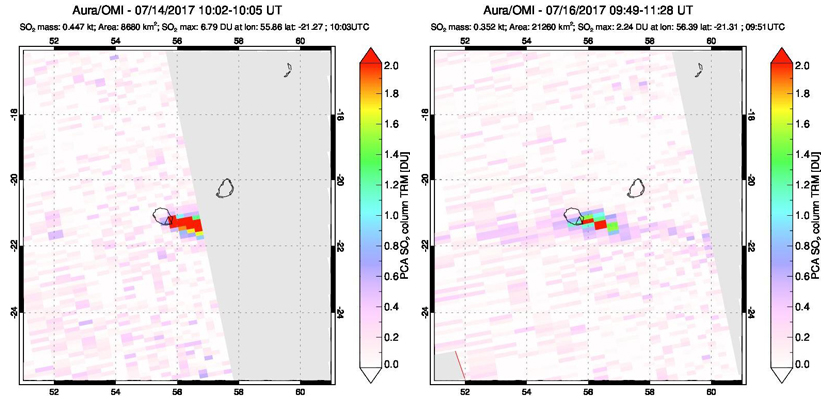 |
Figure 113. Sulfur dioxide anomalies were captured by the OMI instrument on the Aura satellite by NASA on 14 (left) and 16 (right) July 2017 at the beginning of the eruption at Piton de la Fournaise. Courtesy of NASA Goddard Space Flight Center. |
Tremors fluctuated over the next few days with changes related to the growth and collapse of various the cones along the fissure. On 18 July, there were six active fountains (figure 114). The flow rate remained approximately 1-3 m3/s. Fountains reached 20 m high on 19 July and a third vent was visible forming on the N side of the main cone. During an overflight on 21 July, OVPF noted that all three vents were active, but lava was only flowing SE from the central one (figure 115). Lava tubes had begun to form downstream of the cone, with numerous breakouts creating small lateral expansion arms.
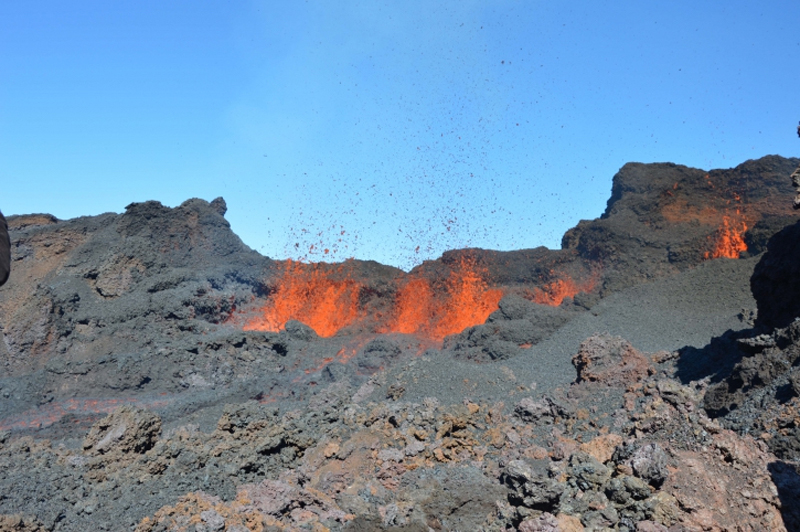 |
Figure 114. Six fountains were active along the fissure zone on 18 July 2017 at Piton de la Fournaise. Courtesy of and copyright by OVPF/IPGP (Bulletin d'activité du mardi 18 juillet 2017 à 16h00 Heure locale). |
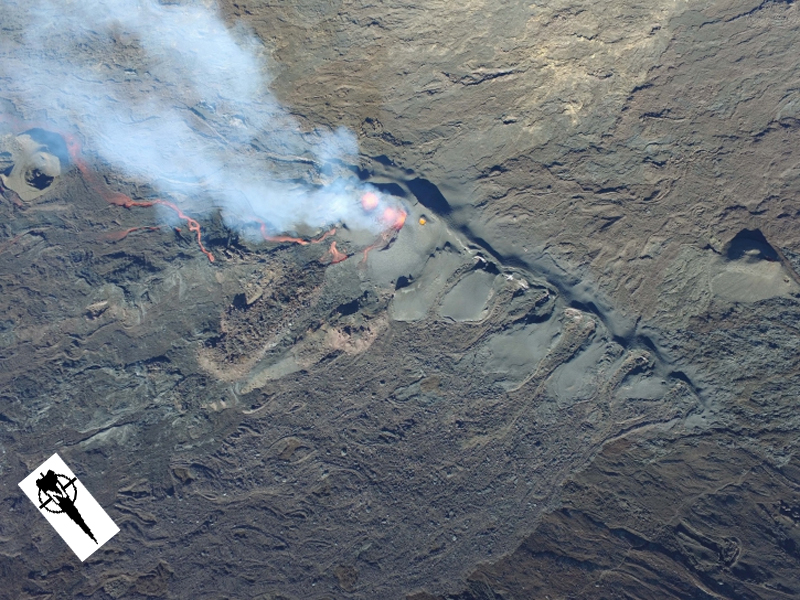 |
Figure 115. Lava flowed SE from the central vent of three in the fissure zone at Piton de la Fournaise on 21 July 2017. The magmatic gases are drifting SSE to the upper left of the image. Courtesy of and copyright by OVPF/IPGP (Bulletin d'activité du vendredi 21 juillet 2017 à 16h30 Heure locale). |
OVPF measured the flow dimensions on 22 July as 2.8 km long and 0.6 km wide (figure 116); the flow front had not advanced in the previous seven days. A fourth vent on the N side of the cone was periodically emitting ejecta, and two flows were active; one moving SE towards Château Fort and the other moving towards the SW inside a lava tube. On 24 July OVPF measured the flow rate as 1-4 m3/s, and the total volume of lava to date as 5.3 ± 1.9 million m3. On 25 July 2017, local observers reported that the main vent on the SE flank of the cone was visible, as well as a second vent on the N flank of the growing cone. The main lava channel was clearly visible downstream of the cone with frequent overflows (figure 117), and active flow continued inside the lava tubes.
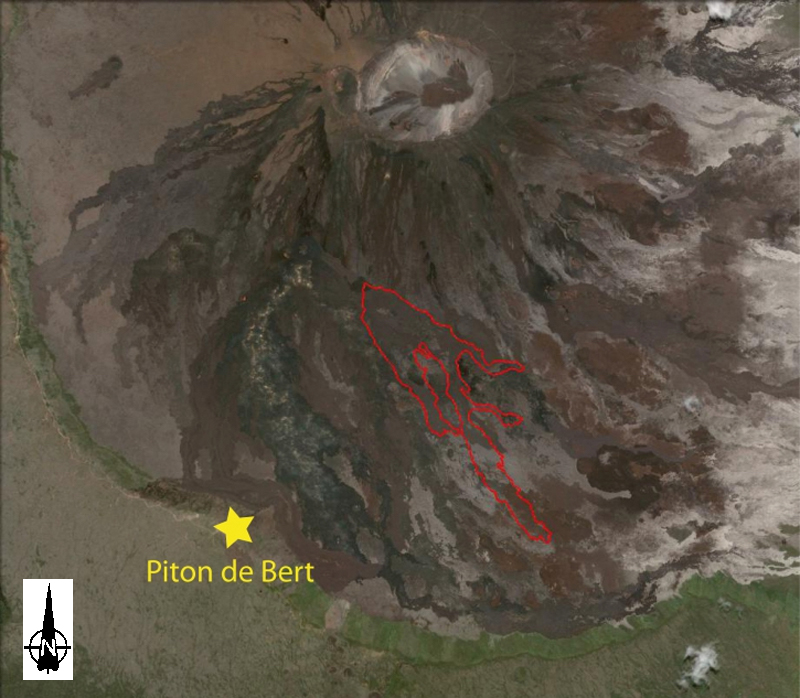 |
Figure 116. An outline of the active lava flow at Piton de la Fournainse on 22 July 2017. Base map courtesy of Google Earth. Annotations courtesy of and copyright by OVPF/IPGP (Bulletin d'activité du samedi 22 juillet 2017 à 17h00 Heure locale). |
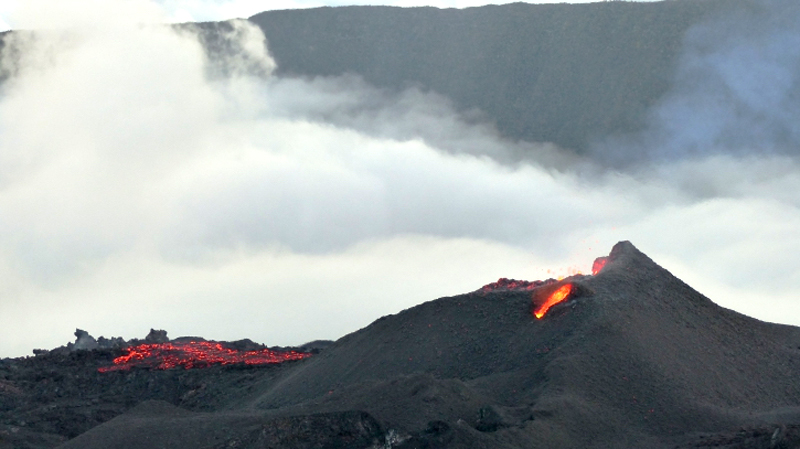 |
Figure 117. The main lava channel flowed SE from the eruptive vent at Piton de la Fournaise on 25 July 2017. Photo copyright by Cité du Volcan/Arthur Vaitilingom). Courtesy of OVPF/IPGP (Bulletin d'activité du mercredi 26 juillet 2017 à 16h00 Heure locale). |
By 30 July the flow intensity had decreased to about half of its original flow rate. The cone continued to grow, but no surface lava flows were observed (figure 118). The main vent rarely produced ejecta. Active lava was flowing in tunnels with a few minor breakouts near the cone. The flow front remained 2.8 km from the eruptive vent.
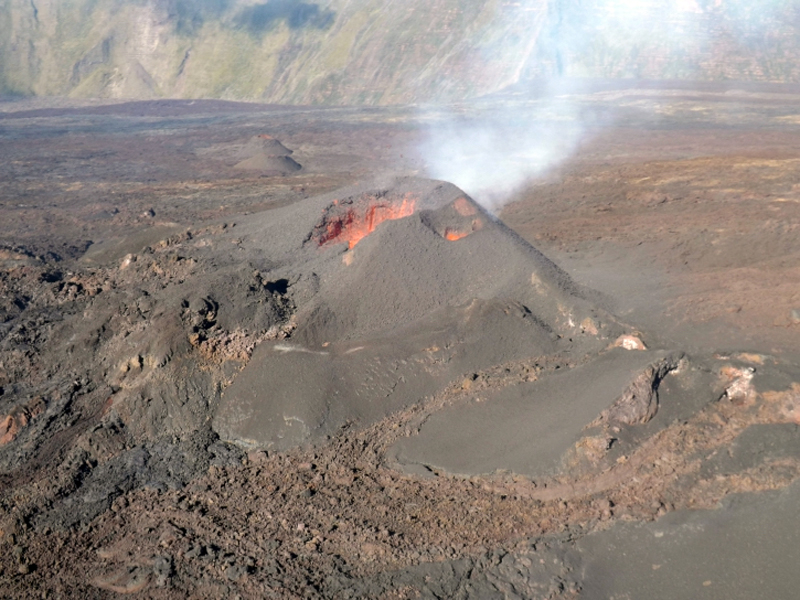 |
Figure 118. The eruptive vent of Piton de la Fournaise on 30 July 2017 showed no surface flows, but activity continued in lava tunnels. Courtesy of and copyright by OVPF/IPGP (Bulletin d'activité du dimanche 30 juillet 2017 à 16h00 Heure locale). |
Activity during August 2017-February 2018. The intensity of the tremors associated with the eruption continued to taper off into early August to levels below 20% of what they were at the beginning of the eruption, and this corresponded to a decrease in observed activity in the field. During an OVPF overflight on 2 August 2017 no flows or ejecta from the eruptive cone were seen, but a number of surface breakouts from lava tubes were still visible; the nearest to the cone was 520 m to the SE (figure 119). The main vent was completely blocked, but the smaller vent still had visible incandescence and strong degassing (figure 120).
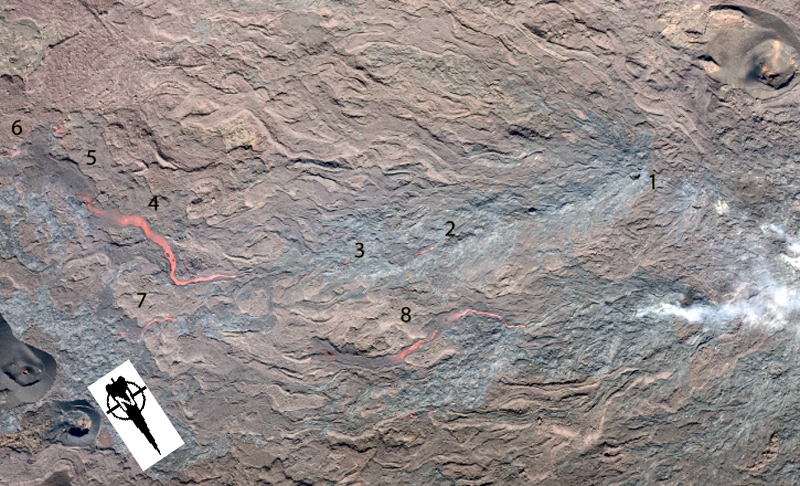 |
Figure 119. Lava tubes and small breakouts at Piton de la Fournaise on 2 August 2017 (N to the lower right). The breakouts were several hundred meters SE of the main vent. The eroded cone in the upper right is visible in the upper left of figure 115 showing the relative location compared with the main fissure. See also figure 121 for relative location. 1) A hornito formed from overpressure in an underlying lava tube. 2) A 20-m-long flow from a breakout over an active tunnel. 3) Two ephemeral vents had recently opened in the roof of the tunnel just prior to this photo being taken. 4-5-6) The longest breakout flow observed was 220 m long and began at an ephemeral vent located downstream of points 1, 2, and 3. The flow surface was 10 m wide near 4), spreading out and cooling farther downstream (5 and 6). Incandescent lava was still visible near the flow front (6) in two lobes. 7-8) Two other breakout flows from ephemeral vents 520 meters from the main vent were also visible, 50 and 180 m long, respectively. Courtesy of and copyright by OVPF/IPGP (Bulletin d'activité du mercredi 2 août 2017 à 16h30 Heure locale). |
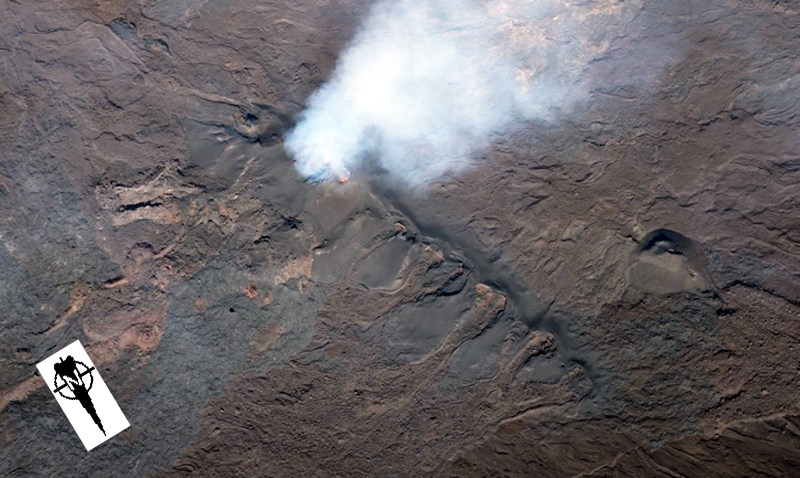 |
Figure 120. Visible incandescence and strong degassing were apparent from the smaller vent at the eruptive site on 2 August 2017 at Piton de la Fournaise. Courtesy of and copyright by OVPF/IPGP (Bulletin d'activité du mercredi 2 août 2017 à 16h30 Heure locale). |
Estimates of the flow rates during the first week of August were less than 1-2 m3/s, and the total lava volume emitted on the surface was measured at 7.2 ± 2.3 million m3. A larger breakout from a tunnel on 5 August was visible in the OVPF webcams and fed a surface flow over several hundred meters for several hours. By 6 August 2017 the activity was focused mainly in lava tunnels with a few surface breakouts, although incandescence was visible from the small vent seen in imagery available in Google Earth (figure 121). Small ejecta was observed during 7-9 August from the remaining active small vent on the N flank of the cone (figure 122).
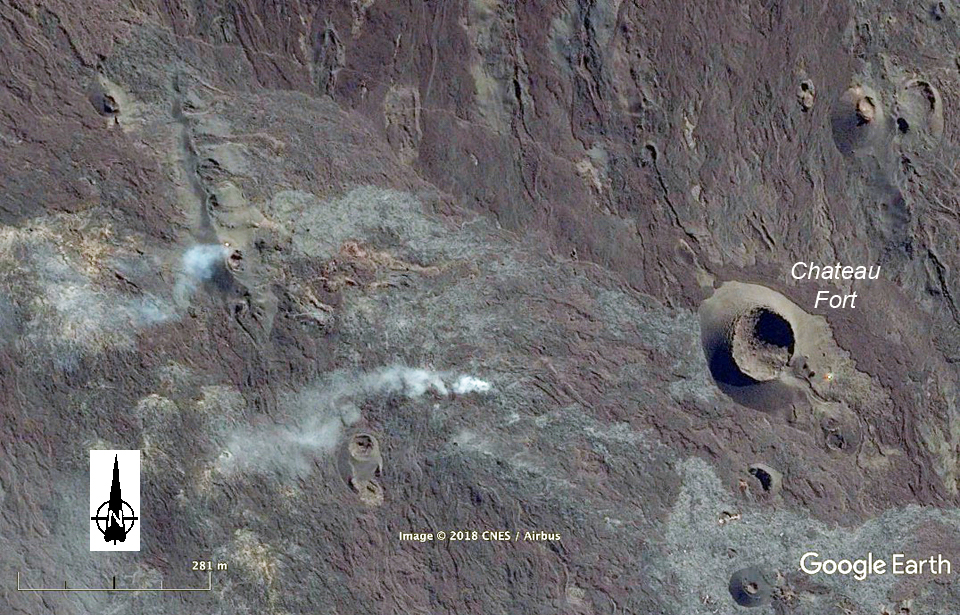 |
Figure 121. Imagery from Google Earth captured on 6 August 2017 showed incandescence and degassing from the small vent at the S end of the fissure at Piton de la Fournaise (left plume), as well as degassing from surface breakouts along the still active lava tunnels to the SE. Courtesy of Google Earth. |
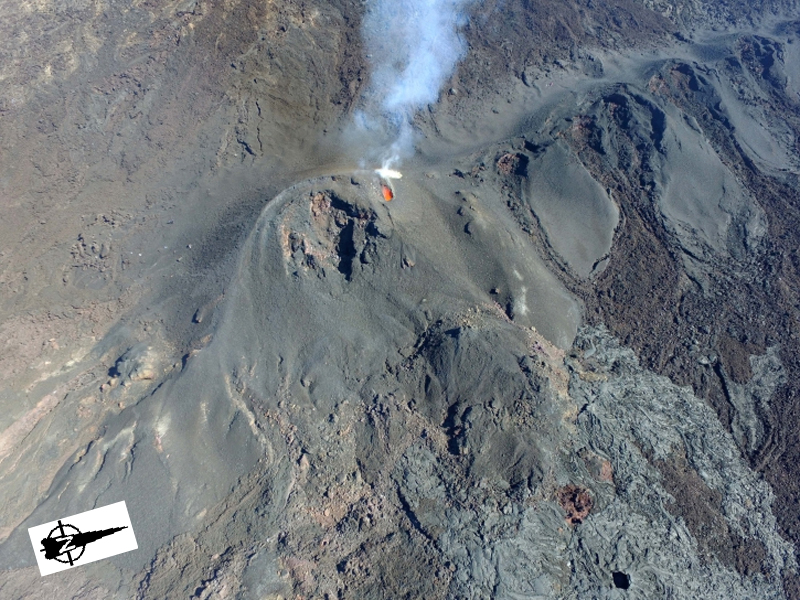 |
Figure 122. Only the small vent on the N side of the cone was still incandescent at Piton de la Fournaise on 9 August 2017. N is to the upper right. Courtesy of and copyright by OVPF/IPGP (Bulletin d'activité du mercredi 9 août 2017 à 17h00 Heure locale). |
Observations made on 14 August 2017 indicated lava was still active in tunnels as pahoehoe flows were observed about 2 km from the active vent. A brief increase in seismic and surface activity occurred on 16 August. The Piton de Bert webcam captured short-lived lava fountains at the E edge of the eruptive cone. Seismic tremor intensity increased rapidly and then oscillated during 16-17 August. The minor inflation of the cone that had been observed since 1 August ceased by 18 August. Field measurements on 21 August demonstrated a significant decrease in flow activity since 12 August. The volcanic tremor signal was stable at a low level on 25 August; it decreased significantly on 27 August and disappeared altogether about 0300 local time on 28 August 2017, leading OVPF to conclude the eruptive phase had ended.
A number of indications led OVPF to conclude that two migrations of magma that did not reach the surface occurred between 16 August and 1 September. Increased seismicity began on 16 August and was accompanied by a measured increase in SO2; satellite measurements showed two areas of inflation SE of the active fissure between 7 and 25 August. A seismic swarm in the same area was recorded during 24 and 25 August (figure 123). Overflights by OVPF on 25 August did not identify any new fissures associated with the seismic events and inflation.
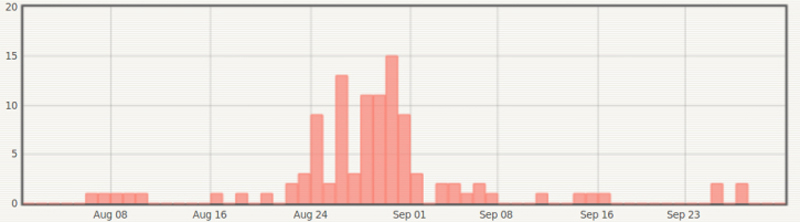 |
Figure 123. A seismic swarm on 24 and 25 August 2017 at Piton de la Fournaise led OVPF to conclude that magma was moving beneath the surface in an area SE of the active fissure zone. Courtesy of and copyright by OVPF/IPGP (Bulletin mensuel du lundi 2 octobre 2017). |
After the seismic swarm, the number of daily seismic events decreased to less than one per day by the end of September 2017. OVPF reported minor inflation during the second half of October along with a slight increase in seismicity. Inflation stabilized in November but increased again during January 2018 (figure 124). A gradual increase in shallow seismicity beneath the summit craters was recorded during the second half of February. It was accompanied by an increase in CO2 concentrations in the soil as well, which rose to some of the highest levels since measurements began in 2015.
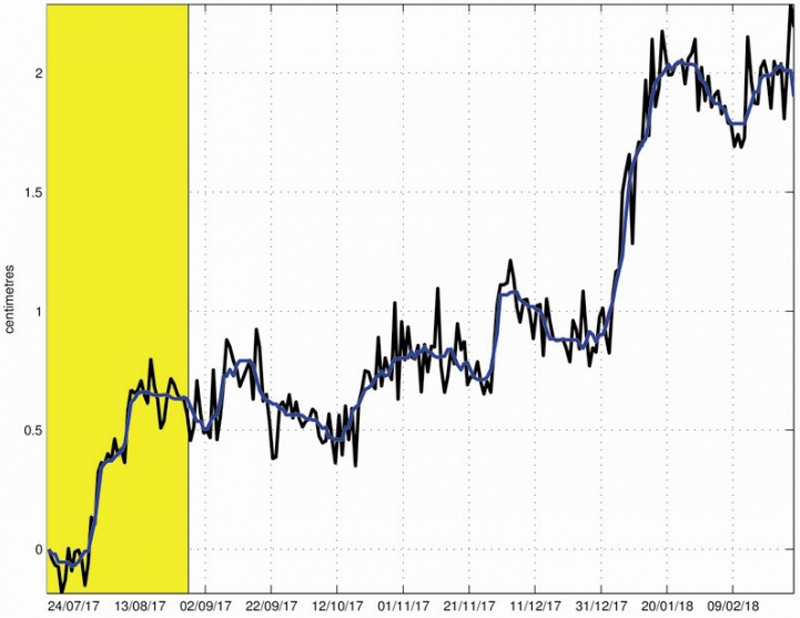 |
Figure 124. Deformation at Piton de la Fornaise from 14 July 2017 to 28 February 2018. The eruption of 14 July- 28 August 2017 is shown in yellow. The y-axis measures the change in length in centimeters of a N-S line crossing the Dolomieu crater between two GPS receivers. The raw data is shown in black and the blue line is the data smoothed over a week. A rise means elongation and therefore swelling of the volcano; conversely, a decrease indicates contraction and therefore deflation of the volcano. Courtesy of and copyright by OVPF/IPGP (Bulletin mensuel du jeudi 1 mars 2018). |
Thermal anomaly data. The MIROVA project thermal anomaly record shows both the episodic nature of the activity and the cooling signature of the flows that continued beyond 28 August 2017 when OVPF noted the cessation of tremors associated with eruptive activity (figure 125). The MODVOLC thermal alerts first appeared on 13 July 2017 and continued persistently with multiple daily alerts until 23 August 2017.
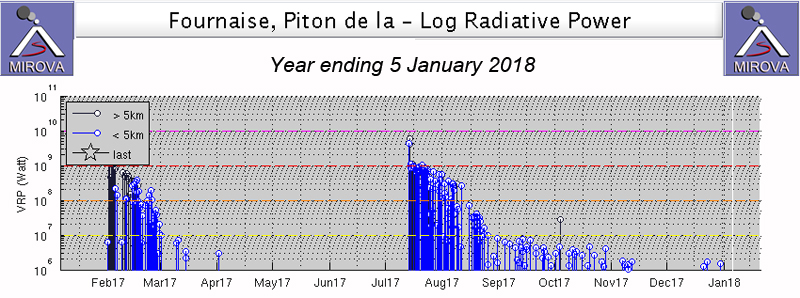 |
Figure 125. MIROVA thermal anomaly data for Piton de la Fournaise for the year ending 5 January 2018. The eruption of February 2017 had very little cooling after the tremors ceased at the end of February, but the July eruption had significant cooling evident for more than two months after the cessation of seismic tremors on 28 August 2017. Courtesy of MIROVA. |
Geological Summary. Piton de la Fournaise is a massive basaltic shield volcano on the French island of Réunion in the western Indian Ocean. Much of its more than 530,000-year history overlapped with eruptions of the deeply dissected Piton des Neiges shield volcano to the NW. Three scarps formed at about 250,000, 65,000, and less than 5,000 years ago by progressive eastward slumping, leaving caldera-sized embayments open to the E and SE. Numerous pyroclastic cones are present on the floor of the scarps and their outer flanks. Most recorded eruptions have originated from the summit and flanks of Dolomieu, a 400-m-high lava shield that has grown within the youngest scarp, which is about 9 km wide and about 13 km from the western wall to the ocean on the E side. More than 150 eruptions, most of which have produced fluid basaltic lava flows, have occurred since the 17th century. Only six eruptions, in 1708, 1774, 1776, 1800, 1977, and 1986, have originated from fissures outside the scarps.
Information Contacts: Observatoire Volcanologique du Piton de la Fournaise (OVPF), Institut de Physique du Globe de Paris, 14 route nationale 3, 27 ème km, 97418 La Plaine des Cafres, La Réunion, France (URL: http://www.ipgp.fr/fr); NASA Goddard Space Flight Center (NASA/GSFC), Global Sulfur Dioxide Monitoring Page, Atmospheric Chemistry and Dynamics Laboratory, 8800 Greenbelt Road, Goddard, Maryland, USA (URL: https://so2.gsfc.nasa.gov/); MIROVA (Middle InfraRed Observation of Volcanic Activity), a collaborative project between the Universities of Turin and Florence (Italy) supported by the Centre for Volcanic Risk of the Italian Civil Protection Department (URL: http://www.mirovaweb.it/); Hawai'i Institute of Geophysics and Planetology (HIGP) - MODVOLC Thermal Alerts System, School of Ocean and Earth Science and Technology (SOEST), Univ. of Hawai'i, 2525 Correa Road, Honolulu, HI 96822, USA (URL: http://modis.higp.hawaii.edu/).