Report on Heard (Australia) — October 2018
Bulletin of the Global Volcanism Network, vol. 43, no. 10 (October 2018)
Managing Editor: Edward Venzke.
Edited by A. Elizabeth Crafford.
Heard (Australia) Thermal hotspots persist at Mawson Peak, lava flows visible in satellite data November 2017-September 2018
Please cite this report as:
Global Volcanism Program, 2018. Report on Heard (Australia) (Crafford, A.E., and Venzke, E., eds.). Bulletin of the Global Volcanism Network, 43:10. Smithsonian Institution. https://doi.org/10.5479/si.GVP.BGVN201810-234010
Heard
Australia
53.106°S, 73.513°E; summit elev. 2745 m
All times are local (unless otherwise noted)
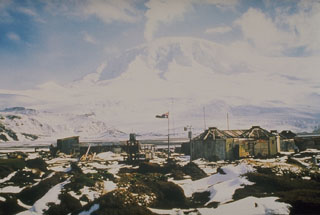
Remote Heard Island in the southern Indian Ocean is home to the snow-covered Big Ben stratovolcano, which has had confirmed intermittent activity since 1910. The nearest continental landmass, Antarctica, lies over 1,000 km S. Visual confirmation of lava flows on Heard are rare; thermal anomalies and hotspots detected by satellite-based instruments provide the most reliable information about eruptive activity. Thermal alerts reappeared in September 2012 after a four-year hiatus (BGVN 38:01), and have been intermittent since that time. Information comes from instruments on the European Space Agency's (ESA) Sentinel-2 satellite and MODVOLC and MIROVA thermal anomaly data from other satellite instruments. This report reviews evidence for eruptive activity from November 2017 through September 2018.
Satellite observations indicated intermittent hot spots at the summit through 12 December 2017. A few observations in January and February 2018 suggested steam plumes at the summit, but no significant thermal activity. An infrared pixel indicative of renewed thermal activity appeared again on 7 March, and similar observations were made at least twice each month in April and May. Activity increased significantly during June and remained elevated through September 2018 with multiple days of hotspot observations in satellite data each of those months, including images that indicated lava flowing in different directions from Mawson Peak. MODVOLC and MIROVA data also indicated increased thermal activity during June-September 2018.
Activity during October-December 2017. MIROVA thermal anomalies recorded during October 2017 indicated ongoing thermal activity at Heard (figure 32). This was confirmed by Sentinel-2 satellite imagery that revealed hotpots at the summit on ten different days in October (3, 6, 8, 13, 16, 21, 23, 26, 28, and 31), and included images suggesting lava flows descending from the summit in different directions on different days (figure 33).
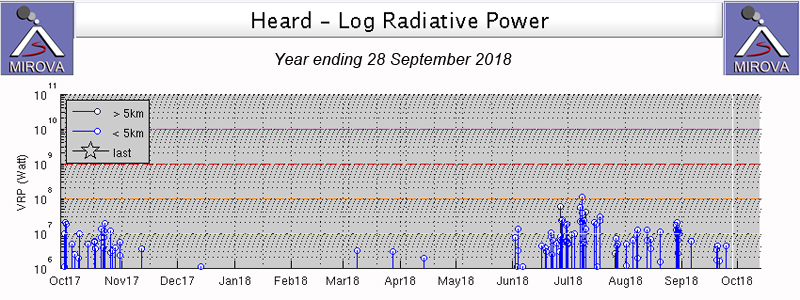 |
Figure 32. MODVOLC thermal alerts indicated significant thermal activity at Heard during October 2017 that tapered off during November. Intermittent signals appeared in December 2017, March, and April 2018, and a strong signal returned in June 2018 that continued through September. Courtesy of MIROVA. |
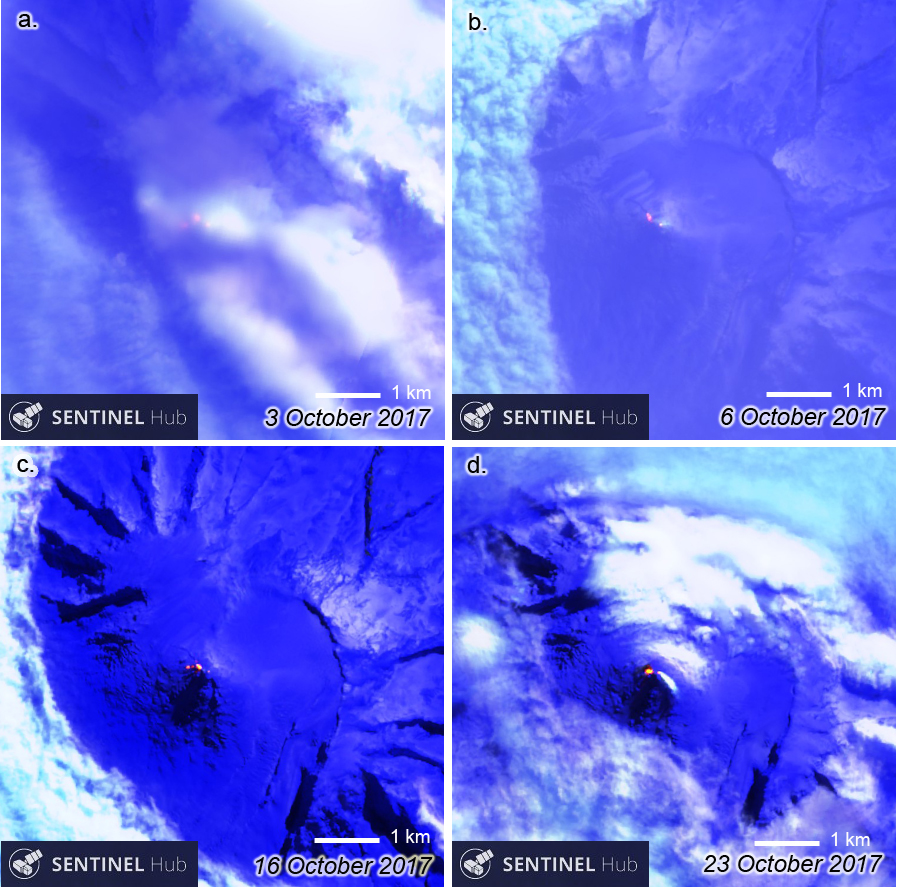 |
Figure 33. Sentinel-2 images of Heard Island's Big Ben volcano during October 2017 showed strong evidence of active effusive activity. a) 3 October 2017: at least three hot spots were visible through cloud cover at the summit and W of Mawson Peak, suggesting active lava flows. b) 6 October 2017: a small hot spot is visible at the peak with a small steam plume, and a larger hotspot to the NW suggested a still active lava flow. c) 16 October 2017: a small hotspot at the summit and larger hotspots W of the summit were indicative of ongoing flow activity. d) 23 October 2017: a steam plume drifted SE from a small summit hotspot and a larger hotspot to the W suggested a lava lake or active flow. Sentinel-2 images with Atmospheric Penetration view (bands 12, 11, and 8A), courtesy of Sentinel Hub Playground. |
The MODVOLC thermal alert data showed no further alerts for the year after 22 October 2017, and the MIROVA system anomalies tapered off in mid-November 2017. The Sentinel-2 satellite imagery, however, continued to record intermittent hotspots at and around Mawson Peak, the summit of Big Ben volcano, into December 2017 (figure 34). Hotspots were visible during six days in November (7, 15, 20, 25, 27, and 30) and three days during December (5, 7, and 12).
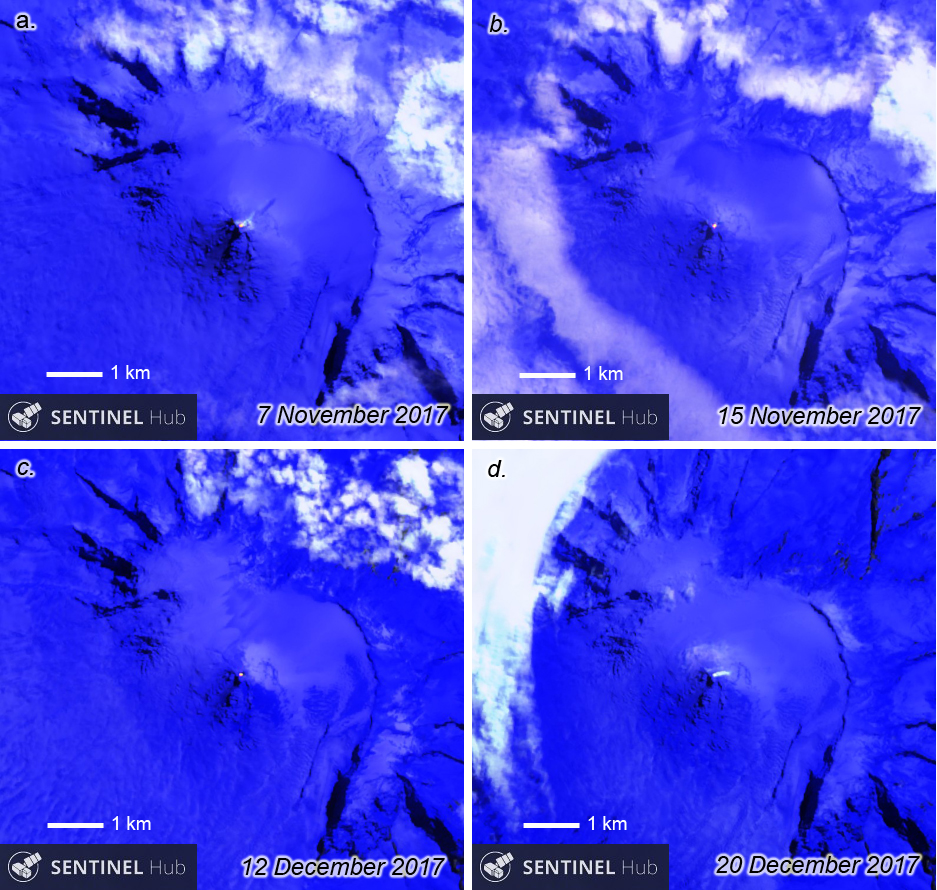 |
Figure 34. Sentinel-2 images of Heard Island's Big Ben volcano showed reduced but ongoing thermal activity during November and December 2017. a) 7 November 2017: a steam plume drifts NE from a hotspot at Mawson Peak. b and c) 15 November and 12 December 2017: a small hotspot is distinct at the summit. d) 20 December 2017: a steam plume drifts east from the peak, but no clear hotspot is visible. Sentinel-2 images with Atmospheric Penetration view (bands 12, 11, and 8A), courtesy of ESA Sentinel Hub Playground. |
Activity during January-May 2018. The satellite images during January and February 2018 were indicative of steam plumes at the summit, but distinct thermal signals reappeared on 7 and 12 March 2018 (figure 35). In spite of extensive cloud cover, the Sentinel-2 imagery also captured thermal signals twice each month in April (4 and 14) and May (9 and 14) (figure 36).
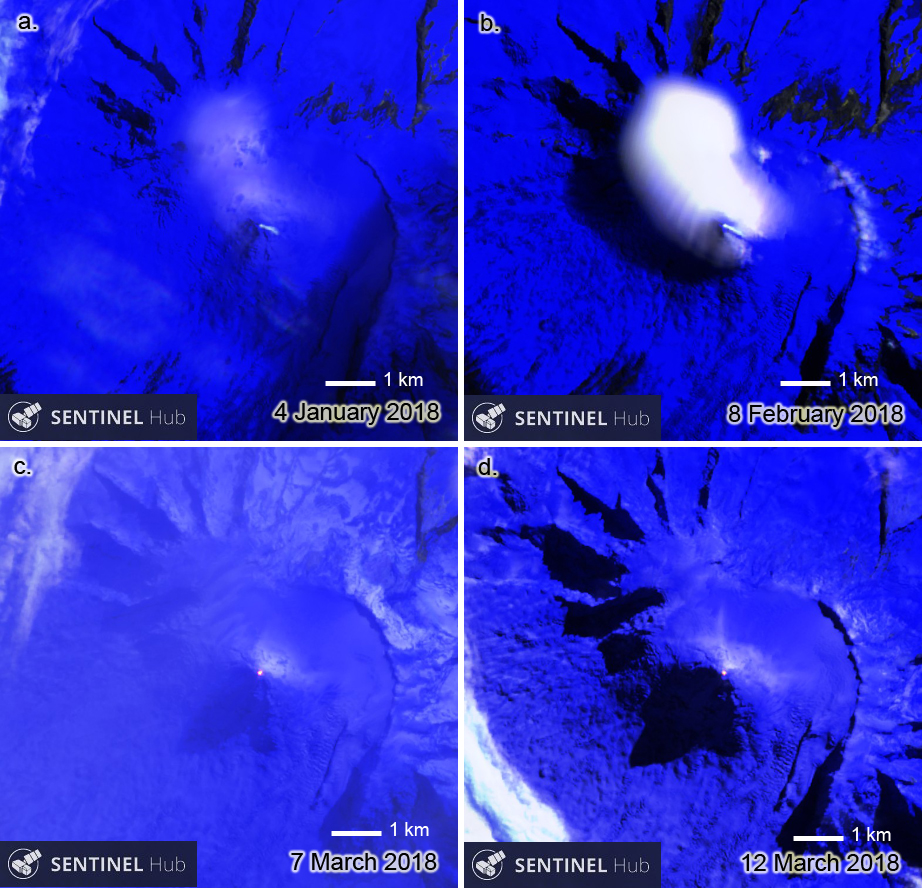 |
Figure 35. Sentinel-2 images of Heard Island's Big Ben volcano showed only steam plumes at the summit during January and February, but hotspots reappeared in March 2018. a) 4 January 2018: a steam plume drifts SE from the summit under clear skies. b) 8 February 2018: a steam plume drifts SE from the summit adjacent to a large cloud on the N side of the volcano. c) 7 March 2018: the first hotspot in about three months is visible at the summit. d) 12 March 2018: a distinct hotspot is visible at Mawson Peak. Sentinel-2 images with Atmospheric Penetration view (bands 12, 11, and 8A), courtesy of ESA Sentinel Hub Playground. |
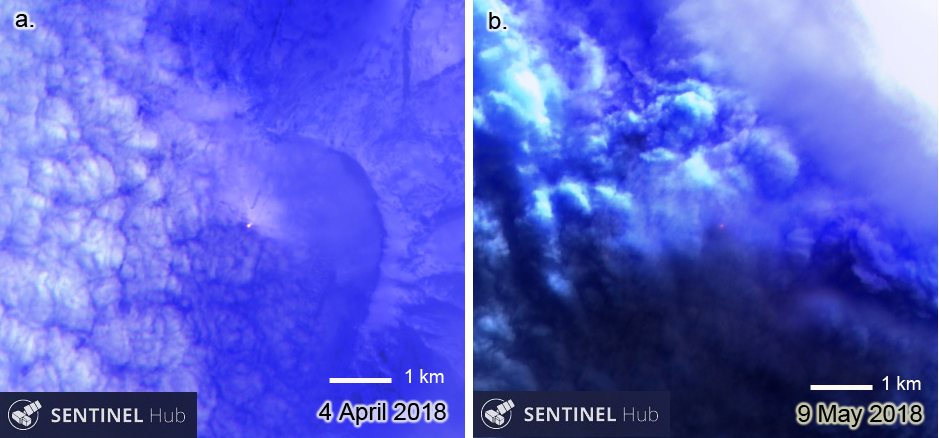 |
Figure 36. Sentinel-2 images of Heard Island's Big Ben volcano showed intermittent low-level thermal activity during April and May 2018. a) 4 April 2018: a small hotspot is visible at the summit through a hazy atmosphere. b) 9 May 2018: a distinct hotspot glows from the summit beneath cloud cover. Sentinel-2 images with Atmospheric Penetration view(bands 12, 11, and 8A), courtesy of ESA Sentinel Hub Playground. |
Activity during June-September 2018. Thermal signals increased significantly in the satellite data during June 2018. The sizes of the thermal anomalies were bigger, and they were visible at least nine days of the month (3, 5, 8, 10, 15, 18, 23, 25, and 30). Five substantial thermal signals appeared during July (3, 10, 15, 18, and 28); images on 23 June and 3 July distinctly show a lava flow trending NE from the summit (figure 37). MODVOLC thermal alerts appeared in June 2018 on three days (2, 26, and 27) and on four days during July (7, 8, 9, 10) indicating increased activity during this time. The MIROVA thermal signals also showed a substantial increase in early June that peaked in mid-July and remained steady through September 2018 (figure 32).
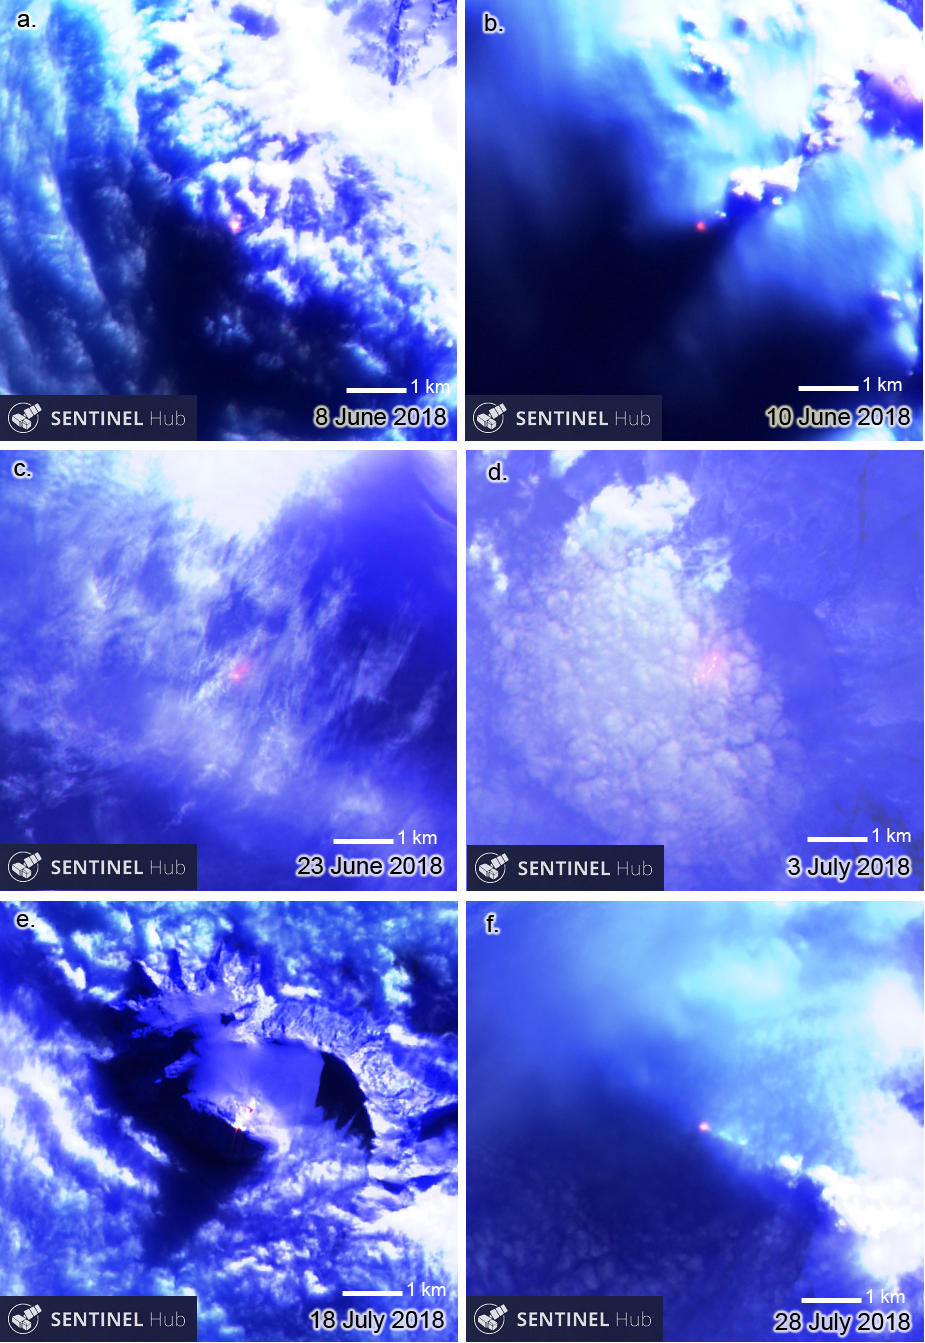 |
Figure 37. Sentinel-2 images of Heard Island's Big Ben volcano showed significantly increased thermal activity during June and July 2018. a) 8 June 2018: a substantial hotspot is visible through the cloud cover at the summit of Big Ben. b) 10 June 2018: the darker red hotspot at Mawson Peak was significantly larger than it was earlier in the year. c) 23 June 2018: the first multi-point hotspot since 31 October shows a distinct glow trending NE from the summit. d) 3 July 2018: a trail of hotspots defines a lava flow curving NNE from Mawson Peak. e) 18 July 2018: a second significant hotpot is visible a few hundred meters NE of the summit hotspot indicating a still active flow. f) 28 July 2018: the summit hotspot continued to glow brightly at the end of July, but no second hotspot was visible. Sentinel-2 images with Atmospheric Penetration view (bands 12, 11, and 8A), courtesy of ESA Sentinel Hub Playground. |
Six images in August (2, 7, 9, 22, 27, 29) showed evidence of active lava at the summit, and suggested flows both NE and SE from the summit that were long enough to cause multiple hotspots (figure 38). During September and early October 2018 the satellite images continued to show multiple hotspots that indicated flow activity tens of meters SE from the summit multiple days of each month (figure 39).
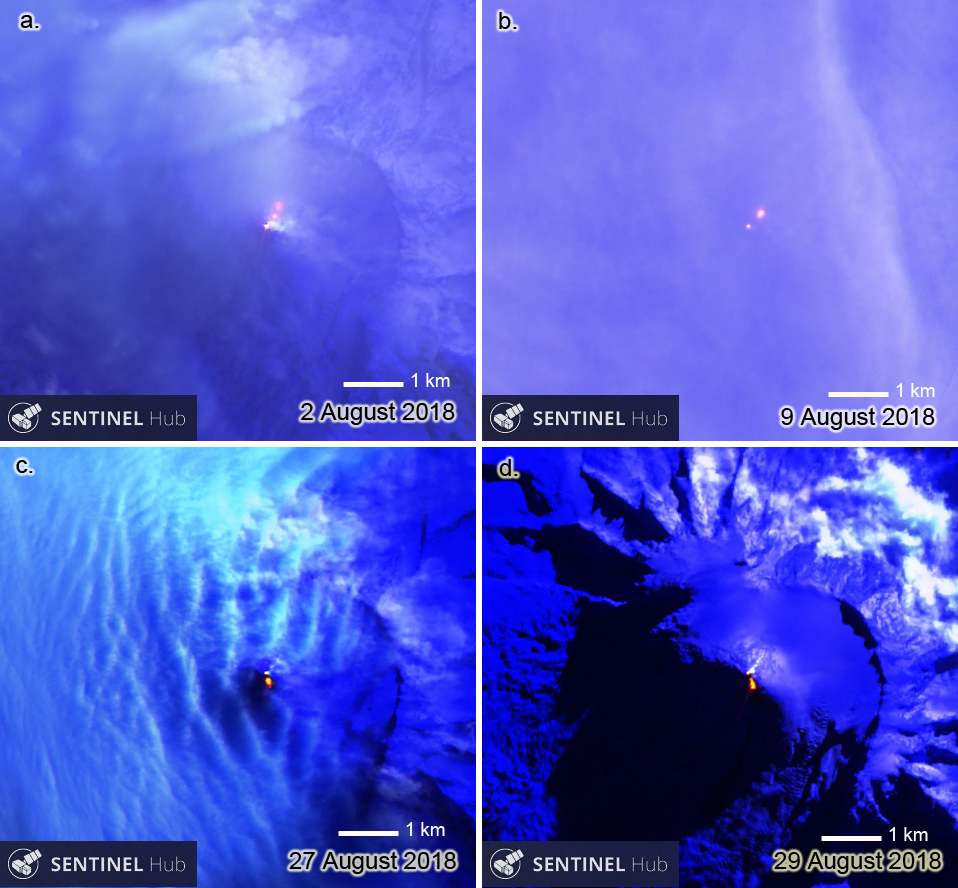 |
Figure 38. Sentinel-2 images of Heard Island's Big Ben volcano showed lava flow activity in two different directions from the summit during August 2018. a) 2 August 2018: lava flows NE from Mawson Peak while a steam plume drifts E from the summit. b) 9 August 2018: a second hotspot NE of the summit hotspot indicates continued flow activity in the same area observed on 2 August. c and d) 27 and 29 August 2018: a different secondary hotspot appeared SSE from the summit indicating a distinct flow event from the one recorded earlier in August. Sentinel-2 images with Atmospheric Penetration view (bands 12, 11, and 8A), courtesy of ESA Sentinel Hub Playground. |
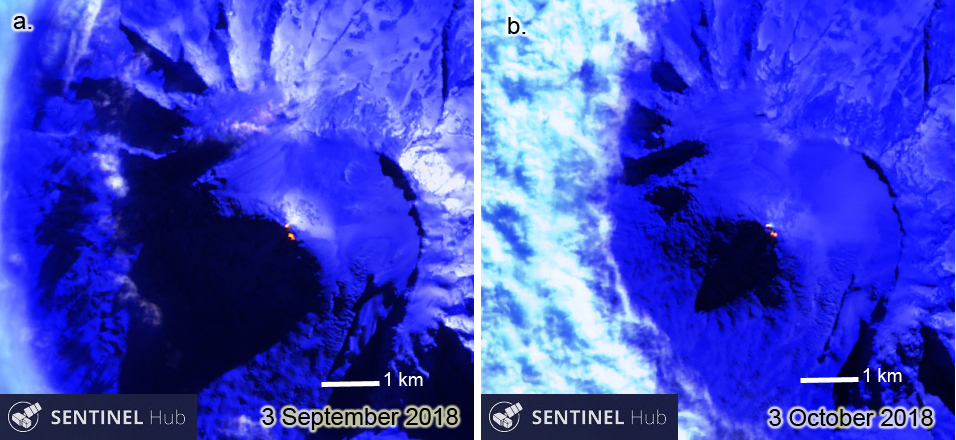 |
Figure 39. Sentinel-2 images of Heard Island's Big Ben volcano in September and October 2018 showed hotspots indicating active flows SE of the summit on multiple days. a) 3 September 2018: a small hotspot at the summit and a larger hotspot SE of the summit indicated continued flow activity. b) 3 October 2018: a small steam plume drifted east from a small hotspot at the summit and a larger pair of hotspots to the SE indicated continued effusive activity. Sentinel-2 images with Atmospheric Penetration view (bands 12, 11, and 8A), courtesy of ESA Sentinel Hub Playground. |
Geological Summary. Heard Island on the Kerguelen Plateau in the southern Indian Ocean consists primarily of the emergent portion of two volcanic structures. The large glacier-covered composite basaltic-to-trachytic cone of Big Ben comprises most of the island, and the smaller Mt. Dixon lies at the NW tip of the island across a narrow isthmus. Little is known about the structure of Big Ben because of its extensive ice cover. The active Mawson Peak forms the island's high point and lies within a 5-6 km wide caldera breached to the SW side of Big Ben. Small satellitic scoria cones are mostly located on the northern coast. Several subglacial eruptions have been reported at this isolated volcano, but observations are infrequent and additional activity may have occurred.
Information Contacts: Sentinel Hub Playground (URL: https://www.sentinel-hub.com/explore/sentinel-playground); Hawai'i Institute of Geophysics and Planetology (HIGP) - MODVOLC Thermal Alerts System, School of Ocean and Earth Science and Technology (SOEST), Univ. of Hawai'i, 2525 Correa Road, Honolulu, HI 96822, USA (URL: http://modis.higp.hawaii.edu/); MIROVA (Middle InfraRed Observation of Volcanic Activity), a collaborative project between the Universities of Turin and Florence (Italy) supported by the Centre for Volcanic Risk of the Italian Civil Protection Department (URL: http://www.mirovaweb.it/).