Report on Villarrica (Chile) — October 2018
Bulletin of the Global Volcanism Network, vol. 43, no. 10 (October 2018)
Managing Editor: Edward Venzke.
Edited by A. Elizabeth Crafford.
Villarrica (Chile) Thermal activity increases November-December 2017 and July-August 2018; intermittent incandescence and ash
Please cite this report as:
Global Volcanism Program, 2018. Report on Villarrica (Chile) (Crafford, A.E., and Venzke, E., eds.). Bulletin of the Global Volcanism Network, 43:10. Smithsonian Institution. https://doi.org/10.5479/si.GVP.BGVN201810-357120
Villarrica
Chile
39.42°S, 71.93°W; summit elev. 2847 m
All times are local (unless otherwise noted)
Historical eruptions at Chile's Villarrica, documented since 1558, have consisted largely of mild-to-moderate explosive activity with occasional lava effusion. An intermittently active lava lake at the summit has been the source of explosive activity, incandescence, and thermal anomalies for several decades. A large explosion on 3 March 2015 included a 9-km-altitude ash plume; significant thermal anomalies from intermittent Strombolian activity at the lava lake and small ash emissions have continued since that time. Sporadic but reduced activity during November 2017-August 2018 is covered in this report, with information provided primarily by the Southern Andes Volcano Observatory (Observatorio Volcanológico de Los Andes del Sur, OVDAS), part of Chile's National Service of Geology and Mining (Servicio Nacional de Geología y Minería, SERNAGEOMIN), and Projecto Observación Villarrica Internet (POVI), part of the Fundacion Volcanes de Chile, a research group that studies volcanoes across Chile.
Seismicity increased during the second half of November 2017, along with observations of increased incandescence at night from occasional explosions inside the summit crater. Satellite instruments measured a brief surge of thermal activity from late November through early December. The next episode of increased activity occurred in the second half of February 2018 with minor satellite thermal data and webcam views of incandescence. A slow but sustained increase in energy was recorded during March 2018; sporadic incandescence was reported a few times each month between March and May, but observations indicated that the lava lake level was over 100 m below the crater rim. Satellite and webcam observations of incandescence increased in frequency and intensity during June; sporadic ash emissions were noted during mid- and late July. Continuous incandescence was observed in webcams during August 2018; satellite thermal data identified an abrupt rise in thermal energy in late July that remained at a low level into early September 2018.
Activity during November 2017-January 2018. OVDAS reported that during November 2017, the webcams near the summit showed evidence of low-intensity, predominantly white degassing to low altitudes (100 m above the summit). Nighttime incandescence associated with occasional explosions inside the crater were typical. They also noted that long-period (LP) seismicity increased in both energy amplitude and frequency during the last few days of the month. A gradual increase in RSAM values began on 15 November with a continuous tremor signal. A magnitude 4.1 event occurred on 24 November located 2.6 km ESE of the summit at a depth of 1.8 km. A single MODVOLC thermal alert was reported on 28 November. According to POVI the lava lake on the crater floor subsided 8 m between 10 and 20 November (figure 54); during the second half of the month they documented 50-m-high lava fountains, spatter on the crater rim, incandescent jets, and fresh ashfall on the snow cover around the crater rim (figures 55 and 56).
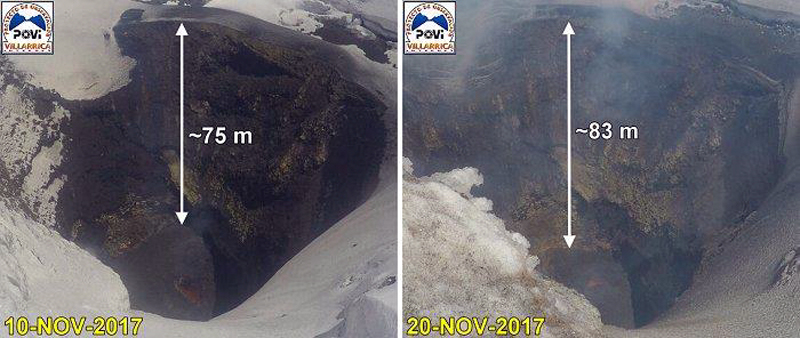 |
Figure 54. The SW part of the crater floor at Villarrica subsided about 8 m between 10 and 20 November 2017. Courtesy of POVI (Volcán Villarrica, Resumen Gráfico del Comportamiento, November 2017 a Febrero 2019). |
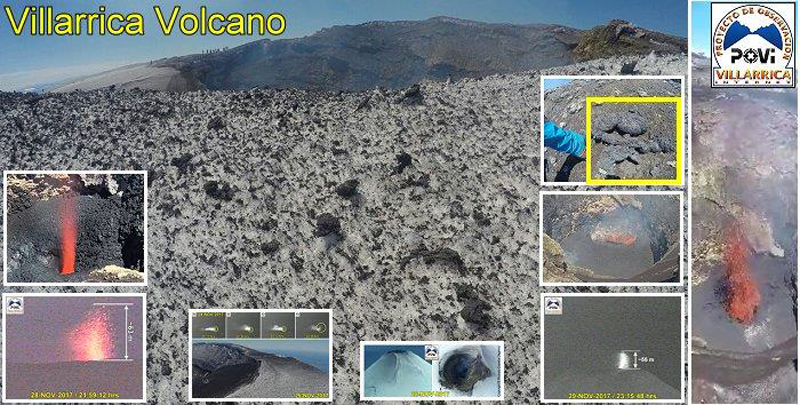 |
Figure 55. During the second half of November 2017, POVI documented 50 m high lava fountains, spatter on the crater rim, incandescent jets, and fresh ashfall on the snow cover around the crater rim at Villarrica. Courtesy of POVI (Volcán Villarrica, Resumen Gráfico del Comportamiento, November 2017 a Febrero 2019). |
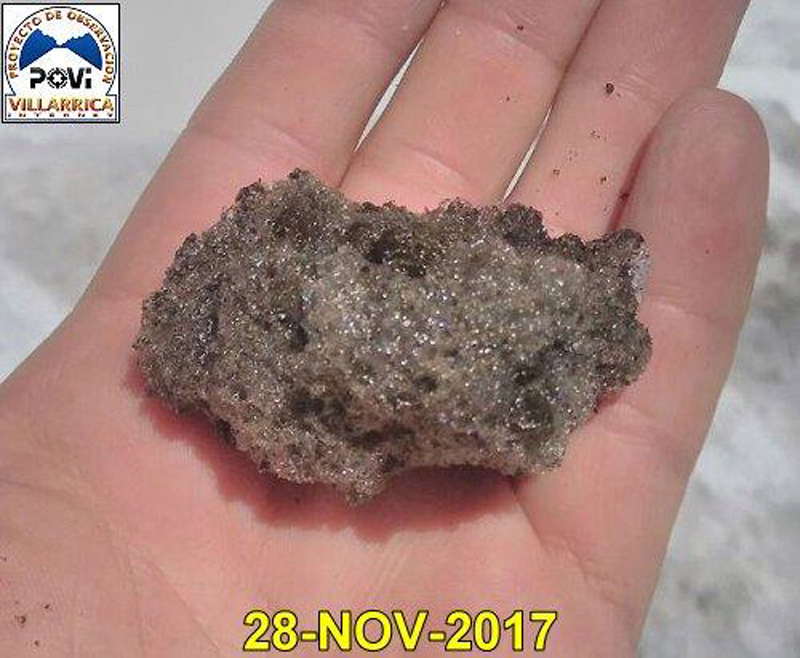 |
Figure 56. A sample of reticulite or basaltic pumice collected on 28 November 2017 from the summit of Villarrica. It is a highly vesiculated scoria, with greater than 98% porosity. Courtesy of POVI (Volcán Villarrica, Resumen Gráfico del Comportamiento, November 2017 a Febrero 2019). |
On 5 December 2017, SERNAGEOMIN raised the Alert Level at Villarrica from Green to Yellow (on a 4-level scale), noting a progressive increase in seismic and thermal energy since 15 November. They increased the restricted radius from 500 to 1,000 m from the summit crater. SERNAGEOMIN reported low-intensity degassing during the first half of December 2017, mostly white, and rising not more than 650 m above the crater. Incandescence was visible on clear nights, with occasional explosions that remained below the crater rim. They reported that increased surficial activity was visible during the first few days of December, followed by a decrease in activity (figure 57). POVI images at the end of December (figure 58) showed that the lake level had dropped more than 45 m between 5 and 27 December 2017. Seismicity also decreased throughout the month, reaching its lowest level of the year at the end of December.
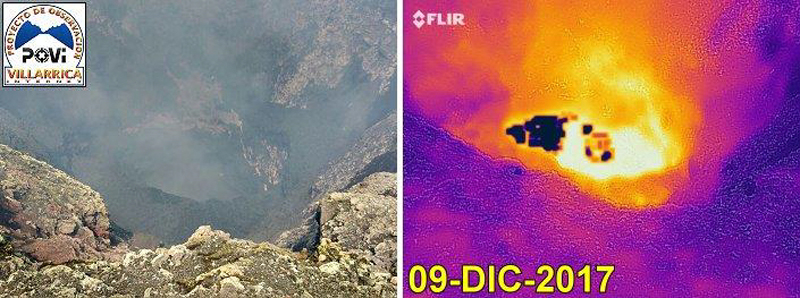 |
Figure 57. POVI reported that on 9 December 2017 at Villarrica the level of the lake at the bottom of the crater was stable at about 70 m below the rim, and five days had passed with no observations of lava ejecta in the webcams. Images by Víctor Marfull, courtesy of POVI (Volcán Villarrica, Resumen Gráfico del Comportamiento, November 2017 a Febrero 2019). |
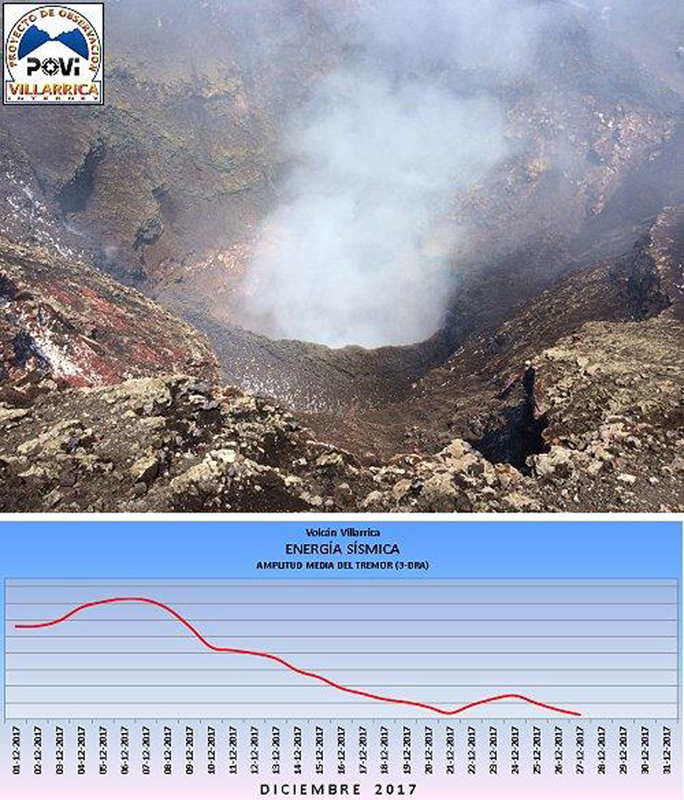 |
Figure 58. The lava lake at Villarrica subsided more than 45 m between 5 and 27 December 2017 when this image was taken. Seismic activity also decreased significantly throughout December, reaching its lowest level of the year. Courtesy of POVI (Volcán Villarrica, Resumen Gráfico del Comportamiento, November 2017 a Febrero 2019). |
On 6 January 2018 SERNAGEOMIN lowered the Alert Level to Green, noting a reduced thermal signal, low-level white degassing rising less than 300 m above the crater, and only occasional nighttime incandescence associated with explosions below the crater rim during the second half of December. POVI noted that the drop in seismicity at the end of December corresponded to the end of a 17-month-long period of increased seismicity (figure 59).
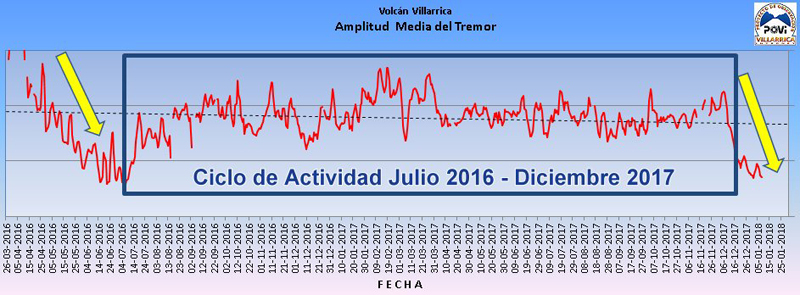 |
Figure 59. The drop in seismicity at the end of December 2017 suggested the end to a 17-month-long period of increased seismicity that began in July 2016 after a similar decrease in activity at the end of June 2016. Courtesy of POVI (Volcán Villarrica, Resumen Gráfico del Comportamiento, November 2017 a Febrero 2019). |
Activity during February-August 2018. Activity remained low at Villarrica during January 2018. Steam plumes rose less than 550 m above the crater and no thermal activity was apparent. After about six weeks of low activity, Sentinel-2 images indicated an increase in thermal activity between 5 and 18 February 2018 (figure 60). The Villarrica webcam also recorded incandescence at the summit for the first time in two months on 25 February 2018.
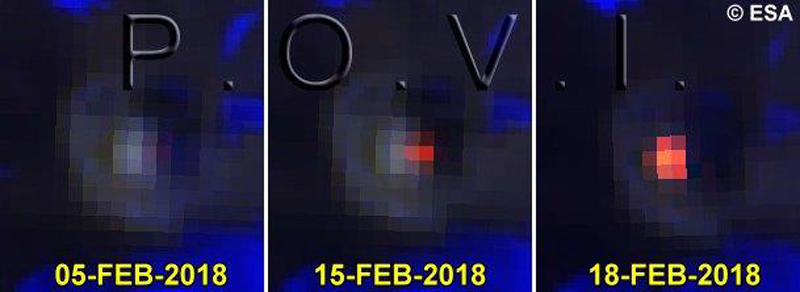 |
Figure 60. After about six weeks of low activity at Villarrica, Sentinel-2 images indicated an increase in thermal activity between 5 and 18 February 2018. Courtesy of POVI (Volcán Villarrica, Resumen Gráfico del Comportamiento, November 2017 a Febrero 2019). |
While SERNAGEOMIN reported only white degassing to less than 50 m above the summit in March 2018, POVI noted that seismic instruments recorded a slow but sustained increase in released energy. The lava lake was not visible and remained more than 110 m below the crater rim; a small spatter event was detected by a webcam on 7 March 2018 (figure 61). Sporadic incandescence, including on 13 and 20 March, was captured with a webcam located in Pucón, about 16 km N of the summit.
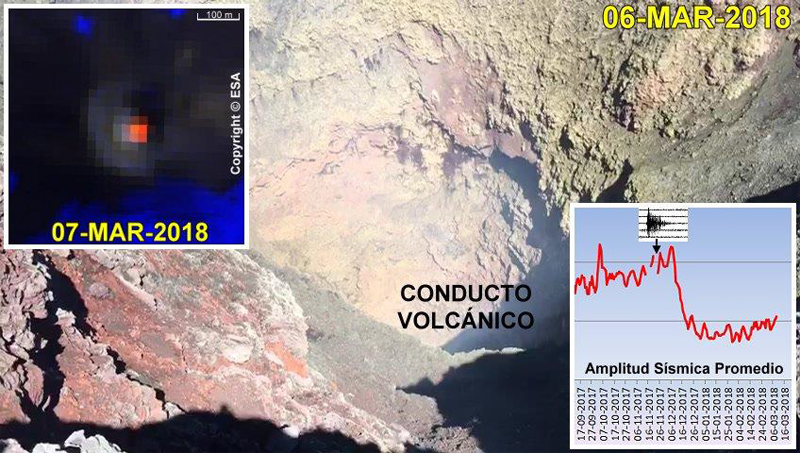 |
Figure 61. The surface of the lava lake at the summit of Villarrica remained more than 110 m below the crater rim on 6 March 2018. A small spatter of lava was detected by one of the POVI cameras on 7 March 2018, but little other activity was recorded. A slow but sustained increase in seismic energy was evident in the seismic amplitude data (inset). Courtesy of POVI (Volcán Villarrica, Resumen Gráfico del Comportamiento, November 2017 a Febrero 2019). |
A research effort in mid-March 2018 by Liu et al. (2019) to capture gas emissions close to the vent using Unmanned Aerial Systems (UAS) demonstrated good agreement between gas ratios obtained from simultaneous UAS- and ground-based multi-GAS acquisitions. The UAS measurements, however, taken from the young, less diluted gas plume revealed additional short-term patterns that reflected active degassing through discrete, audible gas exhalations (figures 62 and 63).
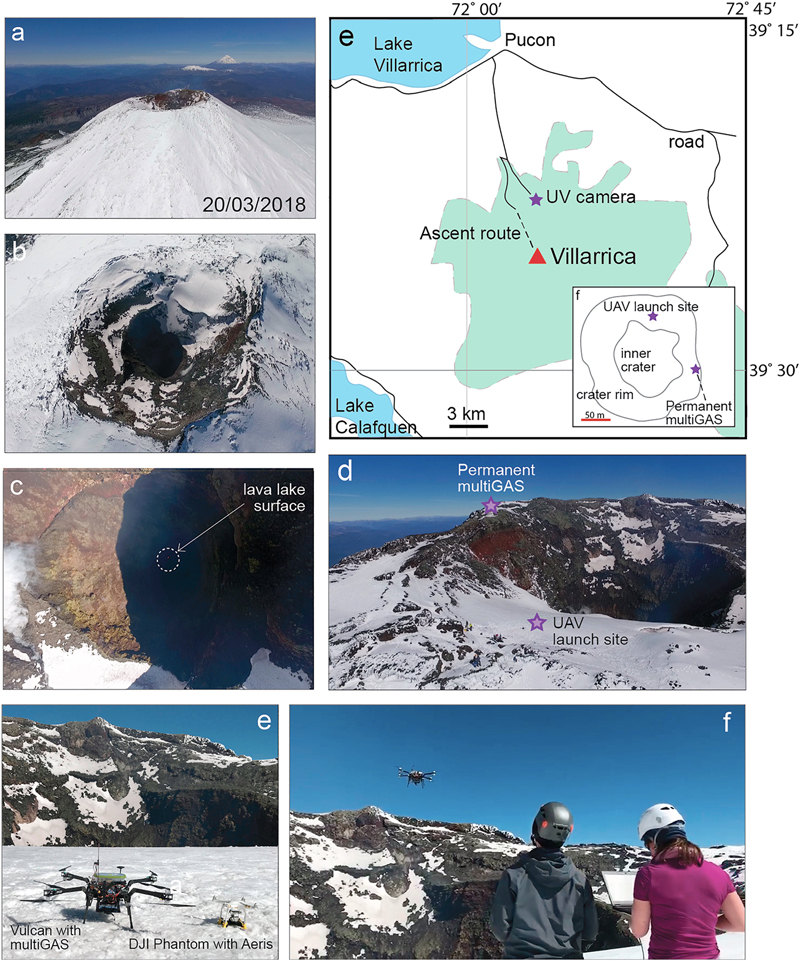 |
Figure 62. A research expedition to Villarrica on 20 and 21 March 2018 demonstrated the effectiveness of Unmanned Aerial Systems (UAS) in measuring gas emissions close to an active vent. a) This view to the SE shows Lanin and Quetrapillan volcanoes in the distance behind the summit of Villarrica. (b, c) The lava level was extremely low in the conduit during the measurement campaign, with the lake surface only visible as several pixels in aerial imagery. (d) Unmanned Aerial Systems (UAS) were launched from a sheltered plateau on the N rim of the crater, with the multi-GAS station visible on the eastern rim. (e, top right) Location map of the region, showing the position of UV camera. The green shaded region delimits the extent of the national park. Inset: Aerial map of the summit region shown in (d); the summit crater is ~200 m in diameter. (e, bottom left) Two instrumented multi-rotor vehicles were used in the campaign, the Vulcan octocopter with multi-GAS (left) and DJI Phantom 3 Pro with Aeris gas sensor (right). (f) Vulcan UAS in flight on 20 March 2018. UAV = Unmanned Aerial Vehicle. Taken from Figure 1 of Liu et al. (2019). |
 |
Figure 63. A comparison between contemporaneous proximal UAV and crater rim SO2 measurements at Villarrica. (a) The same-scaled axis highlights the magnitude of plume dilution between the proximal measurements from the UAV made directly above the conduit and those made at the crater rim only 100 m downwind. (b) When the time series are displayed on individually scaled axes it is apparent that even considering the temporal offset imposed by the downwind travel time, the periodic component of the proximal UAV trace is indistinguishable in the crater rim data. Taken from Figure 6 of Liu et al. (2019). |
A minor collapse of the crater wall caused a small plume of ash that rose a short distance above the summit on 29 March 2018. POVI's time-lapse webcams located in Pucón captured the event. Overnight on 1-2 April, sporadic incandescence was observed in the webcams and in Sentinel-2 satellite imagery. SERNAGEOMIN reported a single MIROVA alert signal on 13 April and an abrupt fall of the seismic signal on 27 April. The POVI webcam captured the brightest incandescence since mid-December 2017 on 3 May 2018. SERNAGEOMIN reported incandescence at the summit again on 23 May, and two thermal alerts on 22 and 25 May 2018.
While gas emissions remained less than 150 m above the summit during June 2018, observations of incandescence at night increased and were reported on 14, 18, 24, and 28 June, and were accompanied by satellite thermal signals on 14 and 24 June. Sporadic ash emissions that reached 400 m above the summit were reported by SERNAGEOMIN during July. The POVI webcam in Pucón captured an ash emission on 16 July 2018 that left ash and pyroclastic debris around the crater rim (figures 64 and 65). A second emission was recorded on 18 July;the Sentinel-2 satellite recorded the largest summit thermal signature since 10 December 2017 the same day.
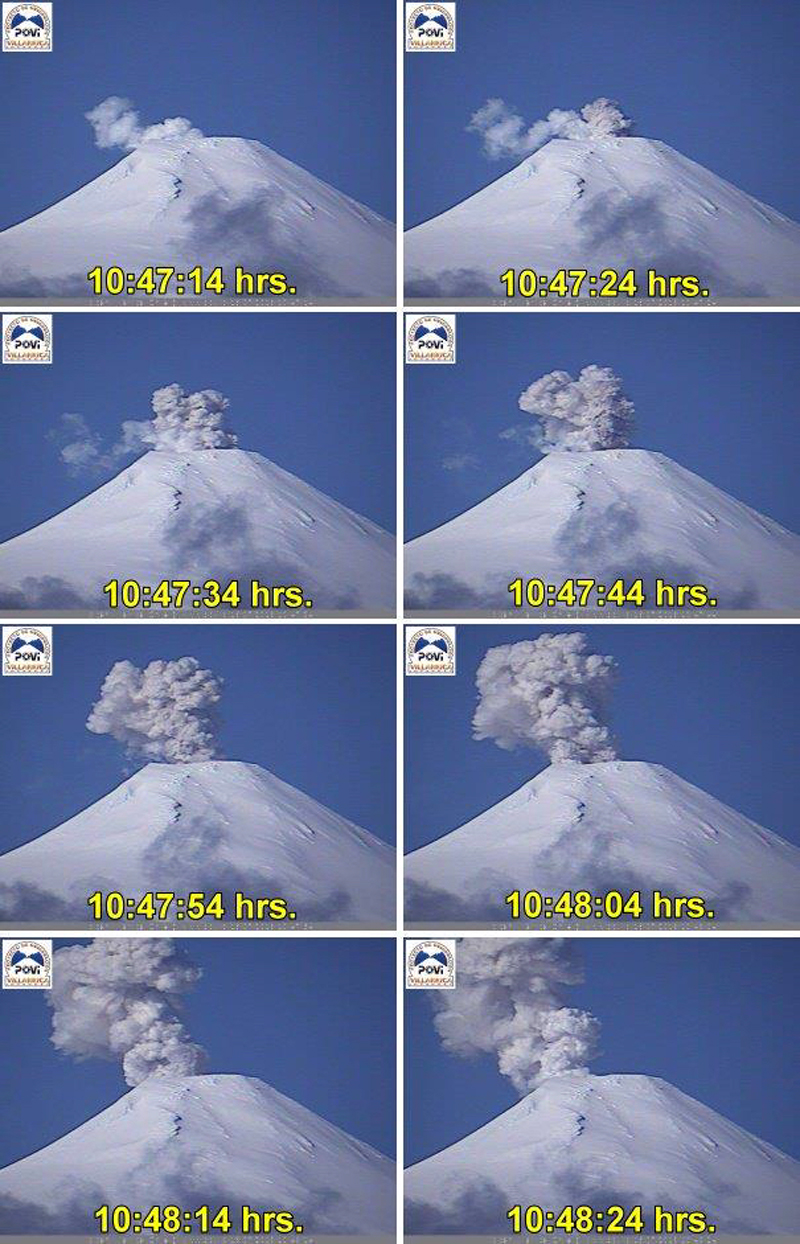 |
Figure 64. A steam and ash emission at Villarrica on 16 July 2018 was captured by the POVI webcam. Courtesy of POVI (Volcán Villarrica, Resumen Gráfico del Comportamiento, November 2017 a Febrero 2019). |
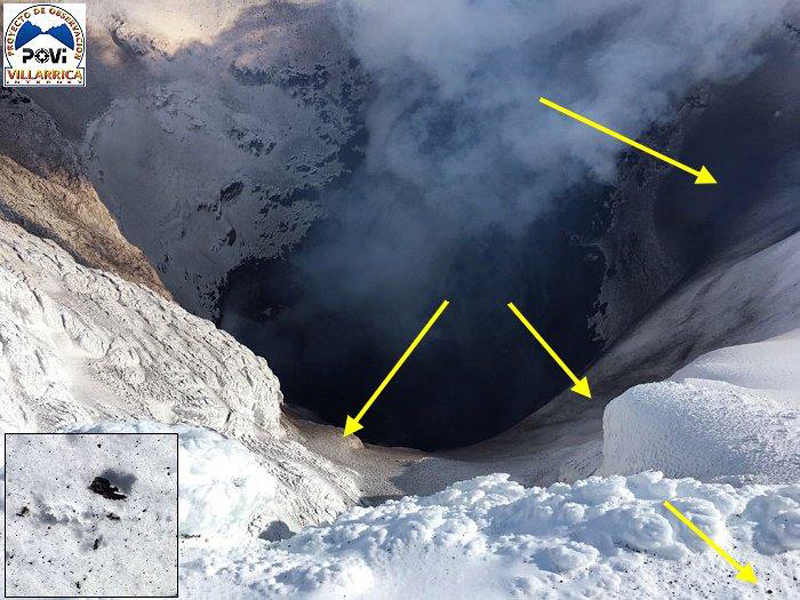 |
Figure 65. Ash and pyroclastic debris were deposited around the inside rim of the crater at Villarrica on 16 July 2018. Courtesy of POVI (Volcán Villarrica, Resumen Gráfico del Comportamiento, November 2017 a Febrero 2019). |
Activity continued to increase during July 2018; POVI photographed significant incandescence at the summit on 19 July and again on 25, 29, and 30 July after a period of cloudy weather. ESA's Sentinel-2 camera measured the largest heat area on the summit since August 2015 on 30 July (figure 66). As a result, the interior of the crater lost much of its snow cover and ice (figure 67). Ash and lapilli were visible in satellite imagery on the eastern edges of the crater.
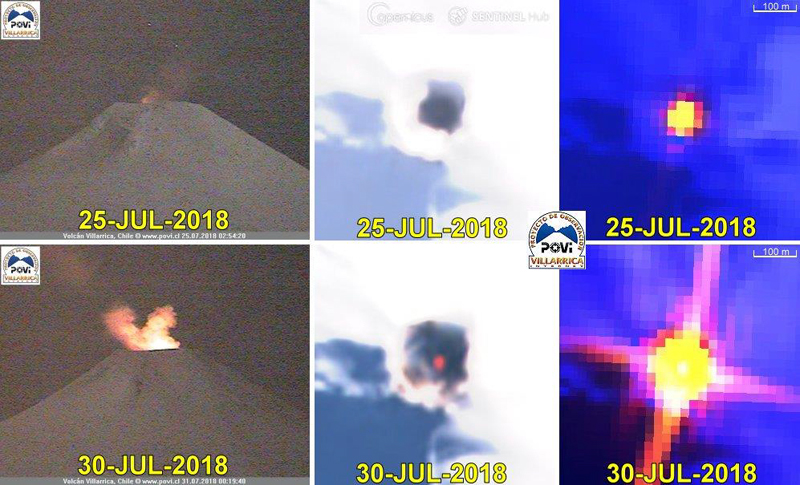 |
Figure 66. On July 30 2018 ESA's Copernicus program satellite, Sentinel-2, measured the largest heat area on the summit of Villarrica since August 2015. Due to the heat, the interior of the crater had lost much of its snow cover and ice. Ash and lapilli stand out on the eastern edges of the crater. Left: terrestrial images (objective 120 mm, 0.0001 lux), center: Sentinel-2, filters bands 8, 4 and 3; Right: Sentinel-2, filters bands 12, 11 and 4. Courtesy of POVI (Volcán Villarrica, Resumen Gráfico del Comportamiento, November 2017 a Febrero 2019). |
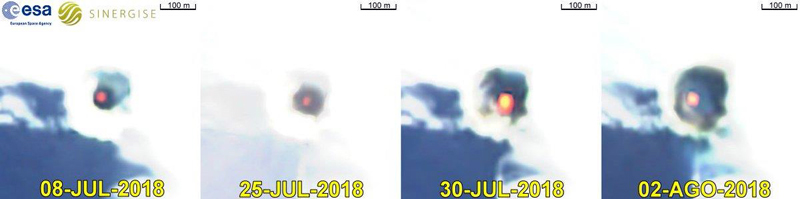 |
Figure 67. Sequential images of the Sentinel-2 satellite (ESA), with filters of bands 8, 4, and 3, illustrate the evolution of the heat surface emitted by the lava pit, and the decrease in snow and ice within and around the crater rim between 8 July and 2 August 2018. Courtesy of POVI (Volcán Villarrica, Resumen Gráfico del Comportamiento, November 2017 a Febrero 2019). |
SERNAGEOMIN reported continuous incandescence at the summit during August nights when the weather was clear. POVI noted on 31 August 2018 that the lake level had not changed during the month and was about 75 m below the inner W rim of the crater. The lake level remained unchanged during the first 10 days of September 2018 as well (figure 68).
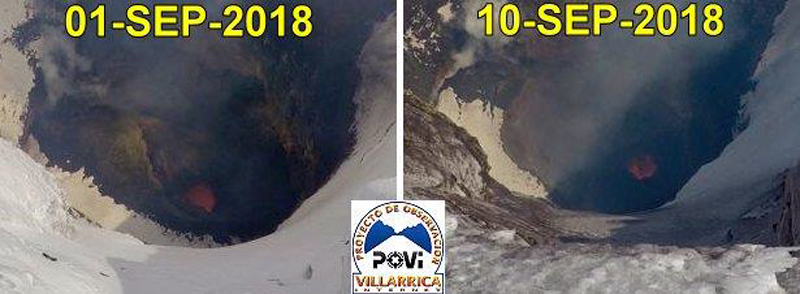 |
Figure 68. The lava lake level at the bottom of the summit crater of Villarrica was unchanged during the first 10 days of September 2018. Courtesy of POVI (Volcán Villarrica, Resumen Gráfico del Comportamiento, November 2017 a Febrero 2019). |
The thermal signature in the MIROVA graph for the period from October 2017 through August 2018 showed two clear increases in thermal energy between late November and mid-December 2017, and again from mid-June through August 2018 (figure 69). These corresponded well with MODVOLC thermal alert data which recorded one alert on 28 November 2017, 10 alerts during 2-11 December 2017, and five alerts between 30 July and 2 August 2018.
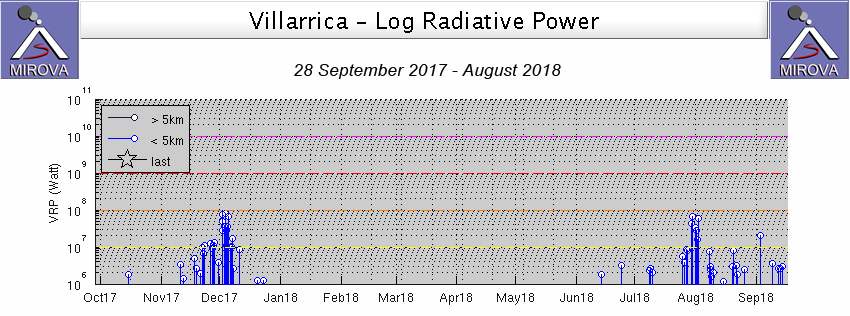 |
Figure 69. MIROVA thermal anomaly graph of log radiative power at Villarrica from 28 September 2017 through August 2018 shows two clear increases in activity, one in mid-November through mid-December 2017 and a second longer-lived phase that began in June 2018, peaked in late July-early August, and remained steady throughout the month of August. Courtesy of MIROVA. |
Reference: Liu, E. J., Wood, K., Mason, E., Edmonds, M., Aiuppa, A., Giudice, G., Bitetto, M., Francofonte, V., Burrow, S., Richardson, T., Watson, M., Pering, T.D., Wilkes, T.C., McGonigle, A.J.S., Velasquez, G., Melgarejo, C., and Bucarey, C., 2019. Dynamics of outgassing and plume transport revealed by proximal unmanned aerial system (UAS) measurements at Volcán Villarrica, Chile. Geochemistry, Geophysics, Geosystems, 20. https://doi.org/10.1029/2018GC007692
Geological Summary. The glacier-covered Villarrica stratovolcano, in the northern Lakes District of central Chile, is ~15 km south of the city of Pucon. A 2-km-wide caldera that formed about 3,500 years ago is located at the base of the presently active, dominantly basaltic to basaltic andesite cone at the NW margin of a 6-km-wide Pleistocene caldera. More than 30 scoria cones and fissure vents are present on the flanks. Plinian eruptions and pyroclastic flows that have extended up to 20 km from the volcano were produced during the Holocene. Lava flows up to 18 km long have issued from summit and flank vents. Eruptions documented since 1558 CE have consisted largely of mild-to-moderate explosive activity with occasional lava effusion. Glaciers cover 40 km2 of the volcano, and lahars have damaged towns on its flanks.
Information Contacts: Servicio Nacional de Geología y Minería (SERNAGEOMIN), Observatorio Volcanológico de Los Andes del Sur (OVDAS), Avda Sta María No. 0104, Santiago, Chile (URL: http://www.sernageomin.cl/); Proyecto Observación Villarrica Internet (POVI) (URL: http://www.povi.cl/); MIROVA (Middle InfraRed Observation of Volcanic Activity), a collaborative project between the Universities of Turin and Florence (Italy) supported by the Centre for Volcanic Risk of the Italian Civil Protection Department (URL: http://www.mirovaweb.it/); Hawai'i Institute of Geophysics and Planetology (HIGP) - MODVOLC Thermal Alerts System, School of Ocean and Earth Science and Technology (SOEST), Univ. of Hawai'i, 2525 Correa Road, Honolulu, HI 96822, USA (URL: http://modis.higp.hawaii.edu/).