Etna
Italy
37.748°N, 14.999°E; summit elev. 3357 m
All times are local (unless otherwise noted)
Italy's Mount Etna on the island of Sicily has had historically recorded eruptions for the past 3,500 years and has been erupting continuously since September 2013 through at least March 2019. Lava flows, explosive eruptions with ash plumes, and Strombolian lava fountains commonly occur from its summit areas that include the Northeast Crater (NEC), the Voragine-Bocca Nuova (or Central) complex (VOR-BN), the Southeast Crater (SEC, formed in 1978), and the New Southeast Crater (NSEC, formed in 2011). A new crater, referred to as the "cono della sella" (saddle cone), emerged during early 2017 in the area between SEC and NSEC and has become the highest part of the SEC-NSEC complex. After several months of low-level activity in early 2018, increases in Strombolian activity at several vents began in mid-July (BGVN 43:08). This was followed by new lava flows emerging from the saddle cone and the E vent of the NSEC complex in late August and discontinuous Strombolian activity and intermittent ash emissions through November 2018 (BGVN 43:12). An eruption from a new fissure produced a lava flow into the Valle del Bove in late December 2018 and is covered in this report along with activity through March 2019 that included frequent ash emissions. Information is provided primarily by the Osservatorio Etneo (OE), part of the Catania Branch of Italy's Istituo Nazionale di Geofisica e Vulcanologica (INGV).
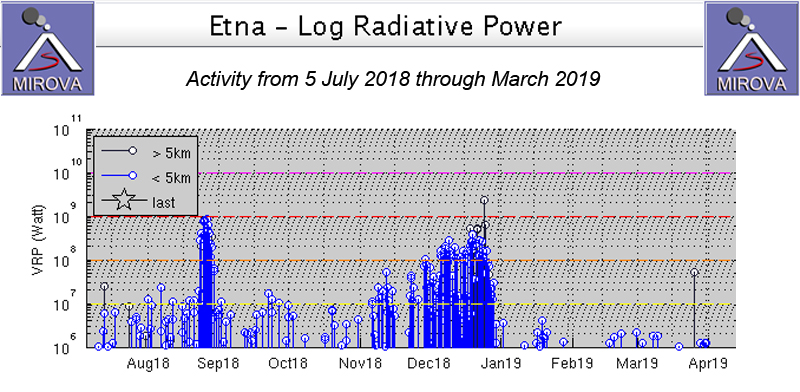
For the first three weeks of December 2018, Strombolian activity and ash emissions continued from the summit vents. A series of small flows from multiple vents near the scoria cone inside NSEC formed a small flow field on the E flank mid-month. A lateral eruption from a fissure on the SE flank of NSEC opened on 24 December and produced a series of flows that traveled E into the Valle del Bove for three days. Sporadic ash emissions, some with dense plumes and significant SO2 emissions, were typical throughout January and February 2019. Activity declined significantly during March 2019 to minor ash emissions and ongoing outgassing from the summit vents. The MIROVA plot of thermal energy recorded the increased heat from the lava flows during December 2018, along with minor pulses from the ash emissions and Strombolian activity in January and February (figure 240).
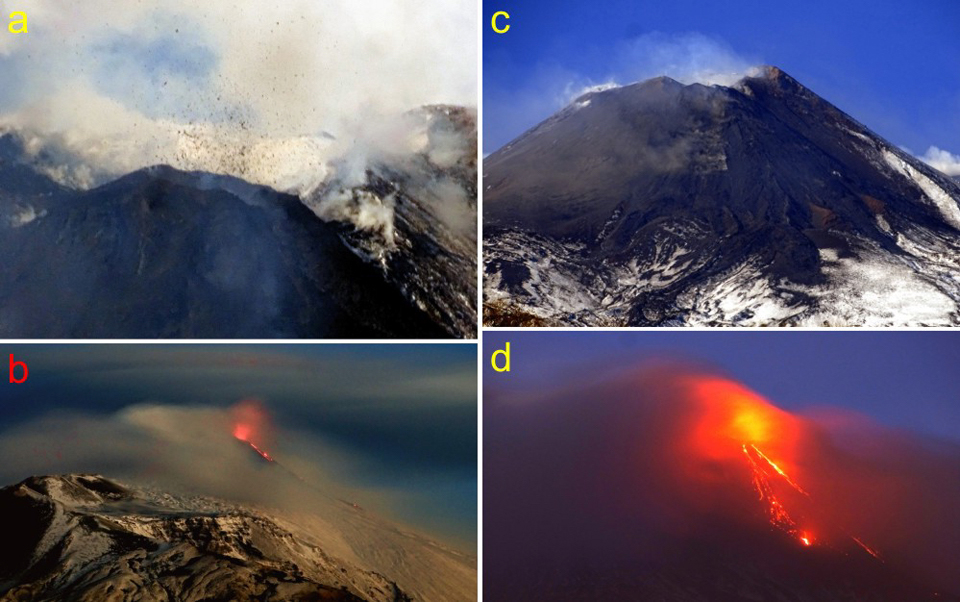
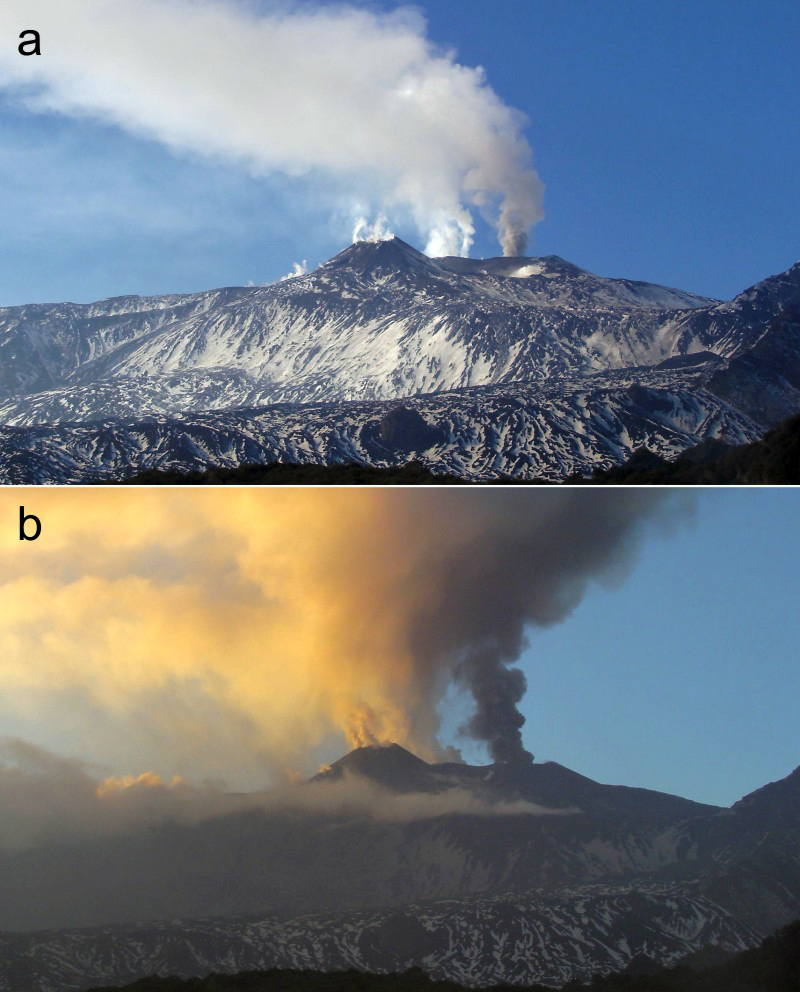
Activity during December 2018. Strombolian activity, with modest ash emissions, continued from the Bocca Nuova, NSEC, and NEC during the first three weeks of December. Lava flowed from the scoria cone located within the E vent of NSEC and was associated with incandescent blocks rolling down the E flank of NSEC. Variable Strombolian activity at the scoria cone beginning on 4 December produced continuous overlapping small flows from several vents near the scoria cone for two weeks (figure 241). Intermittent explosions lasted 5-10 minutes with similar length pauses; activity increased on 16 December with near-continuous lava effusion. Several small flows traveled NE, E, and SE down the E flank of NSEC during the second and third weeks of the month (figure 242). A few flows reached the base of the cone at 2,900 m elevation and were almost a kilometer in length. Small collapses of portions of the lava field also produced minor plumes of ash.
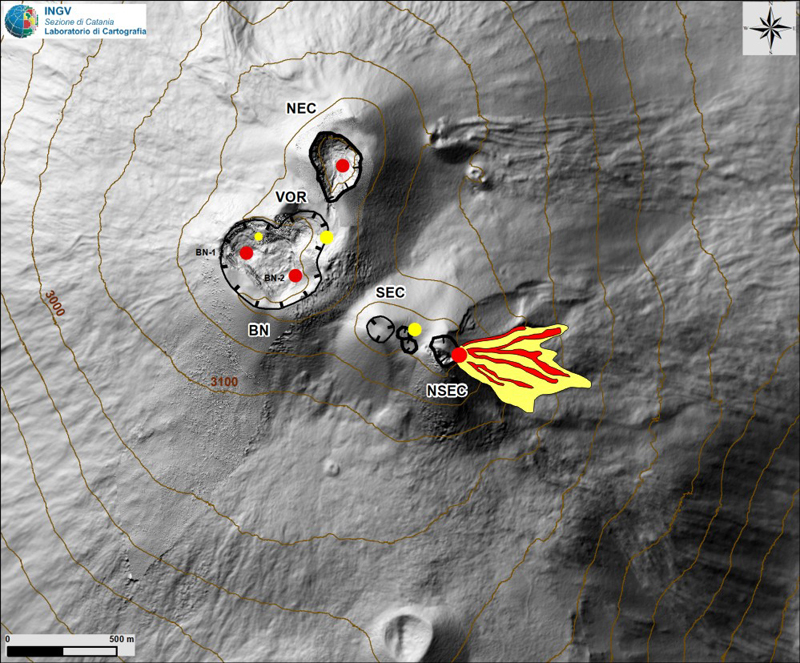
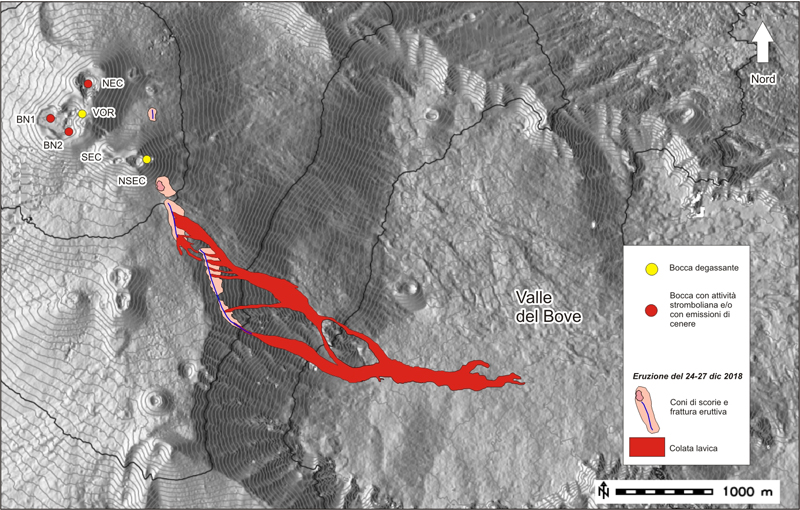
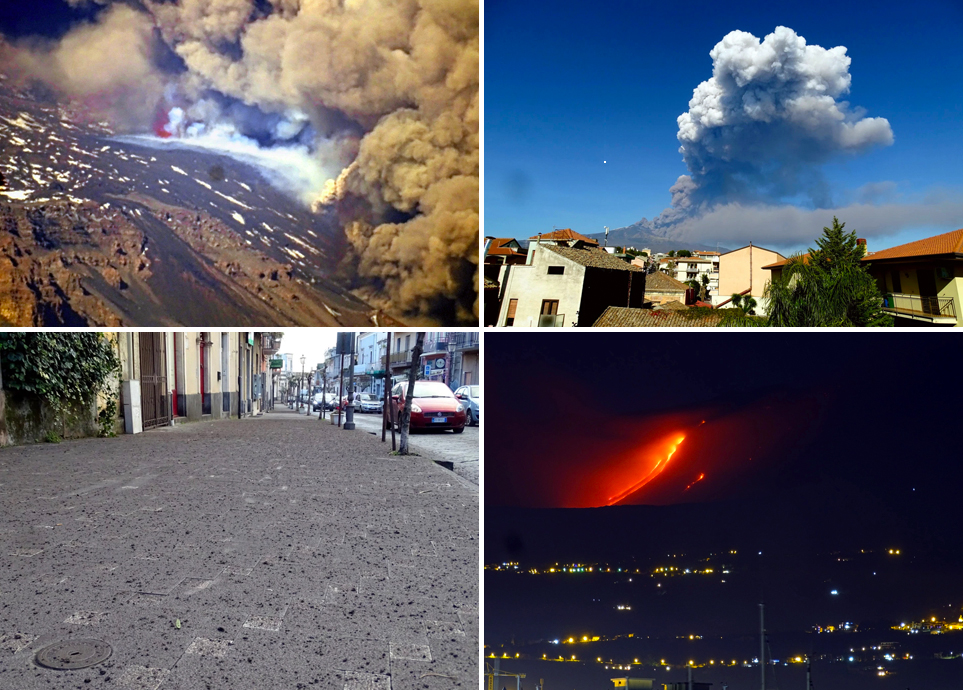
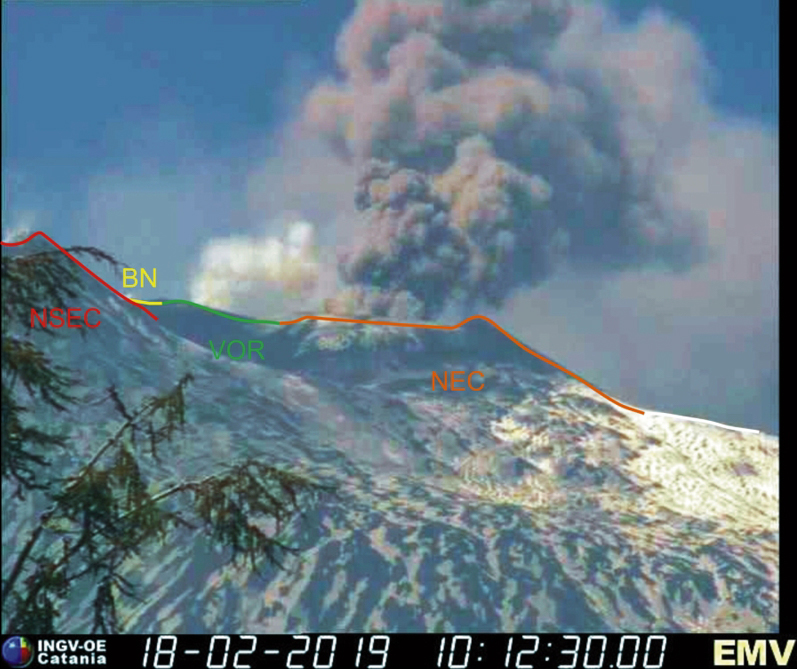
A lateral eruption and intense seismic swarm began on 24 December 2018 from a nearly 2-km-long fissure trending NNW-SSE on the SE flank of NSEC; it produced a flow into the Valle del Bove and covered about 1 km2 (figures 243). The other summit craters produced intense Strombolian activity and abundant ash emissions during 24-27 December. Beginning around 0800 local time on 24 December, degassing intensity from the summit craters increased significantly. In the following hours, intermittent reddish-gray ash emissions rose from Bocca Nuova and NEC becoming continuous by late morning. Shortly after noon, an eruptive fissure opened up at the southeastern base of NSEC, releasing intense Strombolian activity which rapidly formed a dense plume of dark ash. A second smaller fissure located between NSEC and NEC also opened at the same time and produced weaker Strombolian activity that lasted a few tens of minutes. Over the following two hours, the main fissure spread SE, crossing over the western edge of the Valle del Bove and reaching down to 2,400 m elevation. Continuous Strombolian activity of variable intensity occurred at NEC and Bocca Nuova. The ash cloud created by the multiple eruptive vents generated a dense plume that drifted SE, producing ashfall mainly in the area around Zafferana Etnea and Santa Venerina (figure 244).
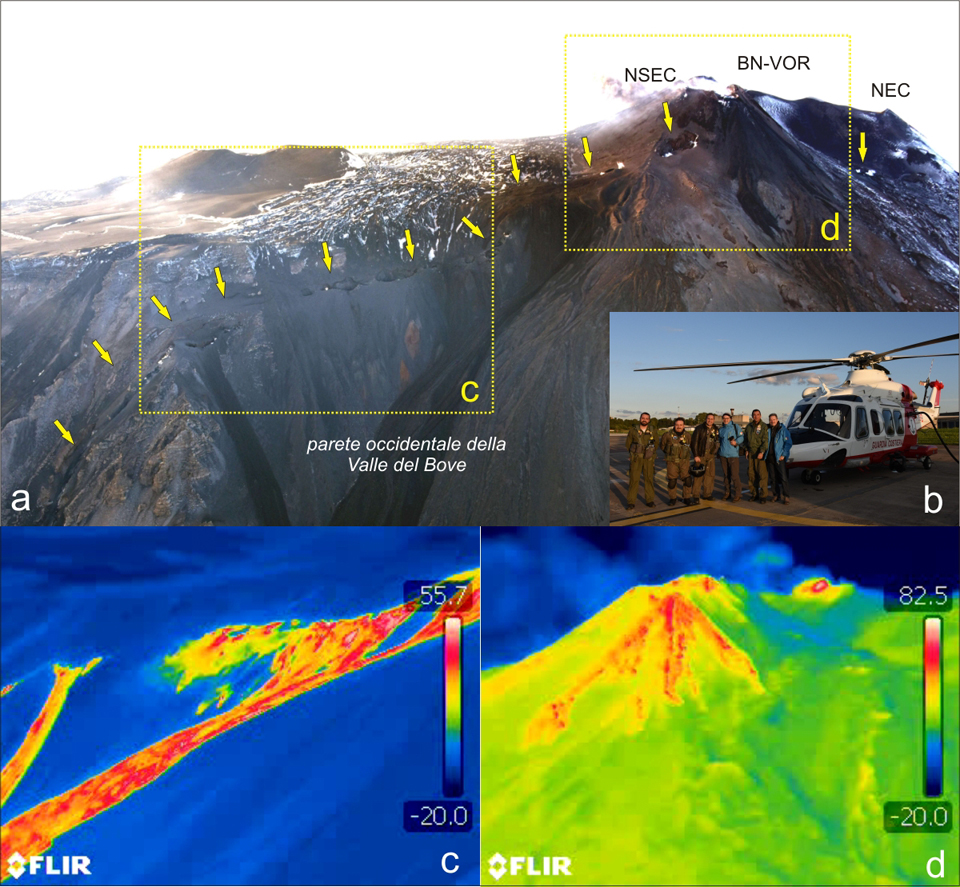
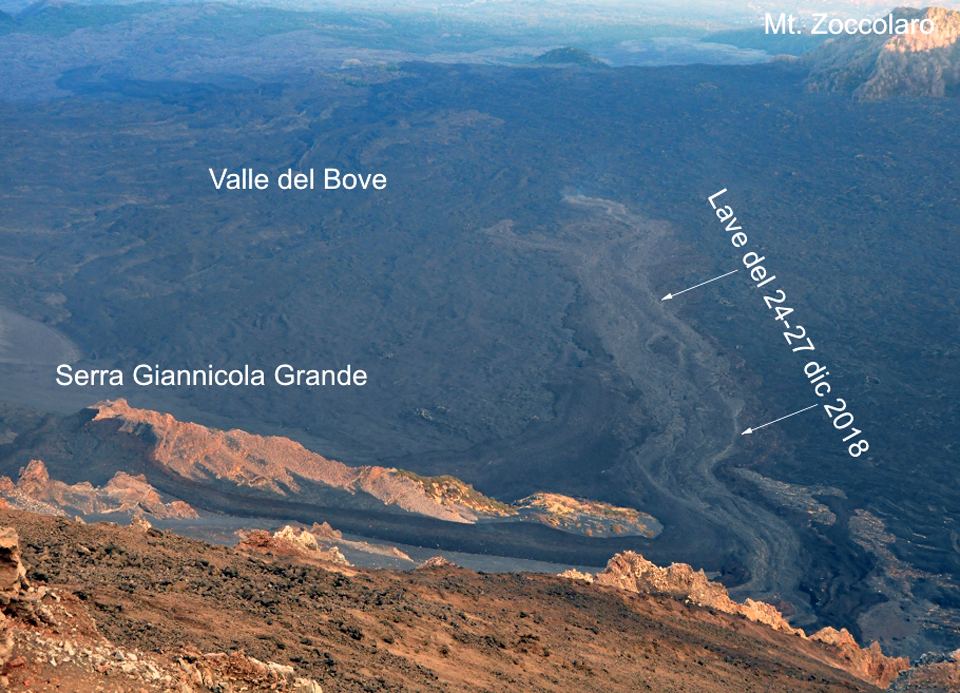
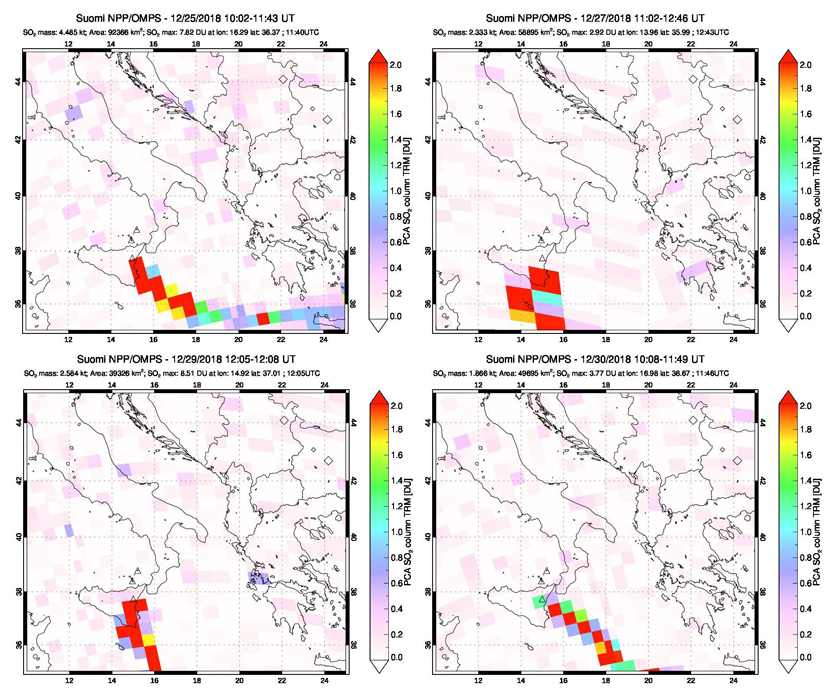
As the fissure opened it fed several flows that descended the W face of the Valle del Bove (figure 245), past Serra Giannicola Grande, merged into a single flow at the base of the wall, and continued E across the valley floor. Ash emissions decreased significantly from Bocca Nuova and NEC after 1430 on 24 December. By 1800 the fissure was active mainly at the lower end where it continued to feed the flow in the Valle del Bove with strong Strombolian activity and abundant ash emissions. Around 1830 intense Strombolian activity resumed at Bocca Nuova along with abundant ash emissions which gradually decreased overnight. Effusive activity from the fissure continued through 26 December when it decreased significantly; new lava feeding the flow ended on 27 December, but the flow front continued to move slowly (figure 246). Degassing continued at Bocca Nuova, forming a dilute ash plume that drifted hundreds of km S before dissipating. A persistent SO2 plume was measured with satellite instruments drifting SSE during 25-30 December while the eruptive fissure was active (figure 247).
A significant increase in the release of seismic strain and frequency of earthquakes began around 0830 on 24 December 2018. Around 300 events occurred during the first three hours of increased seismicity which continued throughout the week, with over 2,000 events recorded in different areas around Etna. The initial swarm was located in the summit area near the fissure with events located 0-3 km below sea level; subsequent seismicity was located in the Valle del Bove and included multiple earthquakes with magnitudes greater than M 4.0. The E and SW slopes of the volcano were also affected by seismic events. The largest earthquake (M 4.8) was recorded on 26 December at 0319 local time, located about 1 km below sea level between the towns of Fleri and Pennisi on the Faglia Fiandaca fault. It was widely felt in many urban centers and caused damage in some areas. INGV noted that it was likely not generated by movement of magmatic material in the epicentral area.
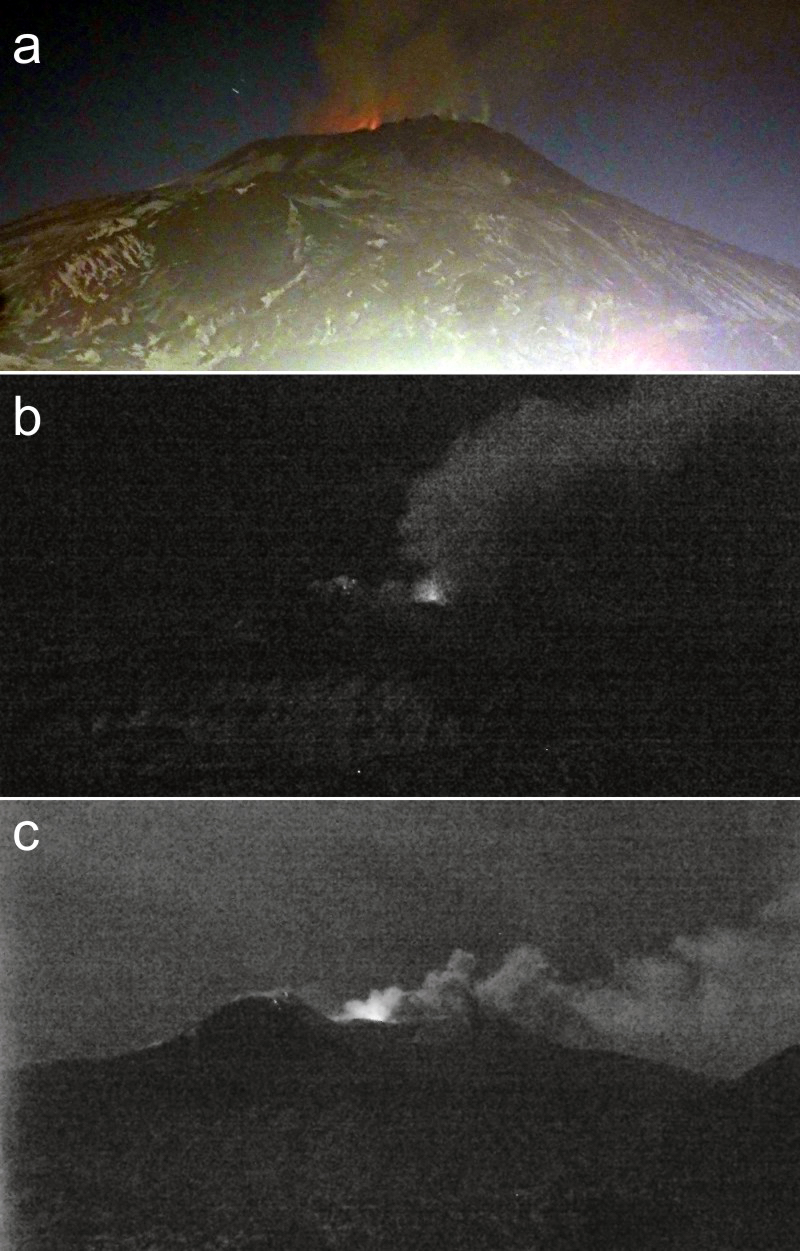
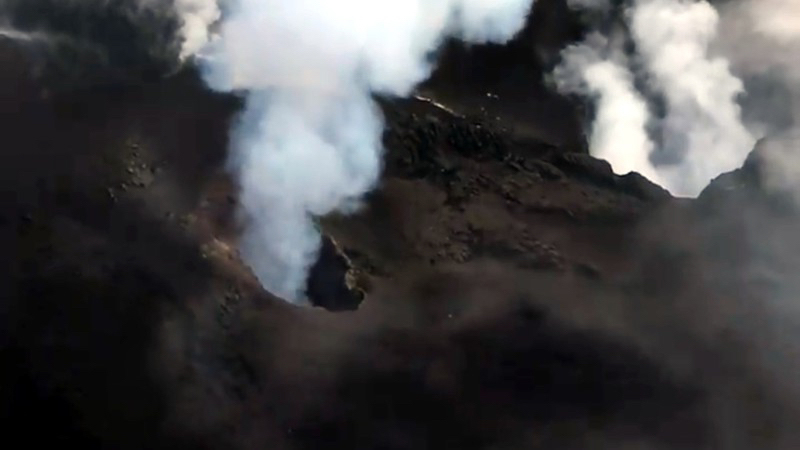
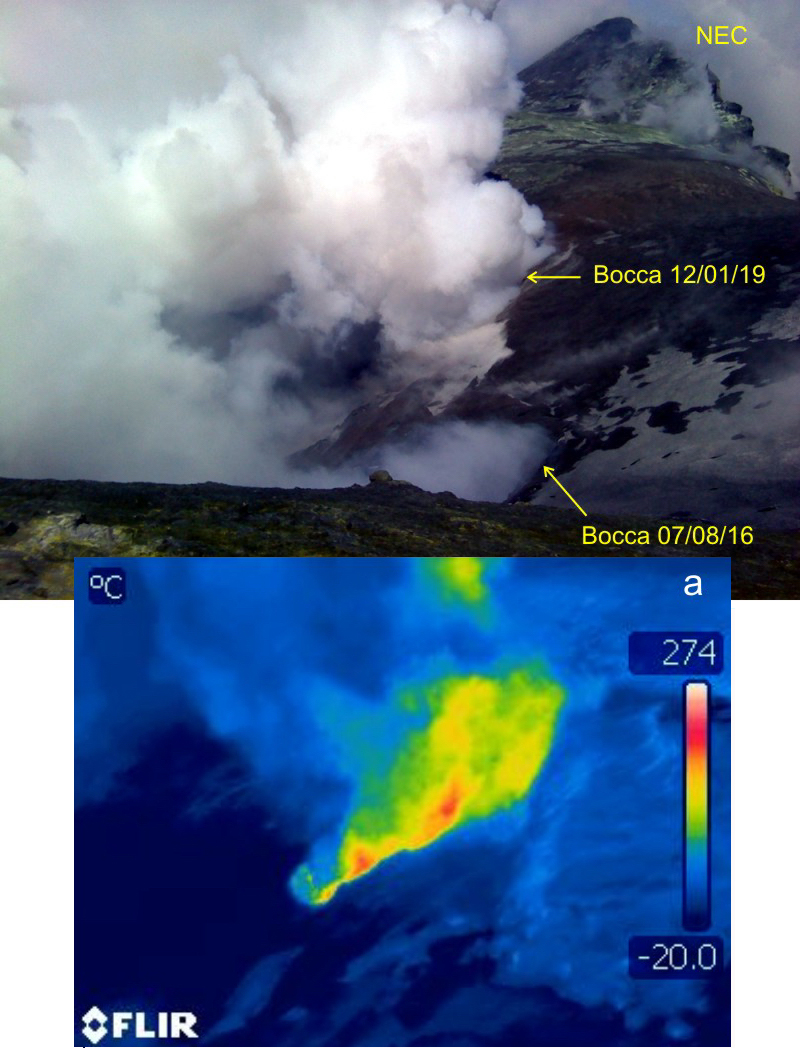
Activity during January 2019. No lava flow activity was reported in January, but sporadic ash emissions and weak Strombolian activity persisted at NEC and Bocca Nuova (figure 248); occasional nighttime incandescent bursts were seen from Voragine. During one of these ash-emission episodes, on the evening of 18 January, fine ashfall was reported on the SE flank in the towns of Zafferana Etnea and Santa Venerina. Slight increases in volcanic tremor amplitude accompanied incandescent flashes from Voragine crater on the evenings of 16 and 18 January and in the early morning of 21 January (figure 249). On 19 January gas emissions and explosions were reported from a new vent near the NE edge of VOR, about 40 m NW from the 7 August 2016 vent (figure 250).
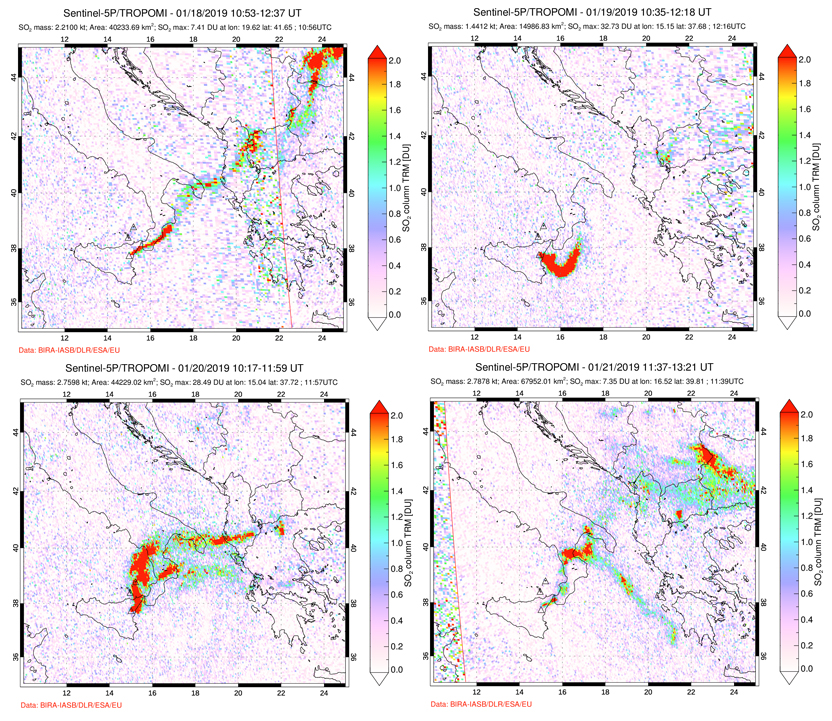
Newly available higher resolution SO2 data from the TROPOMI Tropospheric Monitoring Instrument on board the Copernicus Sentinel-5 Precursor (S5P) satellite showed persistent SO2 plumes from Etna that drifted significant distances in multiple directions before dissipating for much of the month. The strongest plumes were recorded during 16-22 January 2019 (figure 251).
Ash emissions intensified during the last week of January. During the morning of 23 January 2019 a dense ash plume drifted ENE from NEC, producing ashfall on the E flank of the volcano as far as the coast, including in Giarre (figure 252). Discontinuous ash emissions were reported from Bocca Nuova on 25 January; the following morning ash emissions intensified again from NEC and drifted S, producing ashfall in the S flank as far as Catania (figure 253). Emissions persisted until sometime during the night of 26-27 January. The ashfall from 22-23 and 26 January were analyzed by INGV personnel; the components were 95-97% lithic fragments and crystals with only 3-5% juvenile material. An ash plume from Bocca Nuova on 28 January drifted E and produced ashfall in the Valle del Bove. Ash emission decreased from Bocca Nuova on 29-30 January; only dilute ash was observed from NEC during the last few days of the month.
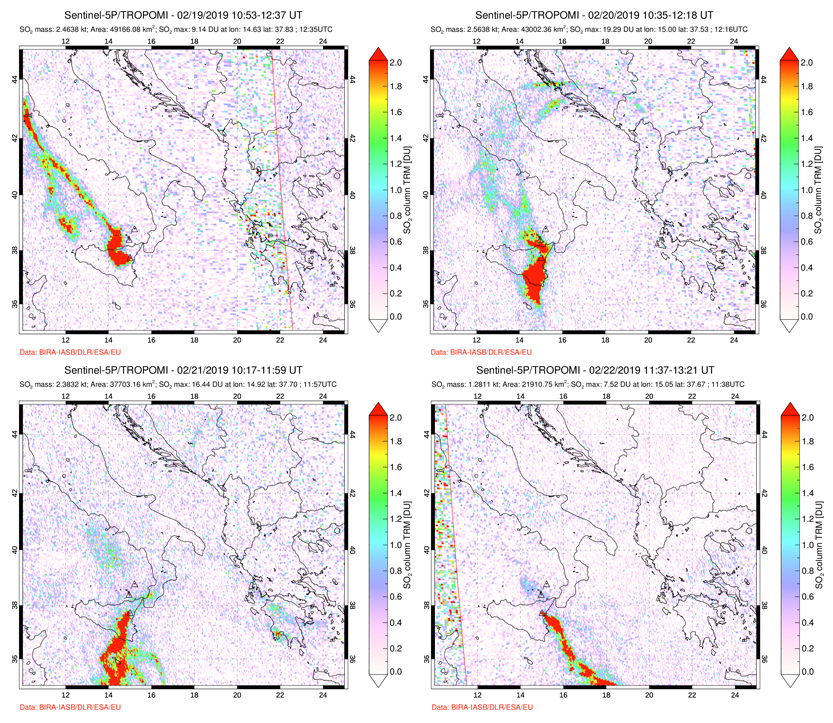
Activity during February 2019. Typical degassing and discontinuous explosive activity from the summit characterized Etna during February. An explosion was observed at NEC at 0230 UTC on 2 February which initially produced a dense ash plume that drifted NE, producing ashfall in the summit area and the Piano Provenzana. Ash emission decreased throughout the day. Repeated ash emissions were visible beginning in the afternoon of 6 February from NEC after several days of cloudy weather. Continuous ash emissions were observed overnight on 7-8 February, producing a dilute plume that drifted S then SE. A similar dilute ash emission was observed on 9 February; the plume drifted SW. Analysis of the ash by INGV indicated a similar composition to the samples measured two weeks prior. Webcams captured numerous pulsating ash emissions from NEC in mid-February, many of which produced substantial SO2 plumes (figure 254). Emissions increased in intensity and frequency and were nearly continuous during most of the third week, with plumes drifting W, S, and SE resulting in ashfall in those directions, and also led to temporary air space closures in Catania and Comiso (figures 255 and 256). Also during the third week, Strombolian activity took place at BN-1, while pulsating degassing was observed at BN-2. Incandescent degassing continued at the vent located on the N edge of Voragine. Irregular ash emissions that rapidly dispersed near the summit were produced by BN on 26 and 27 February.
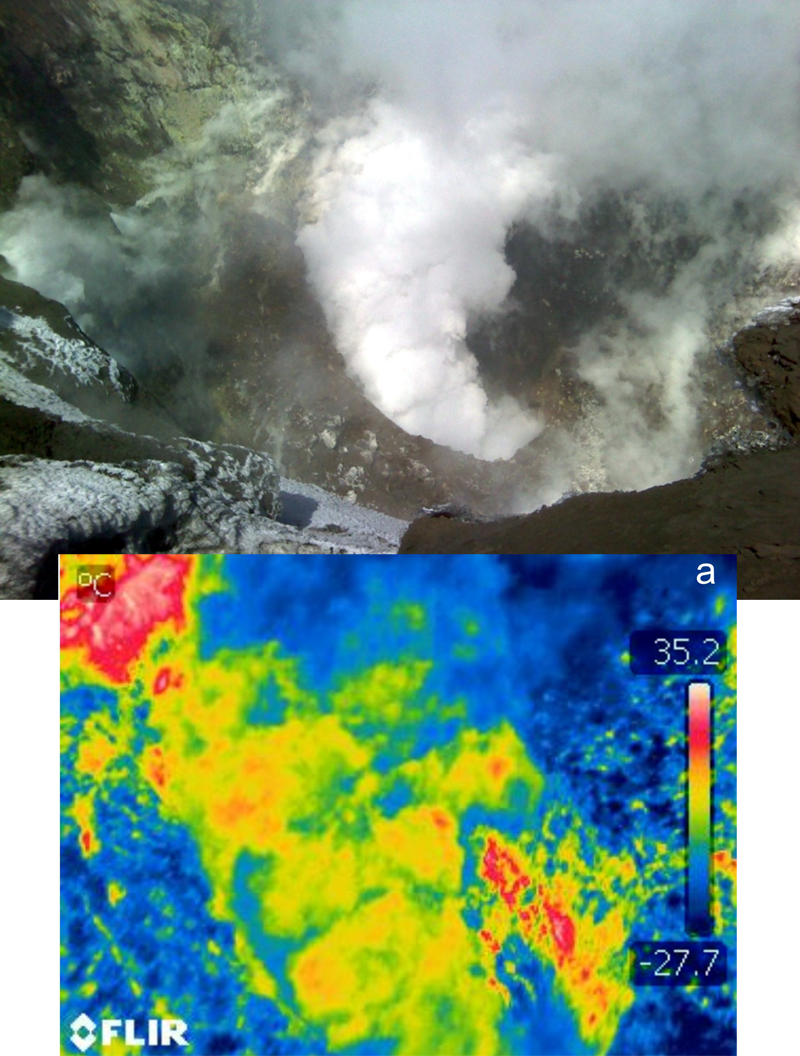
Activity during March 2019. Discontinuous and moderate outgassing characterized activity at all the summit vents of Etna throughout March 2018 after an ash plume from Bocca Nuova on 2 March reached 4 km above the crater. The ash plume was accompanied by seismic activity that INGV concluded was likely related to an intra-crater collapse. The discontinuous degassing was interrupted on 16 March by a single small emission of brown ash from Bocca Nuova which rapidly dissipated (figure 257). During a site visit on 30 March, INGV personnel noted pulsating degassing with apparent temperatures above 250°C from the new vent formed in mid-January at the E rim of Voragine (figure 258). At NEC, low-temperature pulsating degassing was occurring at the vent at the bottom of the crater and from fumaroles along the inner walls (figure 259).
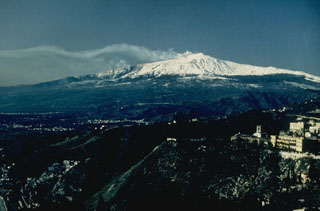
Geological Summary. Mount Etna, towering above Catania on the island of Sicily, has one of the world's longest documented records of volcanism, dating back to 1500 BCE. Historical lava flows of basaltic composition cover much of the surface of this massive volcano, whose edifice is the highest and most voluminous in Italy. The Mongibello stratovolcano, truncated by several small calderas, was constructed during the late Pleistocene and Holocene over an older shield volcano. The most prominent morphological feature of Etna is the Valle del Bove, a 5 x 10 km caldera open to the east. Two styles of eruptive activity typically occur, sometimes simultaneously. Persistent explosive eruptions, sometimes with minor lava emissions, take place from one or more summit craters. Flank vents, typically with higher effusion rates, are less frequently active and originate from fissures that open progressively downward from near the summit (usually accompanied by Strombolian eruptions at the upper end). Cinder cones are commonly constructed over the vents of lower-flank lava flows. Lava flows extend to the foot of the volcano on all sides and have reached the sea over a broad area on the SE flank.
Information Contacts: Sezione di Catania - Osservatorio Etneo, Istituto Nazionale di Geofisica e Vulcanologia (INGV), Sezione di Catania, Piazza Roma 2, 95123 Catania, Italy (URL: http://www.ct.ingv.it/it/ ); Blog INGVvulcani, Istituto Nazionale di Geofisica e Vulcanologia (INGV); (URL: http://ingvvulcani.wordpress.com); MIROVA (Middle InfraRed Observation of Volcanic Activity), a collaborative project between the Universities of Turin and Florence (Italy) supported by the Centre for Volcanic Risk of the Italian Civil Protection Department (URL: http://www.mirovaweb.it/); Global Sulfur Dioxide Monitoring Page, Atmospheric Chemistry and Dynamics Laboratory, NASA Goddard Space Flight Center (NASA/GSFC), 8800 Greenbelt Road, Goddard, Maryland, USA (URL: https://so2.gsfc.nasa.gov/).