Yasur
Vanuatu
19.532°S, 169.447°E; summit elev. 361 m
All times are local (unless otherwise noted)
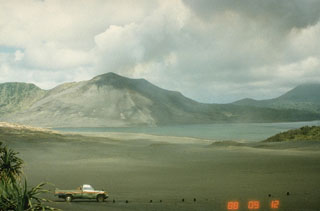
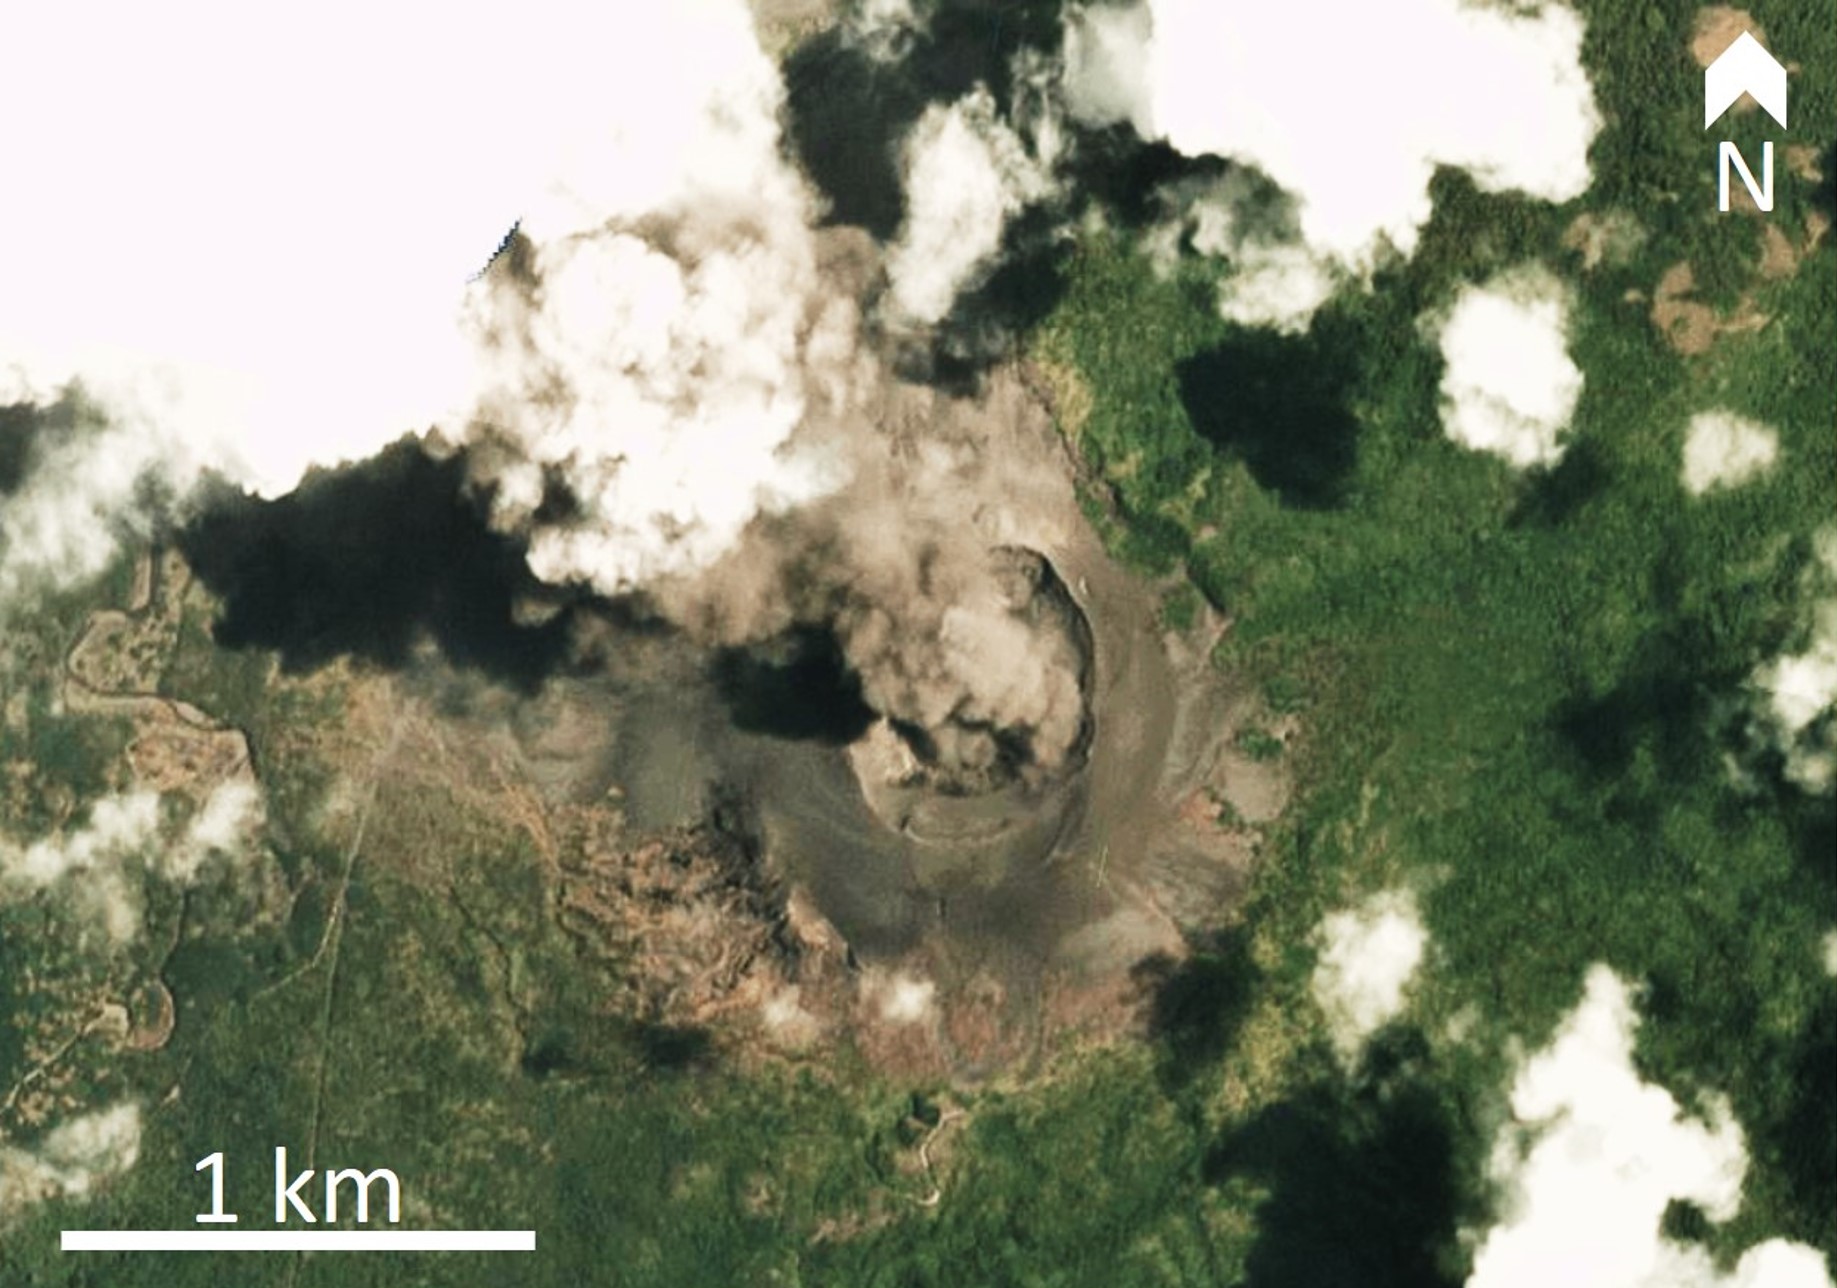
Yasur has remained on Alert Level 2 (on a scale of 0-4) since 18 October 2016, indicating "Major Unrest; Danger Zone remains at 395 m around the eruptive vents." The summit crater contains several active vents that frequently produce Strombolian explosions and gas plumes (figure 60). This bulletin summarizes activity during June 2019 through February 2020 and is based on reports by the Vanuatu Meteorology and Geo-Hazards Department (VMGD), visitor photographs and videos, and satellite data.
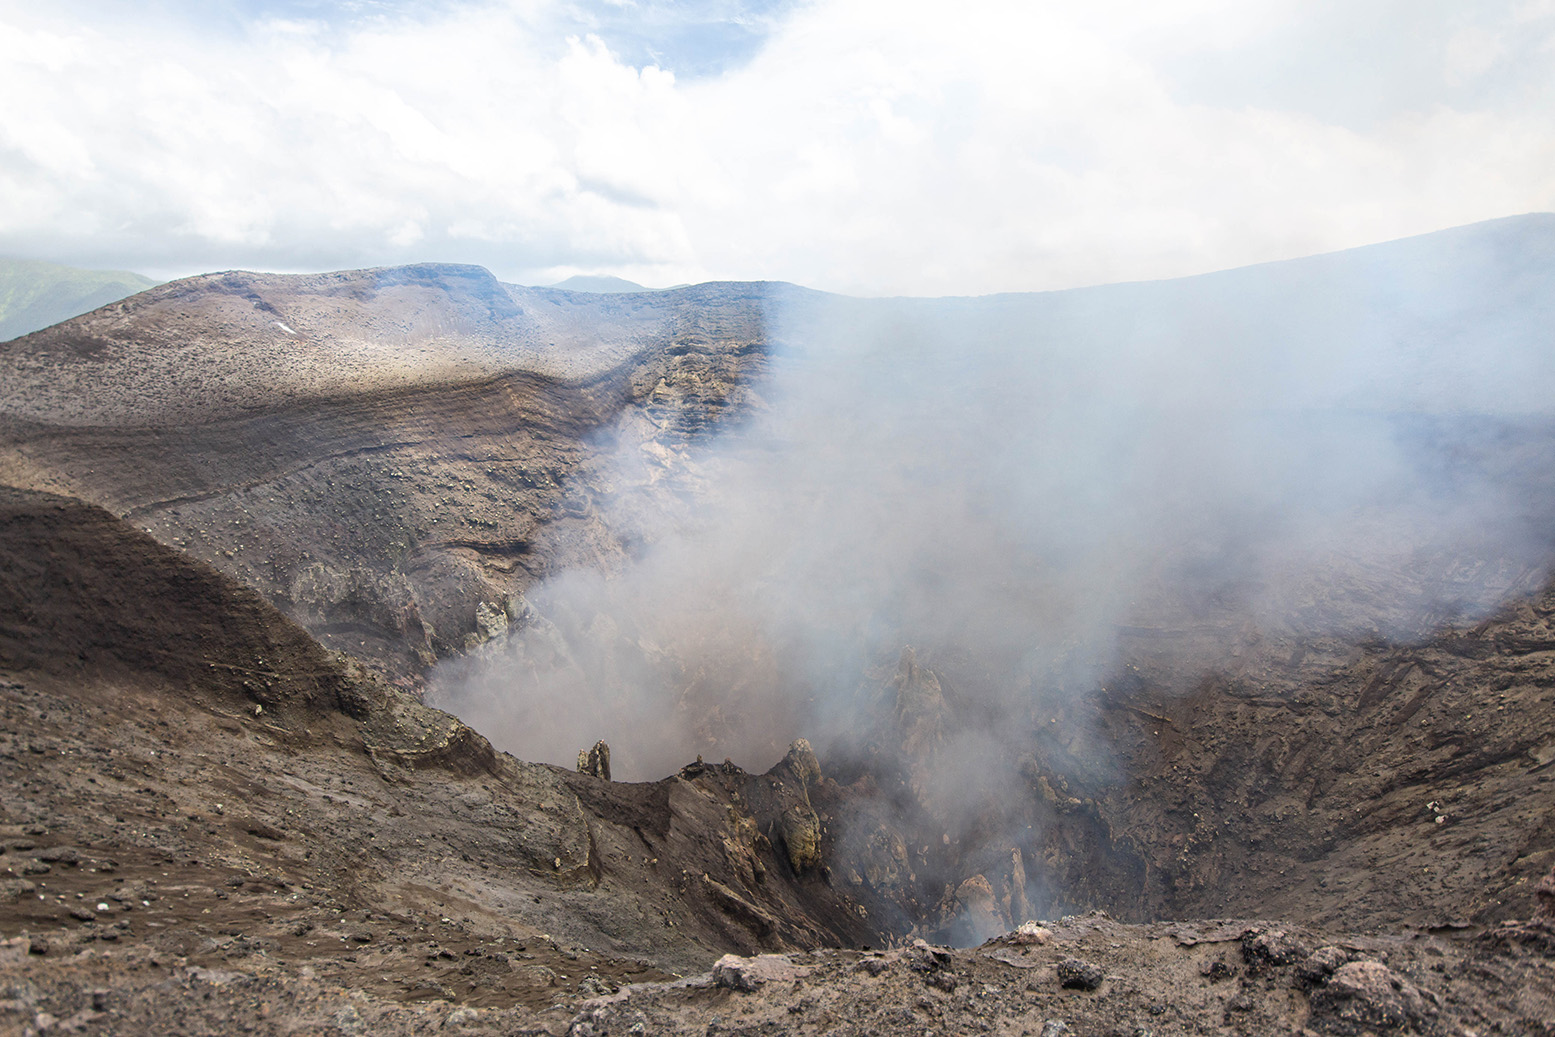
A VMGD report on 27 June described ongoing Strombolian explosions with major unrest confined to the crater. The 25 July report noted the continuation of Strombolian activity with some strong explosions, and a warning that volcanic bombs may impact outside of the crater area (figure 61).
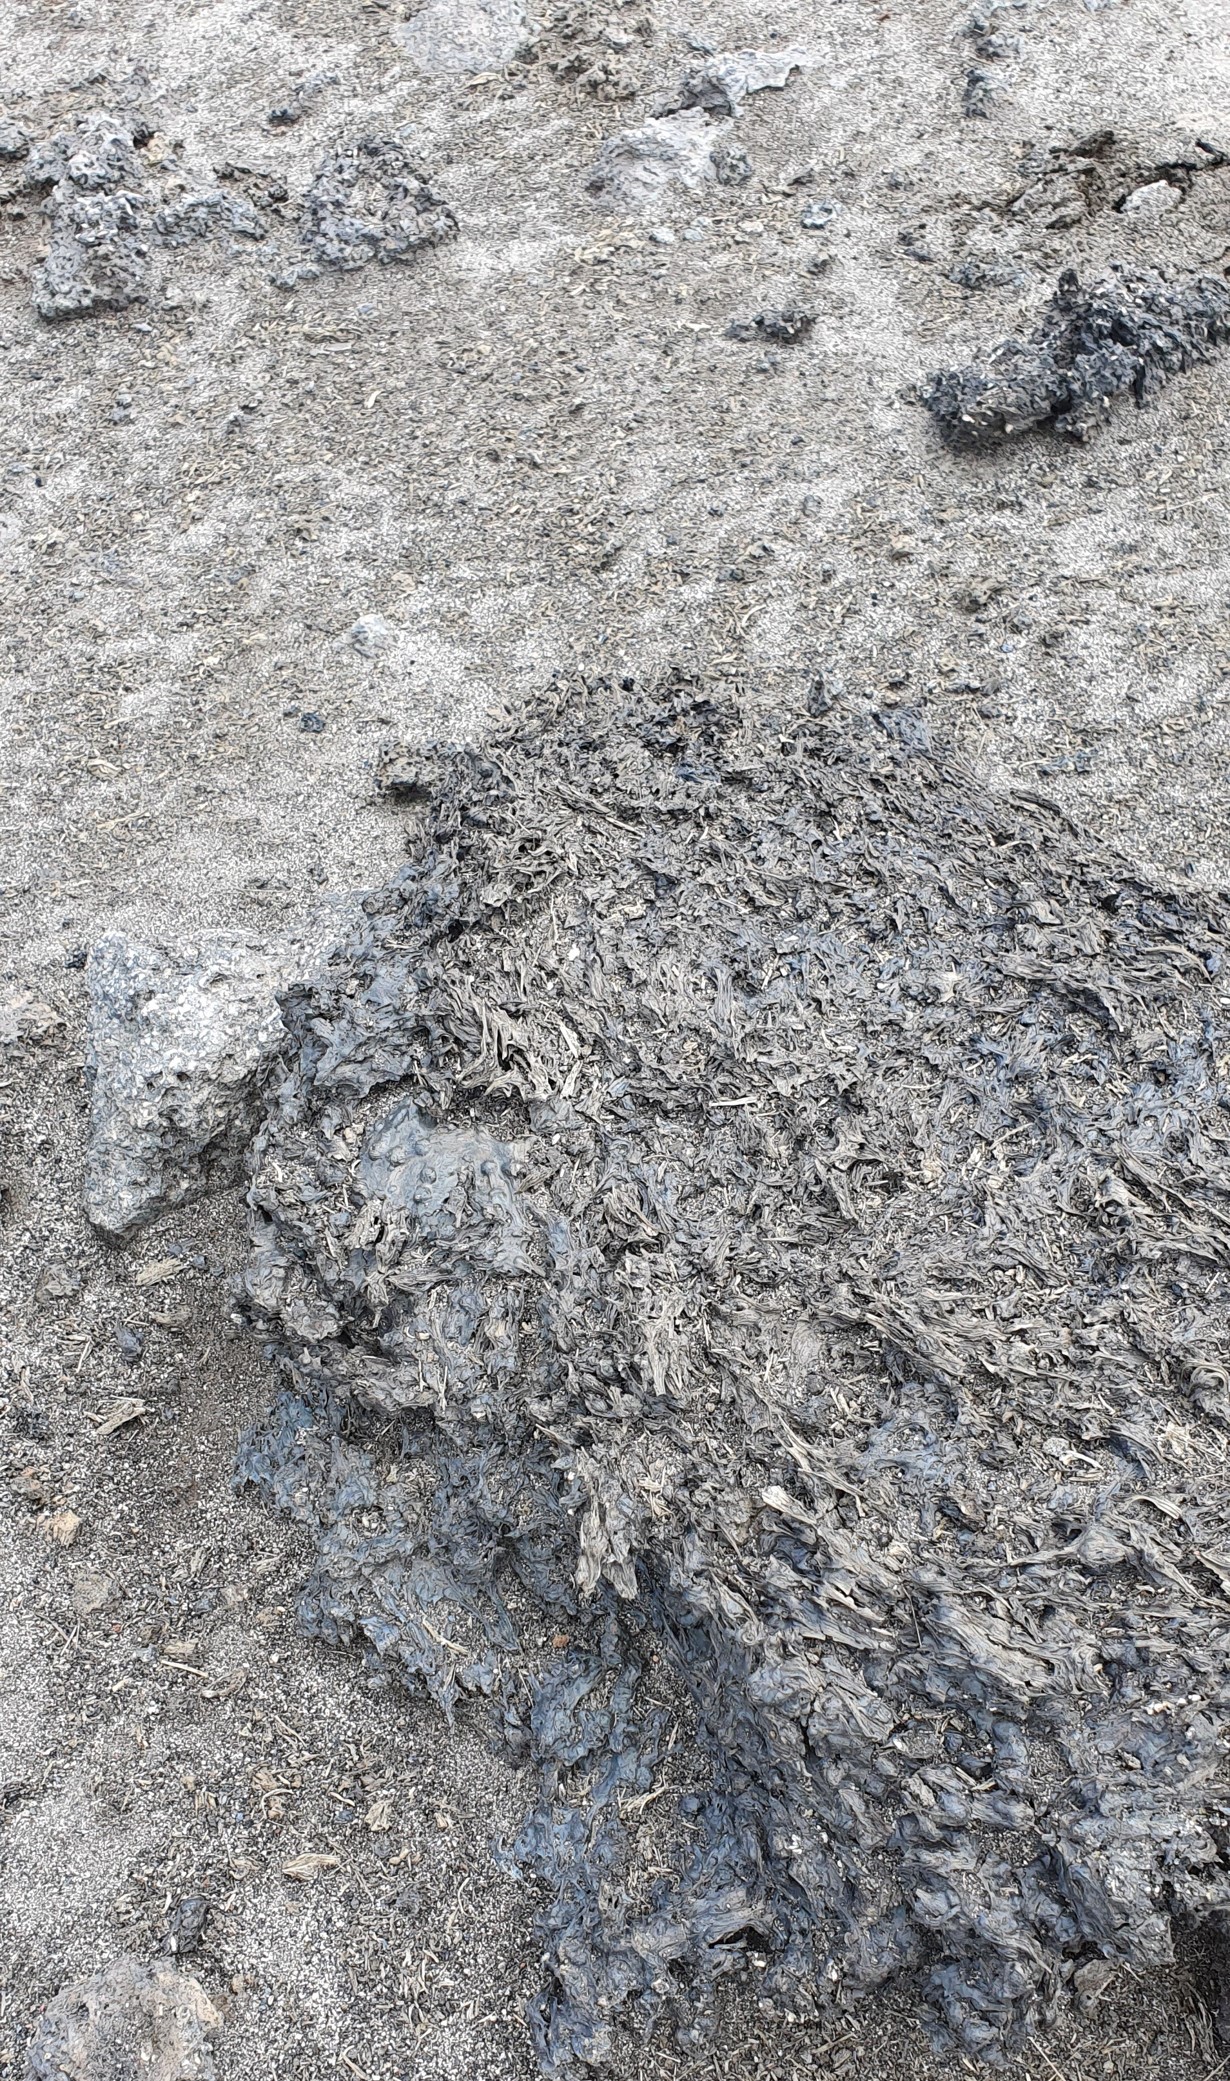
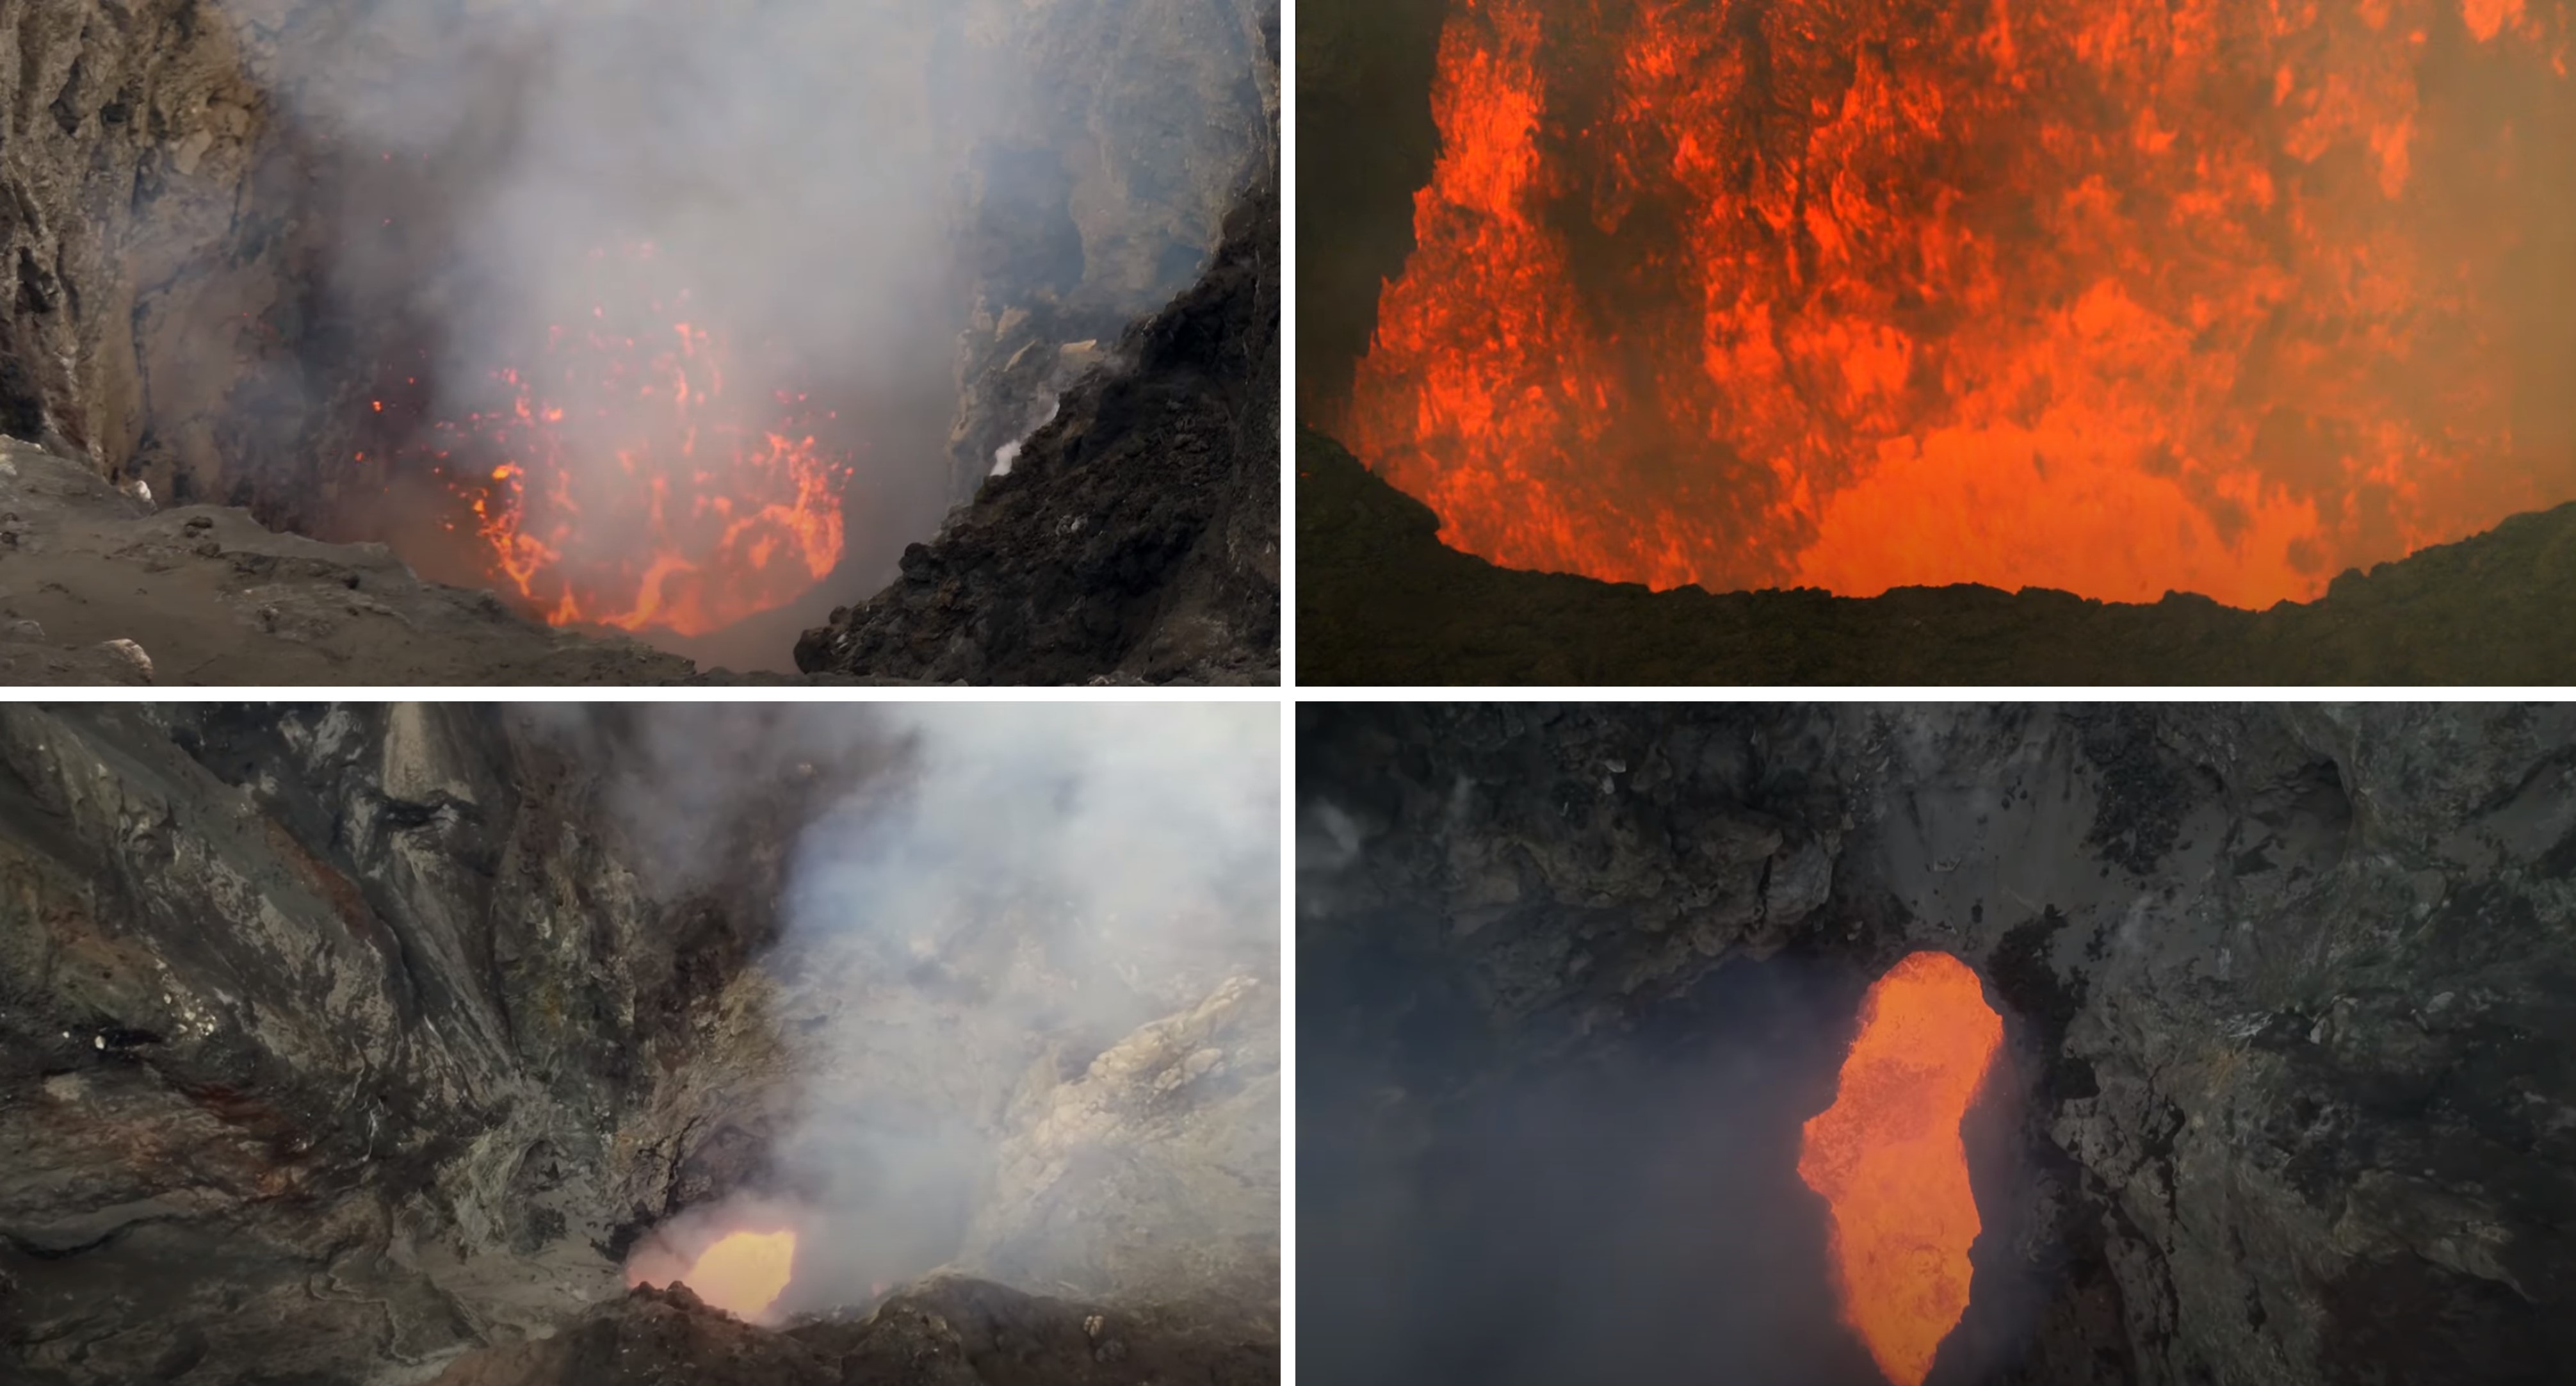
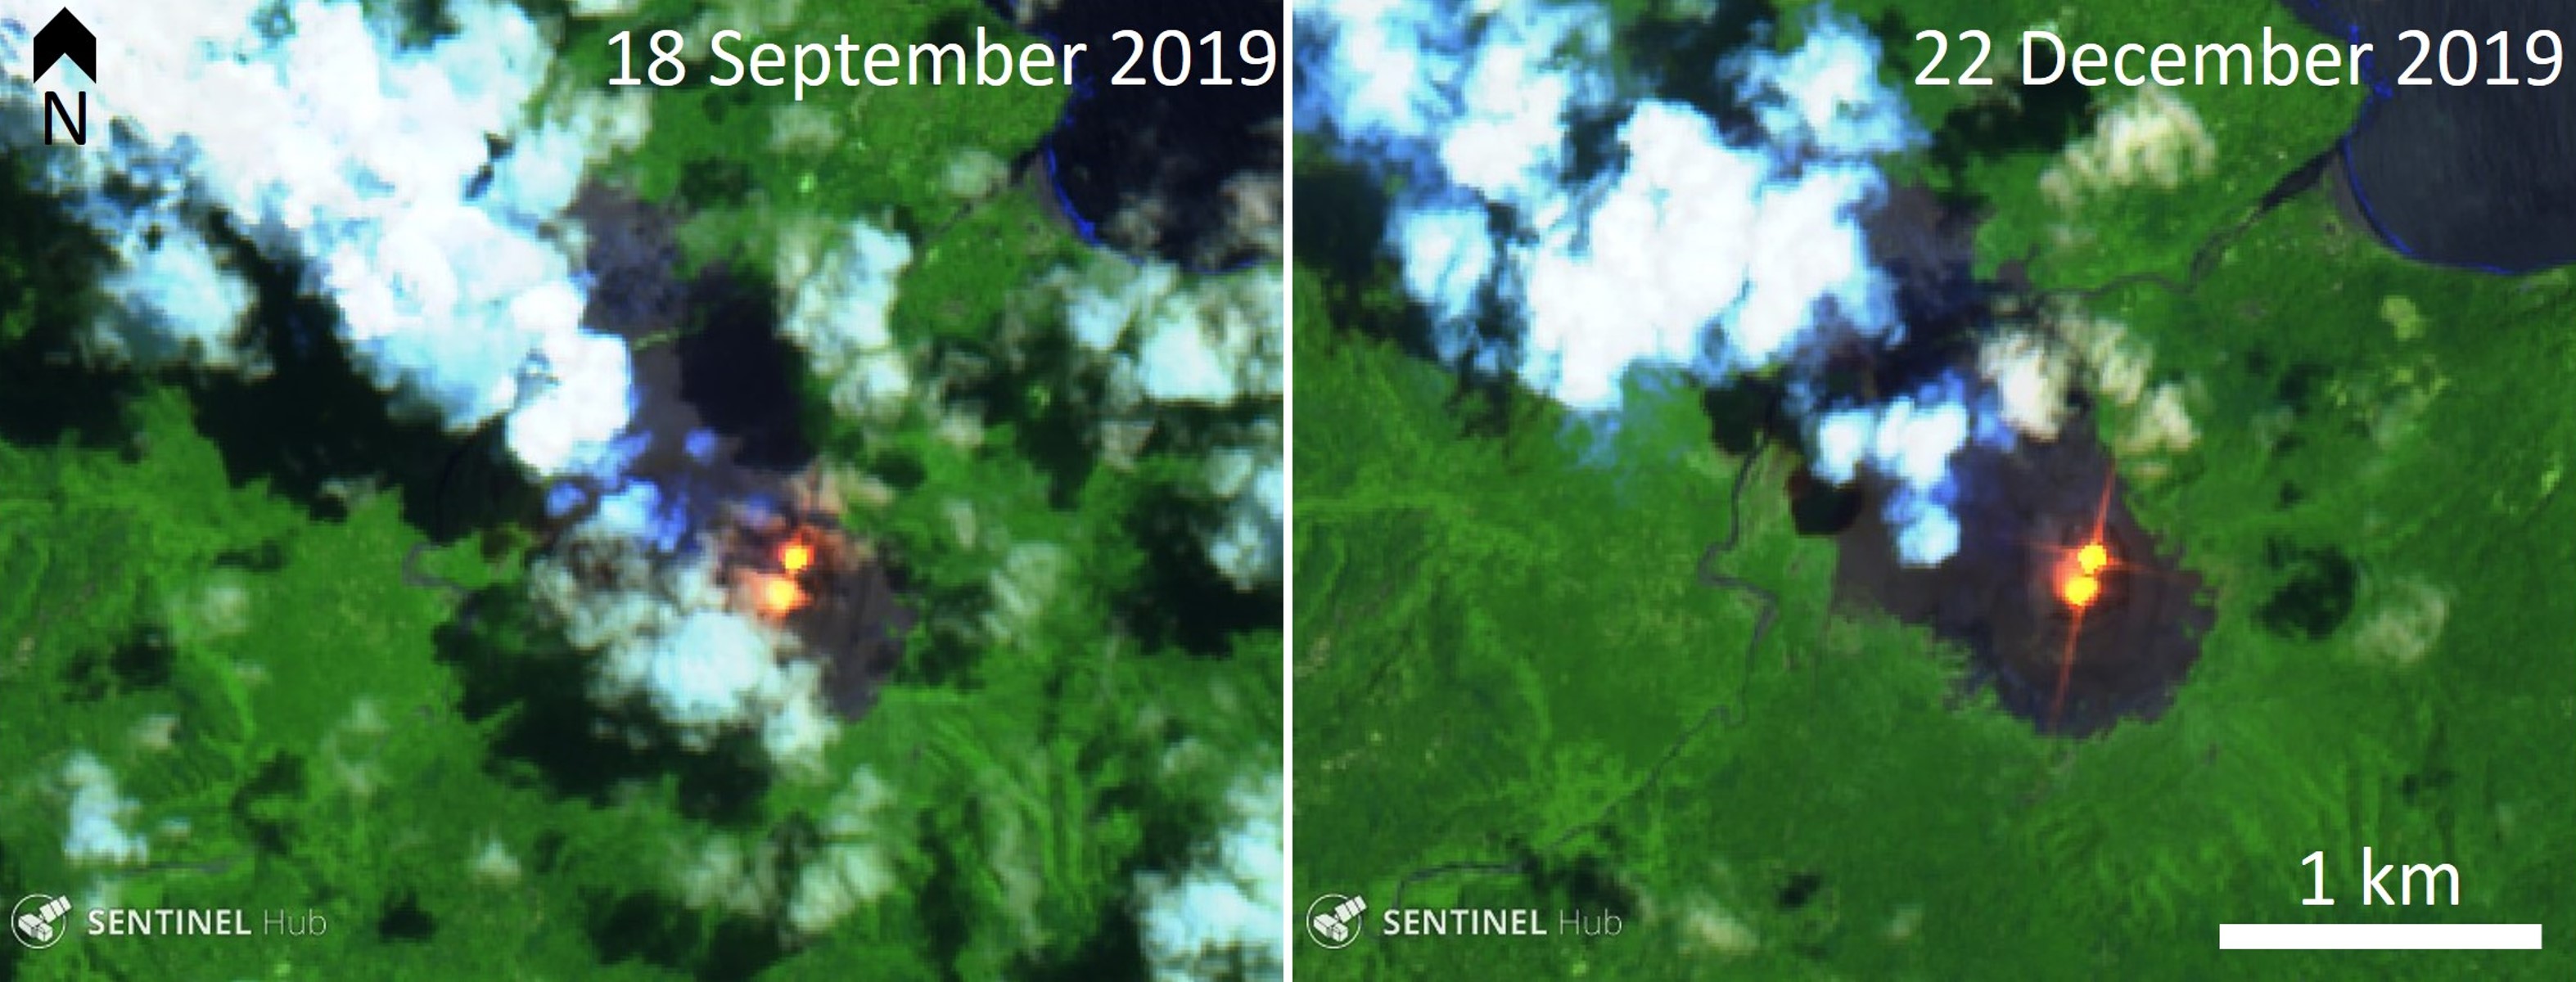
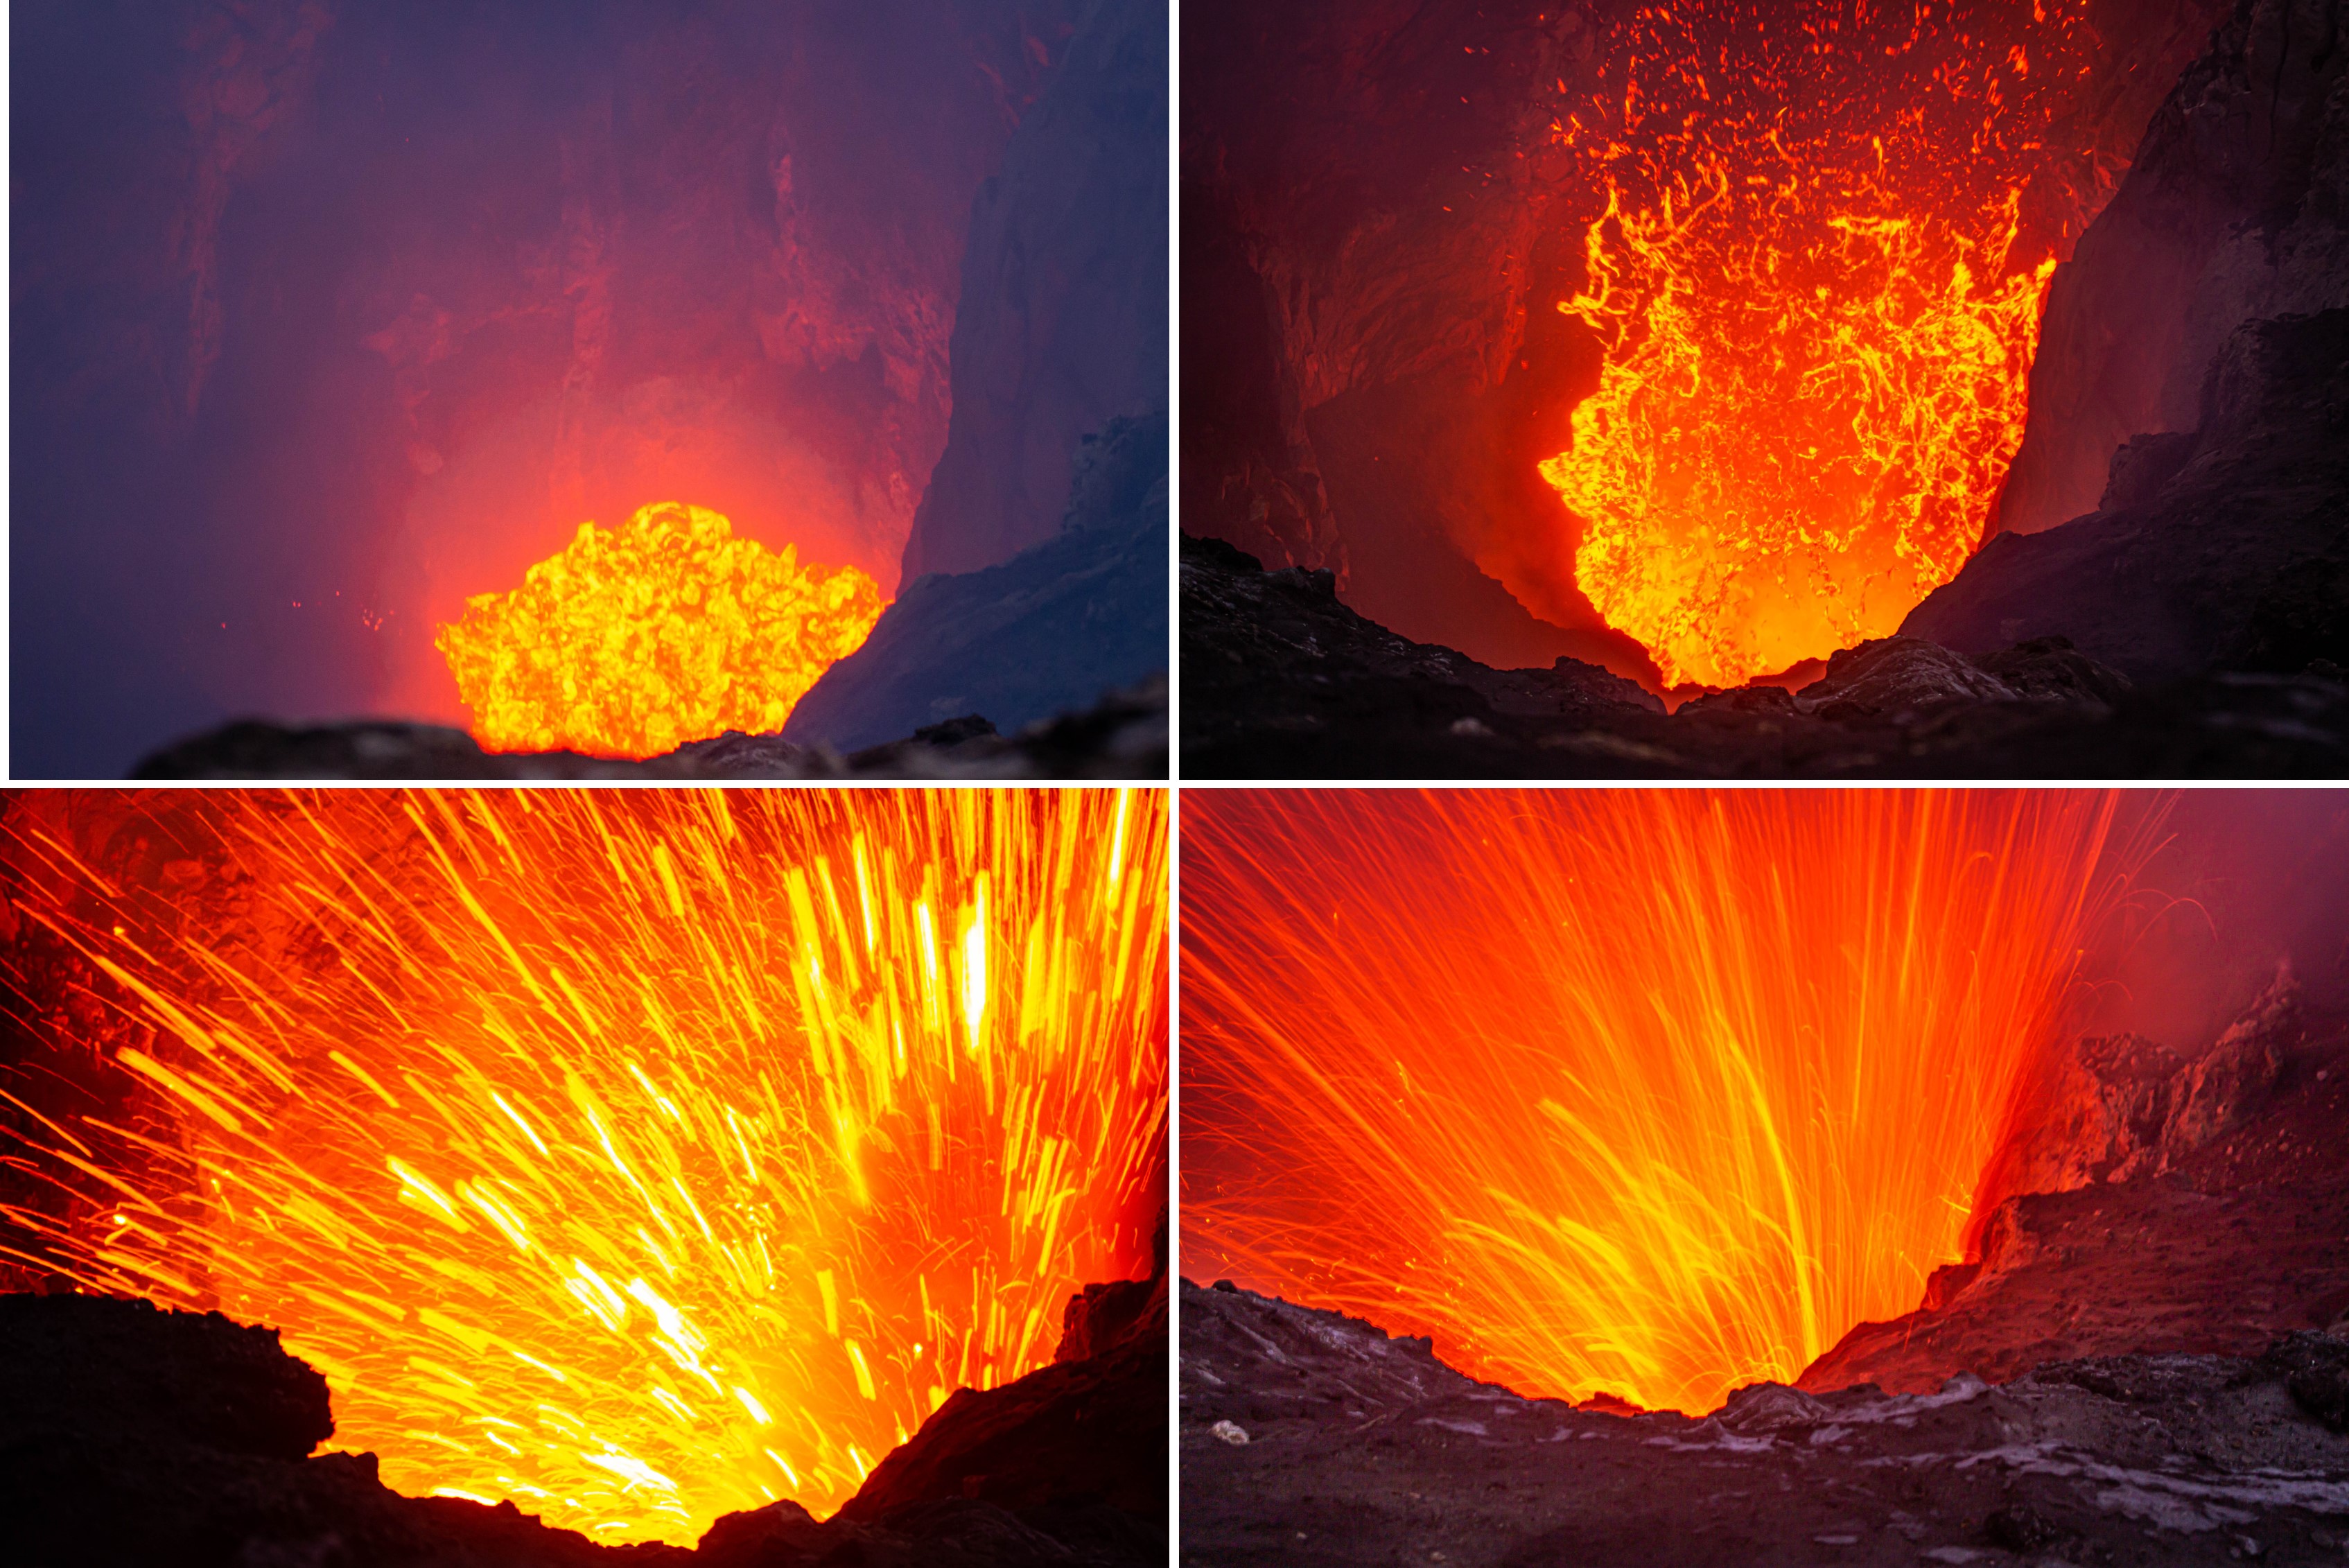
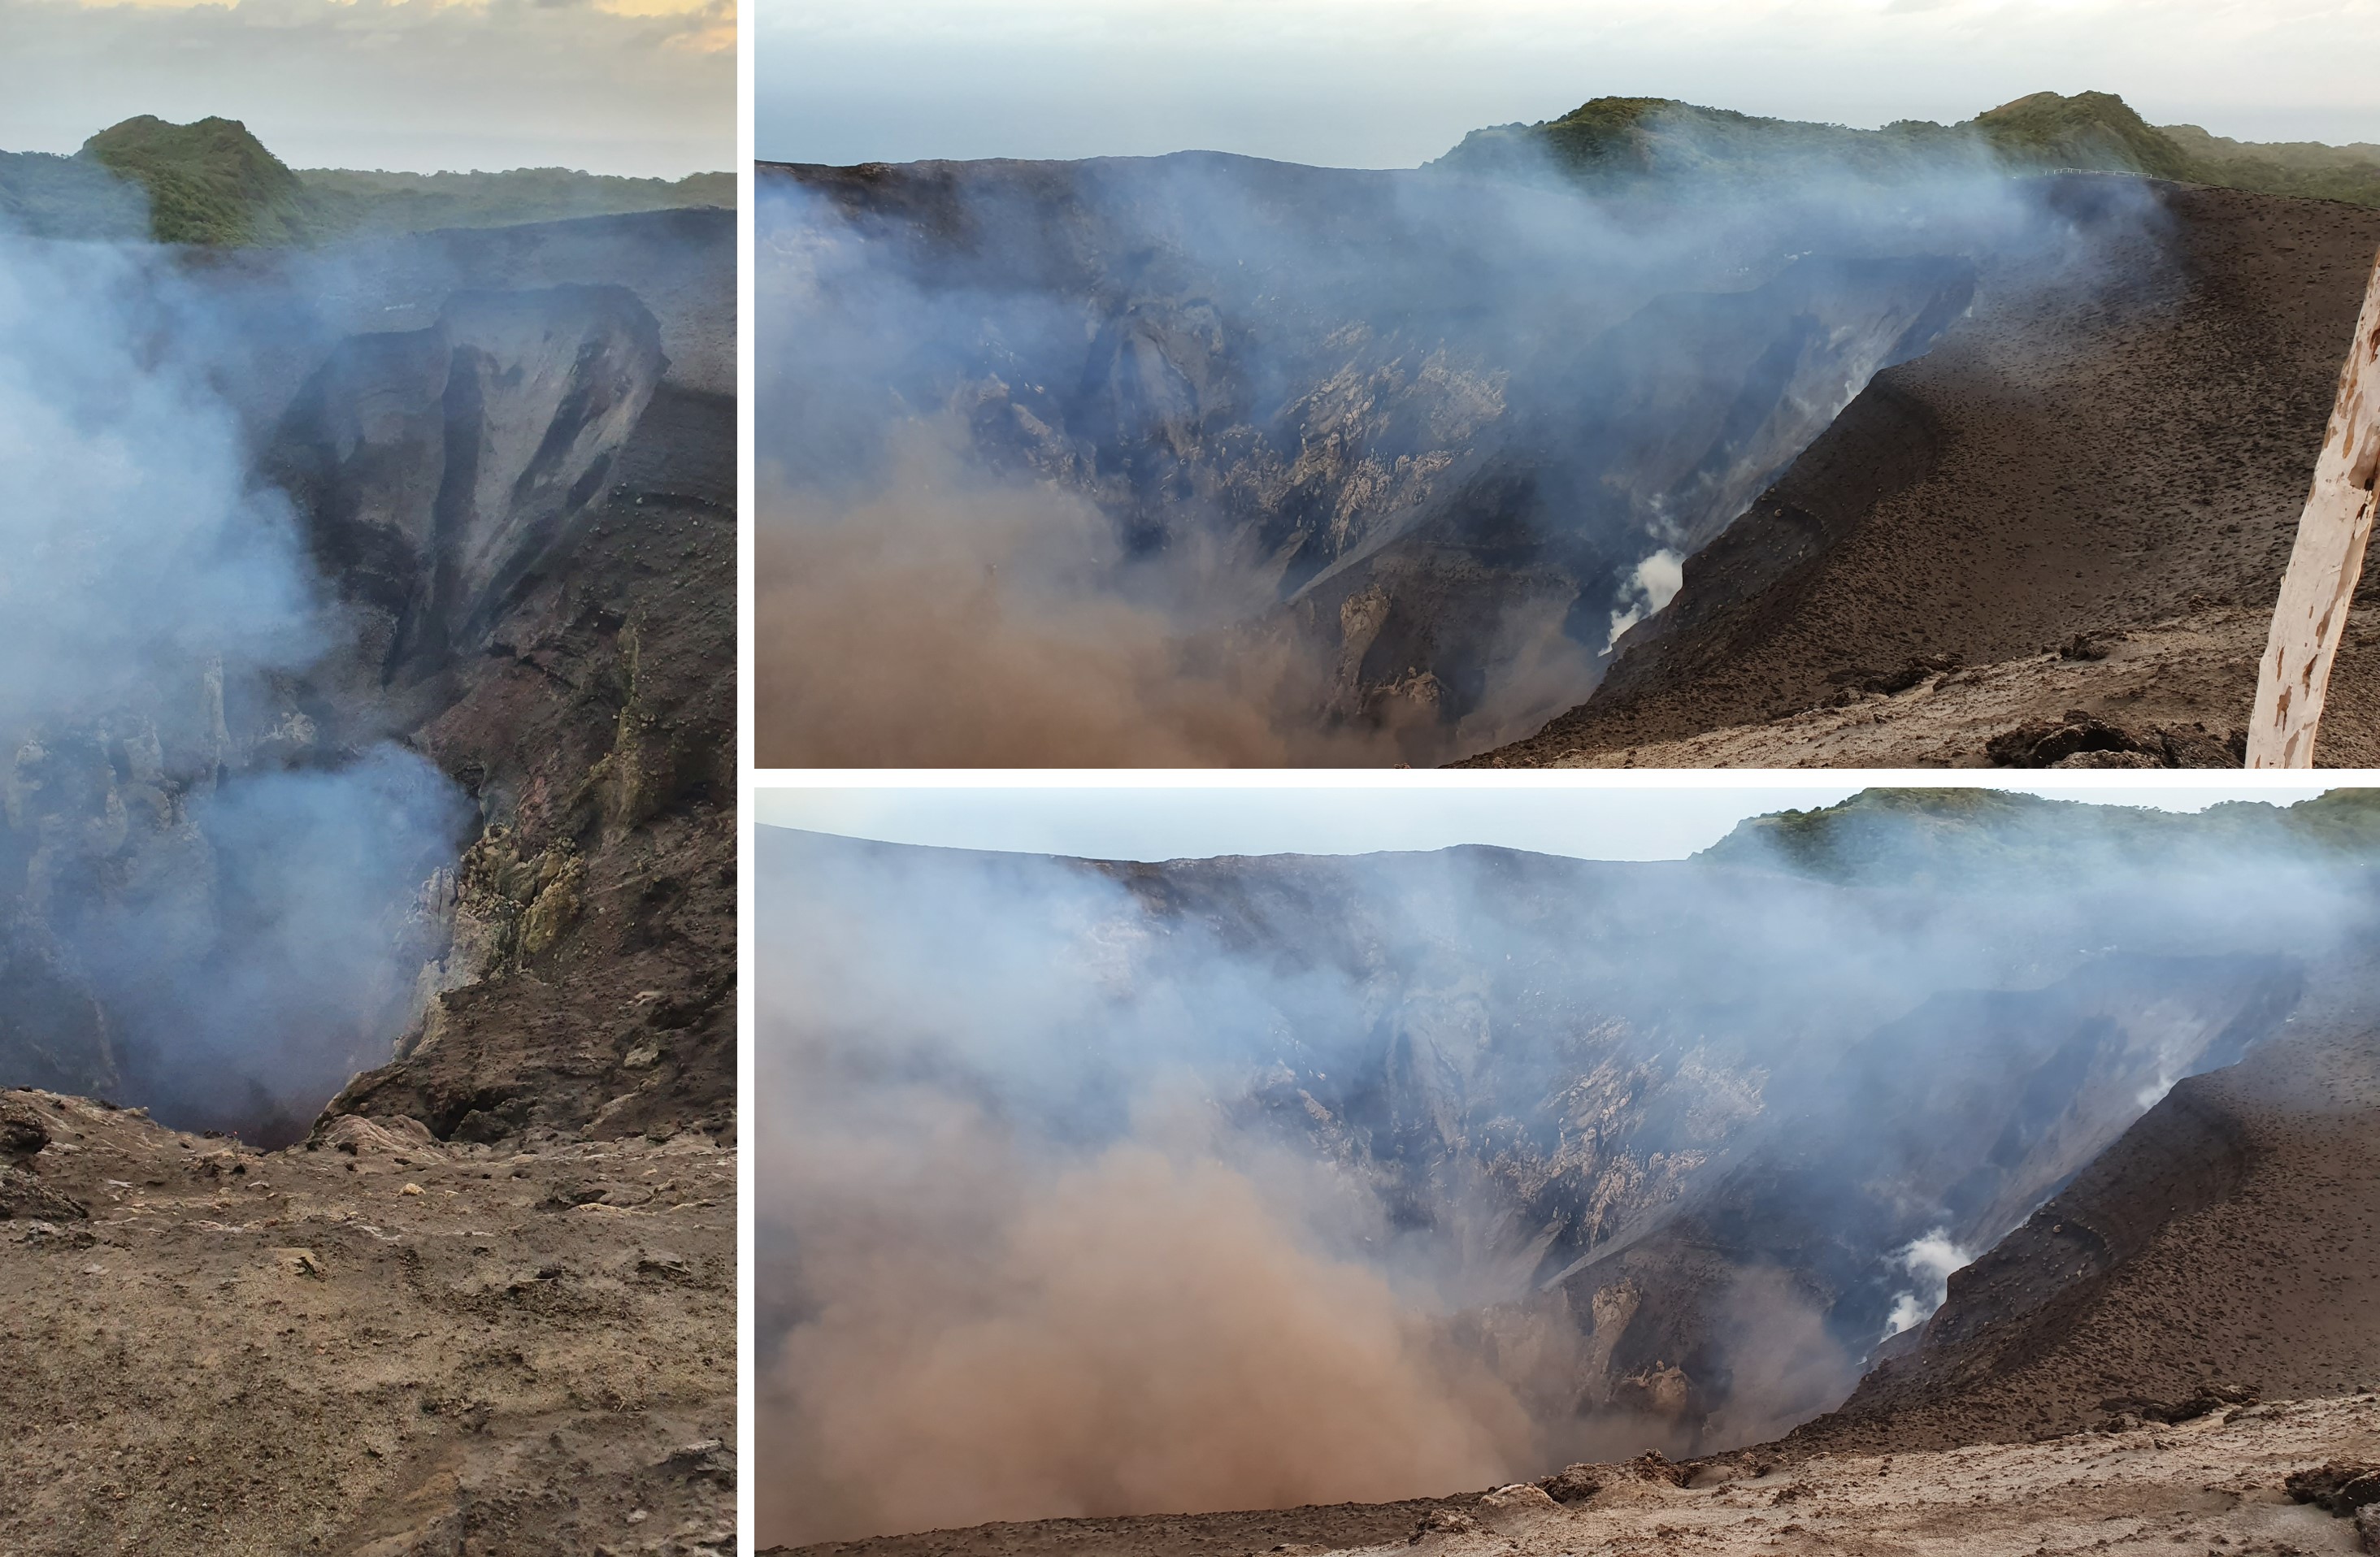
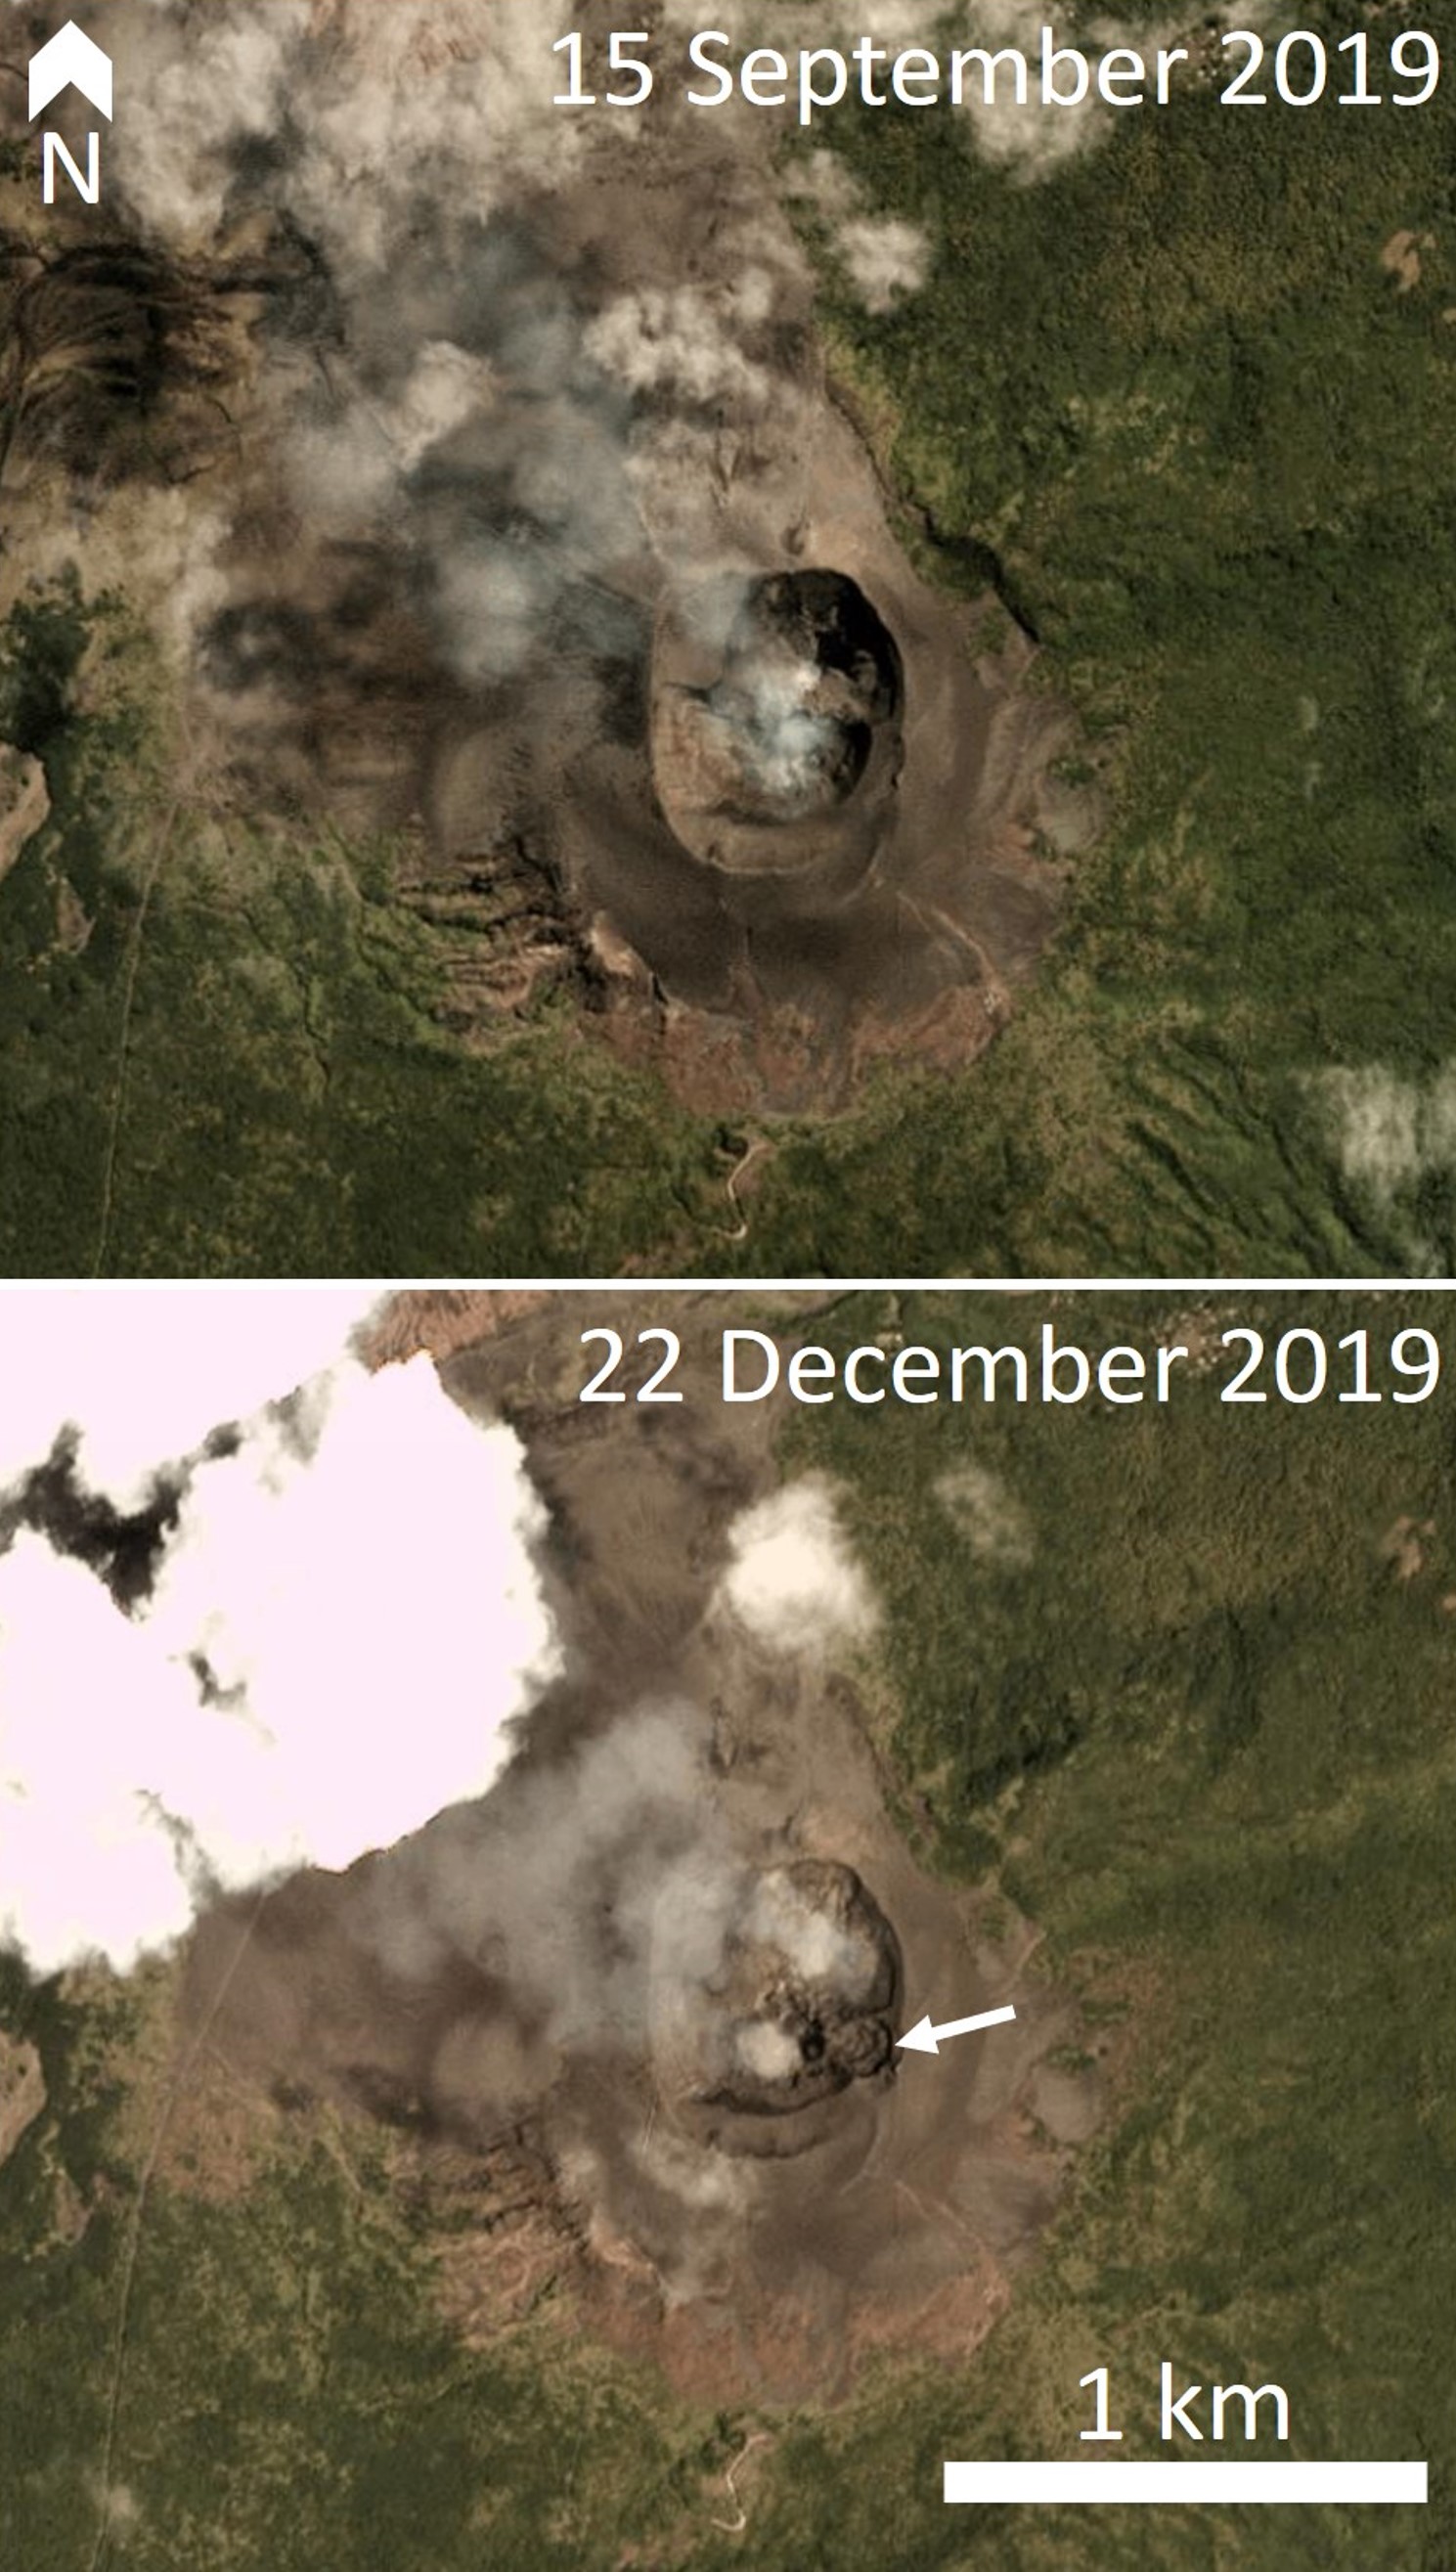
No VMGD report was available for August, but Strombolian activity continued with gas emissions and explosions, as documented by visitors (figure 62). The eruption continued through September and October with some strong explosions and multiple active vents visible in thermal satellite imagery (figure 63). Strombolian explosions ejecting fluid lava from rapidly expanding gas bubbles were recorded during October, and likely represented the typical activity during the surrounding months (figure 64). Along with vigorous degassing producing a persistent plume there was occasional ash content (figure 65). At some point during 20-29 October a small landslide occurred along the eastern inner wall of the crater, visible in satellite images and later confirmed to have produced ashfall at the summit (figure 66).
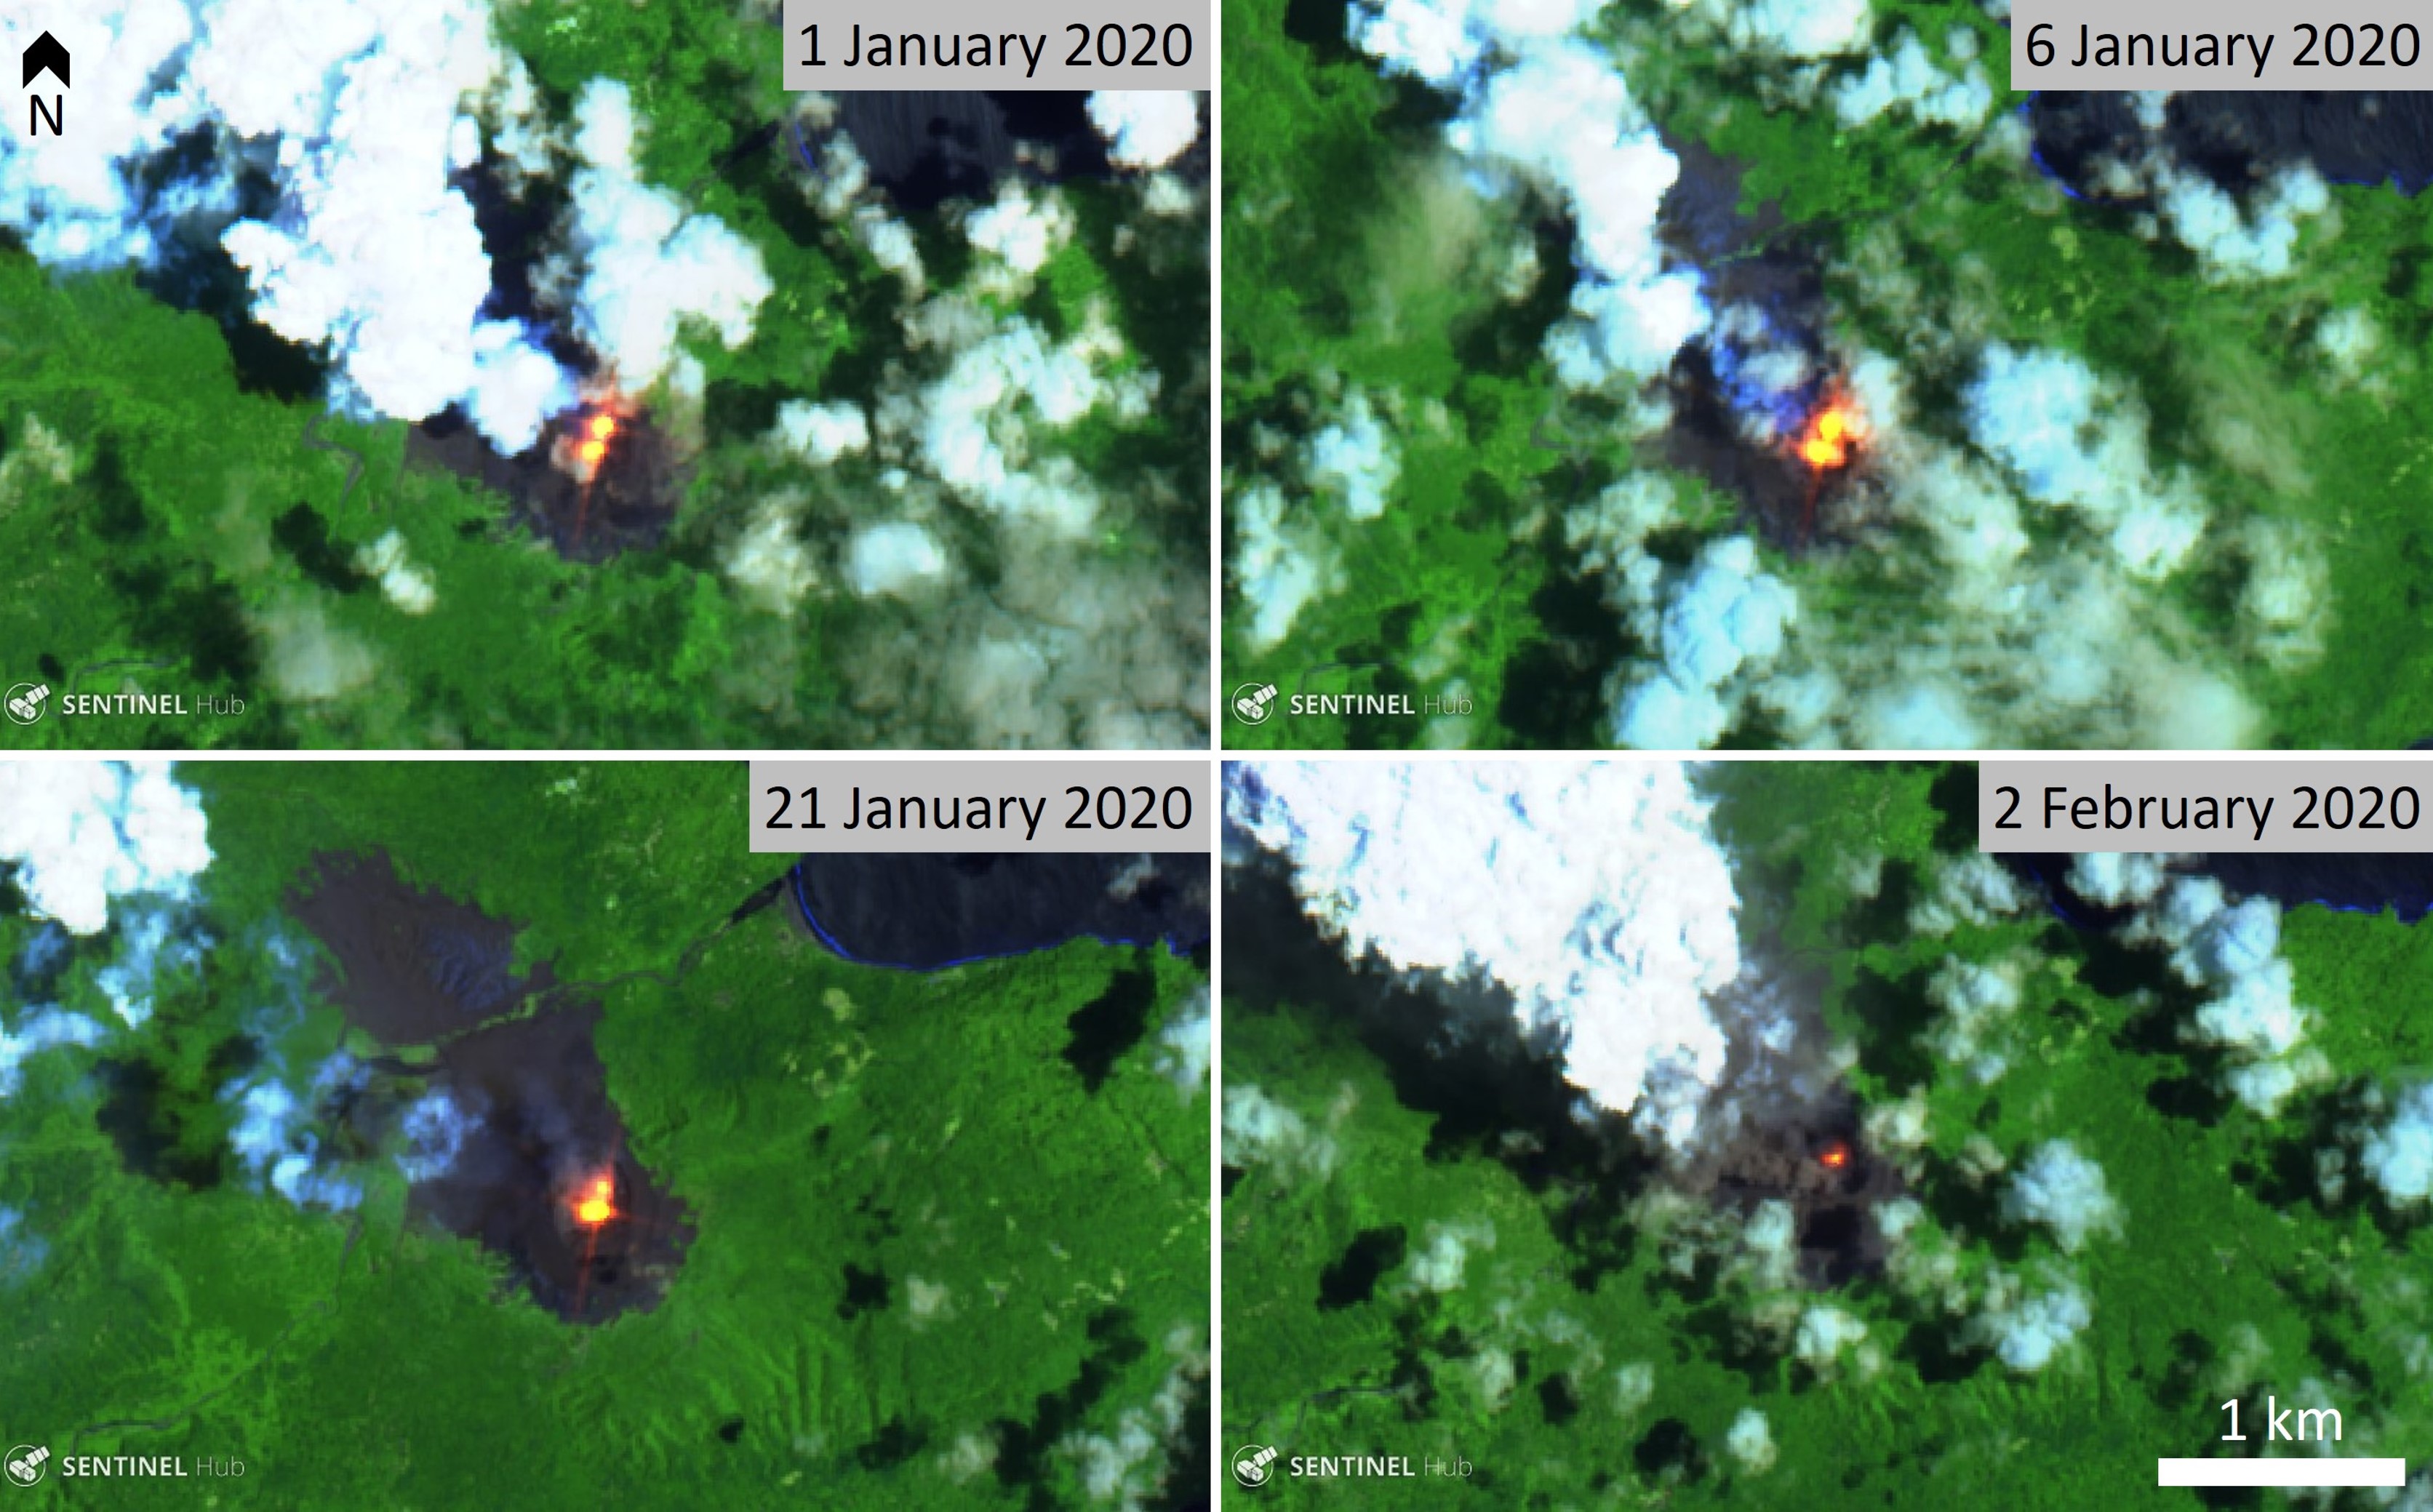
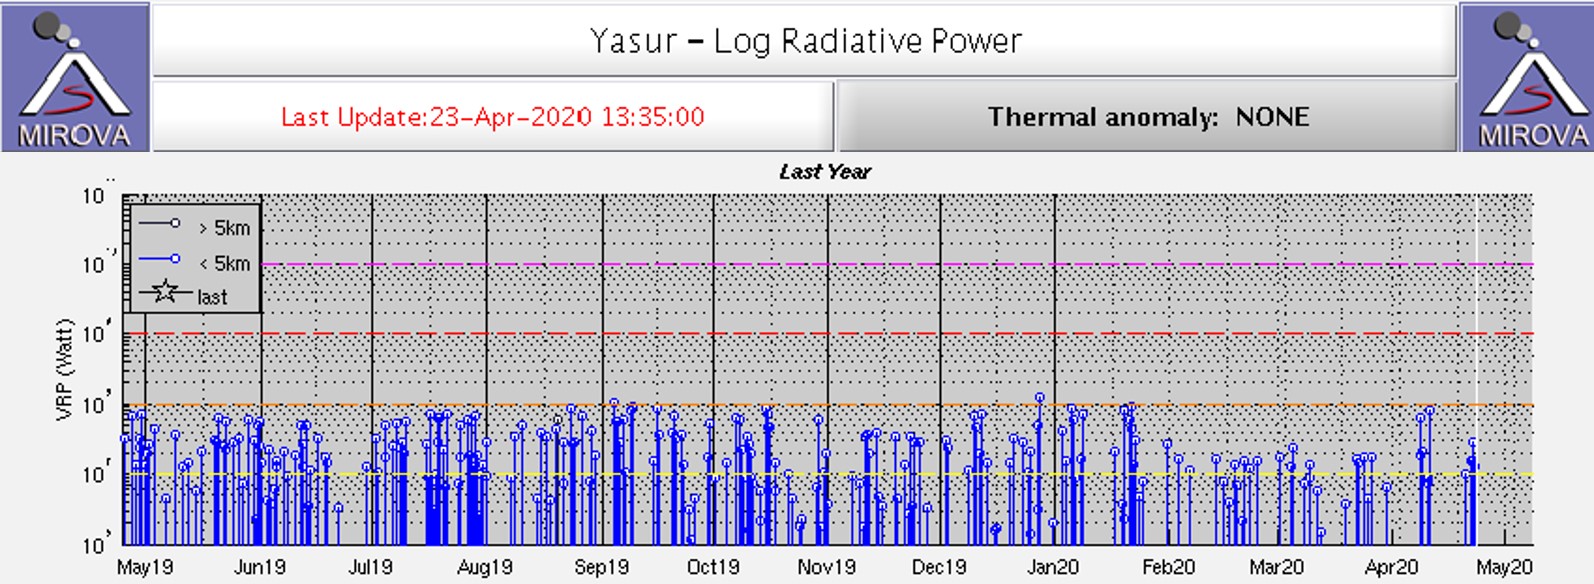
Continuous explosive activity continued in November-February with some stronger explosions recorded along with accompanying gas emissions. Gas plumes of sulfur dioxide were detected by satellite sensors on some days through this period (figure 67) and ash content was present at times (figure 68). Thermal anomalies continued to be detected by satellite sensors with varying intensity, and with a reduction in intensity in February, as seen in Sentinel-2 imagery and the MIROVA system (figures 69 and 70).
Geological Summary. Yasur has exhibited essentially continuous Strombolian and Vulcanian activity at least since Captain Cook observed ash eruptions in 1774. This style of activity may have continued for the past 800 years. Located at the SE tip of Tanna Island in Vanuatu, this pyroclastic cone has a nearly circular, 400-m-wide summit crater. The active cone is largely contained within the small Yenkahe caldera, and is the youngest of a group of Holocene volcanic centers constructed over the down-dropped NE flank of the Pleistocene Tukosmeru volcano. The Yenkahe horst is located within the Siwi ring fracture, a 4-km-wide open feature associated with eruption of the andesitic Siwi pyroclastic sequence. Active tectonism along the Yenkahe horst accompanying eruptions has raised Port Resolution harbor more than 20 m during the past century.
Information Contacts: Geo-Hazards Division, Vanuatu Meteorology and Geo-Hazards Department (VMGD), Ministry of Climate Change Adaptation, Meteorology, Geo-Hazards, Energy, Environment and Disaster Management, Private Mail Bag 9054, Lini Highway, Port Vila, Vanuatu (URL: http://www.vmgd.gov.vu/, https://www.facebook.com/VanuatuGeohazardsObservatory/); MIROVA (Middle InfraRed Observation of Volcanic Activity), a collaborative project between the Universities of Turin and Florence (Italy) supported by the Centre for Volcanic Risk of the Italian Civil Protection Department (URL: http://www.mirovaweb.it/); Sentinel Hub Playground (URL: https://www.sentinel-hub.com/explore/sentinel-playground); Planet Labs, Inc. (URL: https://www.planet.com/); Global Sulfur Dioxide Monitoring Page, Atmospheric Chemistry and Dynamics Laboratory, NASA Goddard Space Flight Center (NASA/GSFC), 8800 Greenbelt Road, Goddard, Maryland, USA (URL: https://so2.gsfc.nasa.gov/); Justin Noonan (URL: https://www.justinnoonan.com/, Instagram: https://www.instagram.com/justinnoonan_/); Doro Adventures (Twitter: https://twitter.com/DoroAdventures, URL: http://doroadventures.com/).