Nishinoshima
Japan
27.247°N, 140.874°E; summit elev. 100 m
All times are local (unless otherwise noted)
After 40 years of dormancy, Japan’s Nishinoshima volcano, located about 1,000 km S of Tokyo in the Ogasawara Arc, erupted above sea level in November 2013. Lava flows were active through November 2015, emerging from a central pyroclastic cone. A new eruption in mid-2017 continued the growth of the island with ash plumes, ejecta, and lava flows. A short eruptive event in July 2018 produced a new lava flow and vent on the side of the pyroclastic cone. The next eruption of ash plumes, incandescent ejecta, and lava flows, covered in this report, began in early December 2019 and was ongoing through February 2020. Information is provided primarily from the Japan Meteorological Agency (JMA) monthly reports.
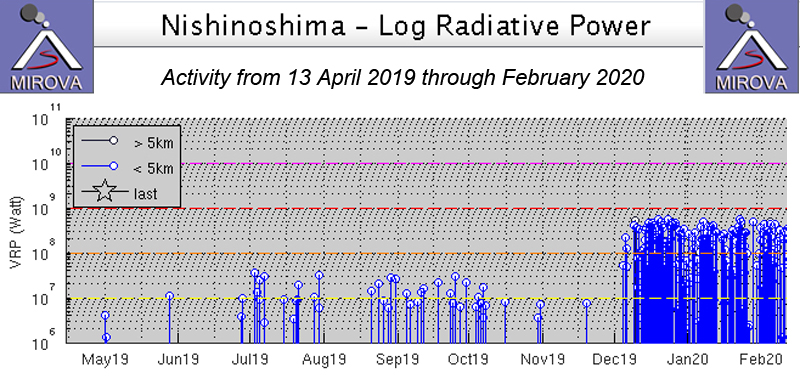
Nishinoshima remained quiet after a short eruptive event in July 2018 until MODVOLC thermal alerts appeared on 5 December 2019. Multiple near-daily alerts continued through February 2020. The intermittent low-level thermal anomalies seen in the MIROVA data beginning in May and June 2019 may reflect areas with increased temperatures and fumarolic activity reported by the Japan Coast Guard during overflights in June and July. The significant increase in thermal anomalies in the MIROVA data on 5 December correlates with the beginning of extrusive and explosive activity (figure 63). Eruptive activity included ash emissions, incandescent ejecta, and numerous lava flows from multiple vents that flowed into the sea down several flanks, significantly enlarging the island.
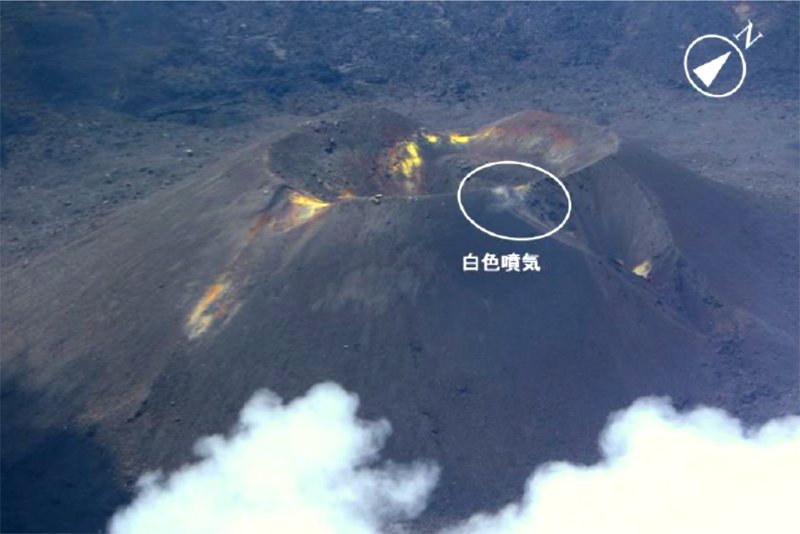
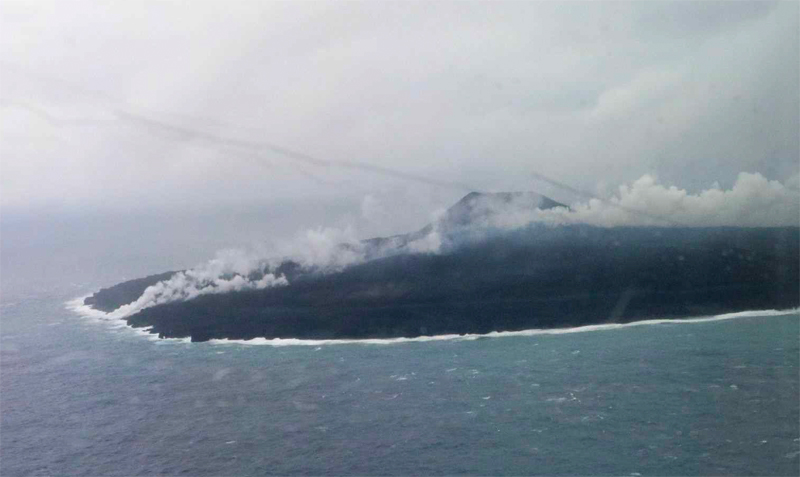
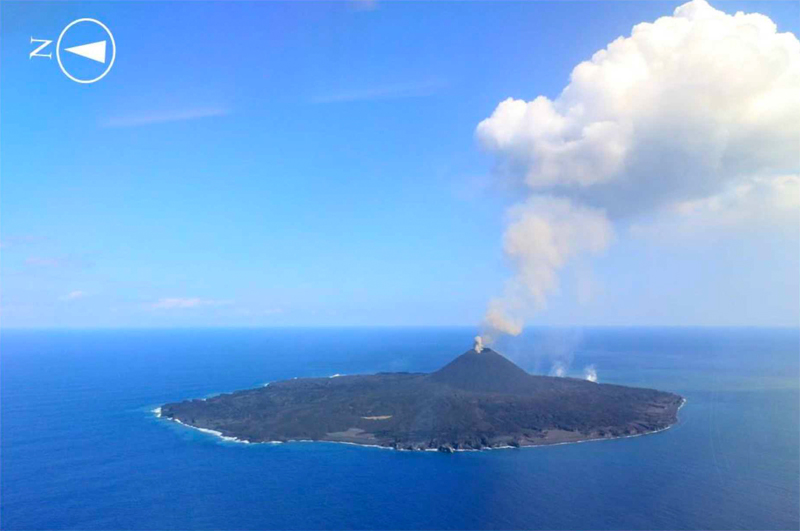
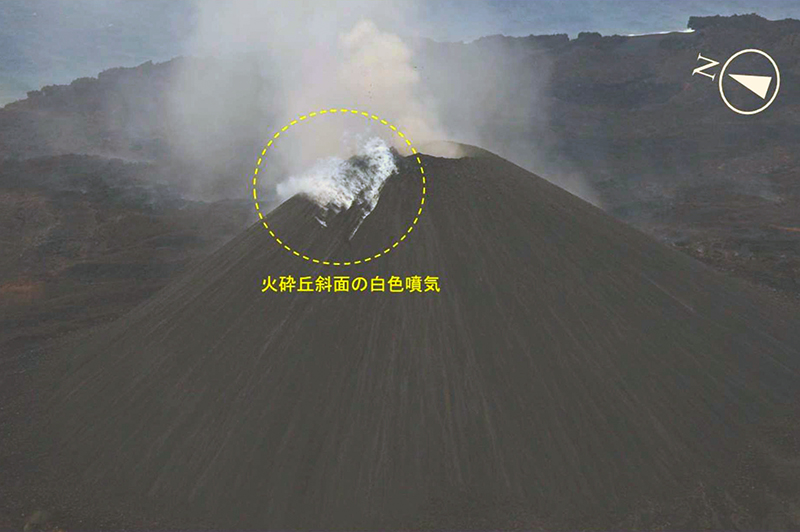
A brief period of activity during 12-21 July 2018 produced explosive activity with blocks and bombs ejected 500 m from a new vent on the E flank of the pyroclastic cone, and a 700-m-long lava flow that stopped about 100 m before reaching the ocean (BGVN 43:09). No further activity was reported during 2018. During overflights on 29 and 31 January, and 7 February 2019, white steam plumes drifted from the E crater margin and inner wall of the pyroclastic cone and discolored waters were present around the island, but no other signs of activity were reported. A survey carried out by the Japan Coast Guard during 7-8 June 2019 reported minor fumarolic activity from the summit crater, and high-temperature areas were noted on the hillsides, measured by infrared thermal imaging equipment. Sulfur dioxide emissions were below the detection limit. In an overflight on 12 July 2019, Coast Guard personnel noted a small white plume rising from the E edge of the summit crater of the pyroclastic cone (figure 64).
The white plume was still present during an overflight on 14 August 2019. Greenish yellow areas of water about 500 m wide were distributed around the island, and a plume of green water extended 1.8 km from the NW coast. Similar conditions were observed on 15 October 2019; pale yellow-green discolored water was about 100 m wide and concentrated on the N shore of Nishinoshima. No steam plume from the summit was present during a visit on 19 November 2019, but yellow-white discolored water on the N shore was about 100 m wide and 700 m long. Along the NE and SE coasts, yellow-white water was 100-200 m wide and about 1,000 m long.
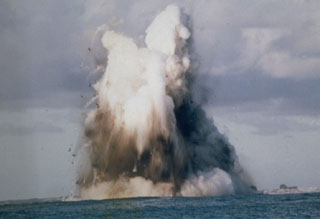
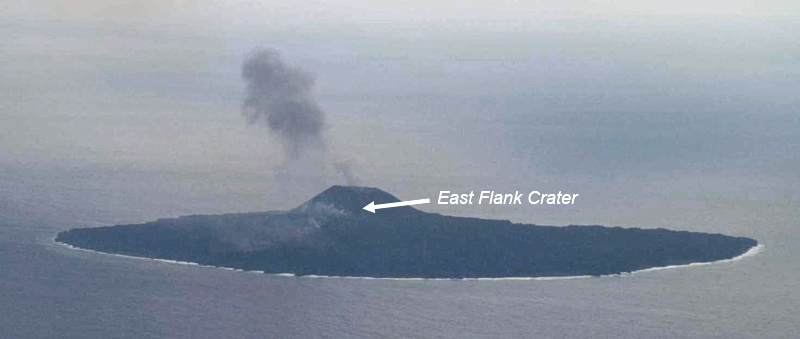
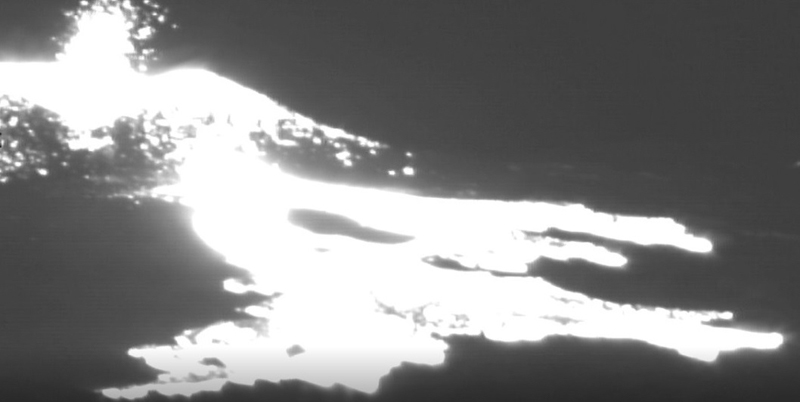
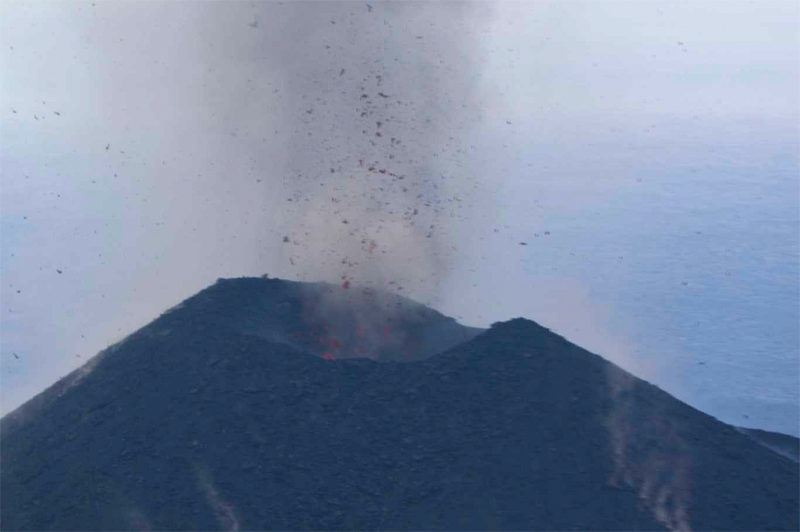
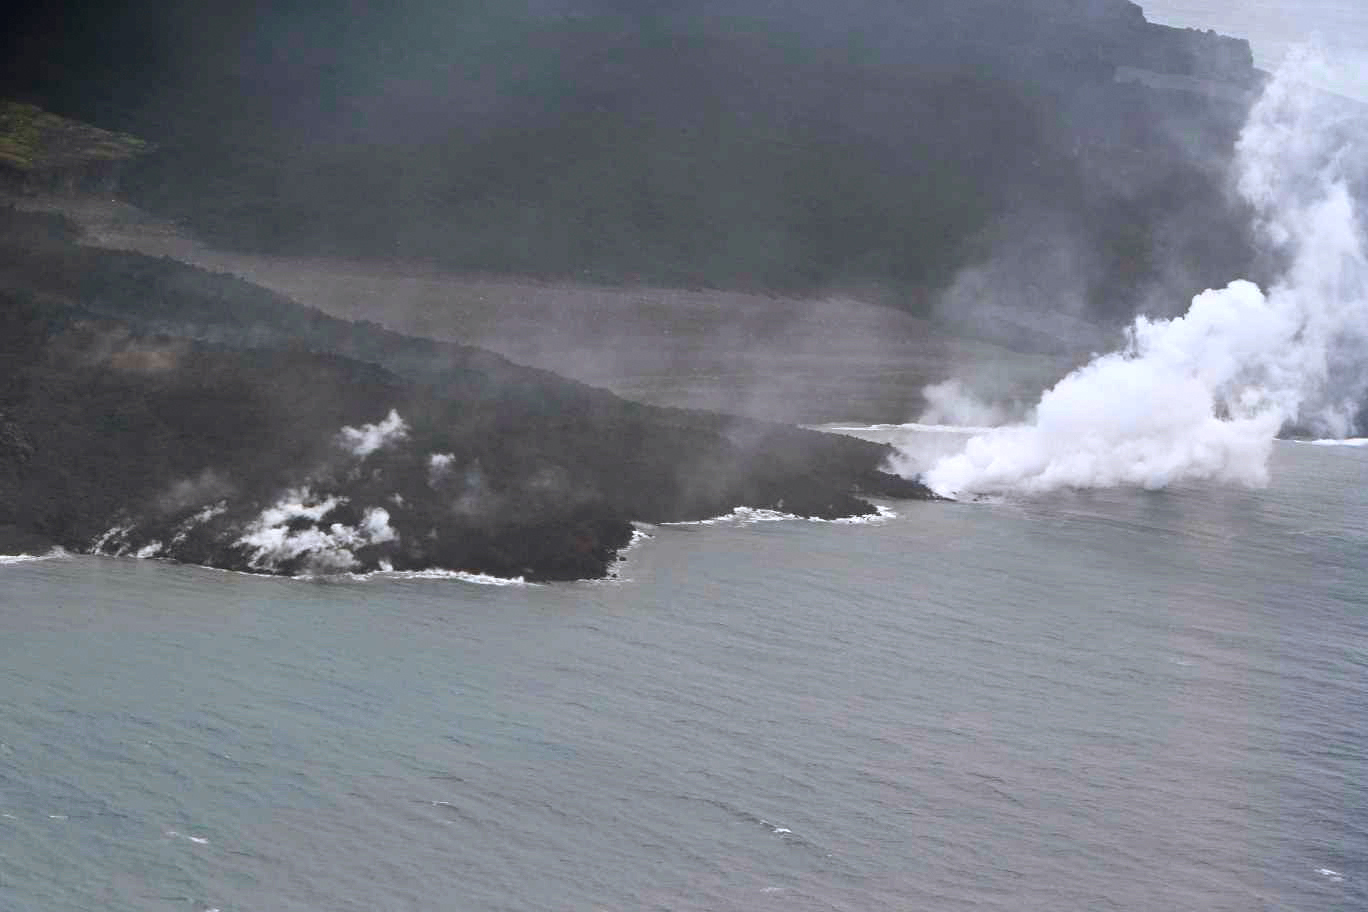
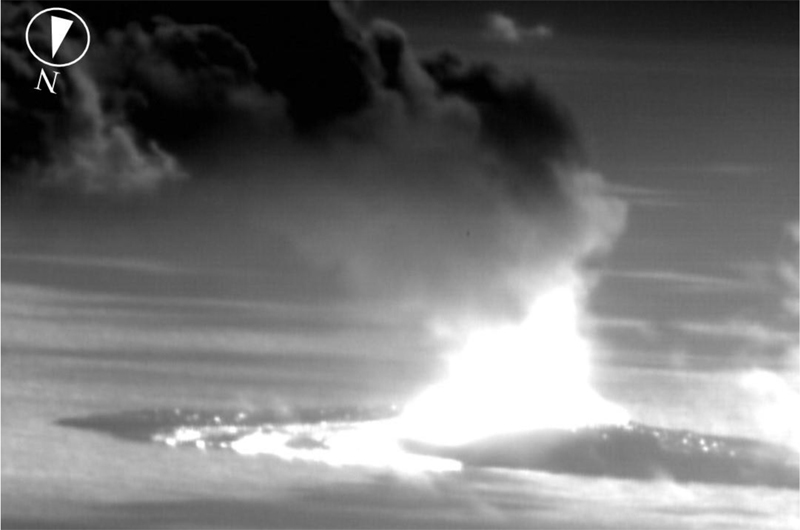
A MODVOLC thermal alert appeared at Nishinoshima on 5 December 2019. An eruption was observed by the Japan Coast Guard the following day. A pulsating light gray ash plume rose from the summit crater accompanied by tephra ejected 200 m above the crater rim every few minutes (figure 65). In addition, ash and tephra rose intermittently from a crater on the E flank of the pyroclastic cone, from which lava also flowed down towards the E coast (figure 66). By 1300 on 7 December the lava was flowing into the sea (figure 67).
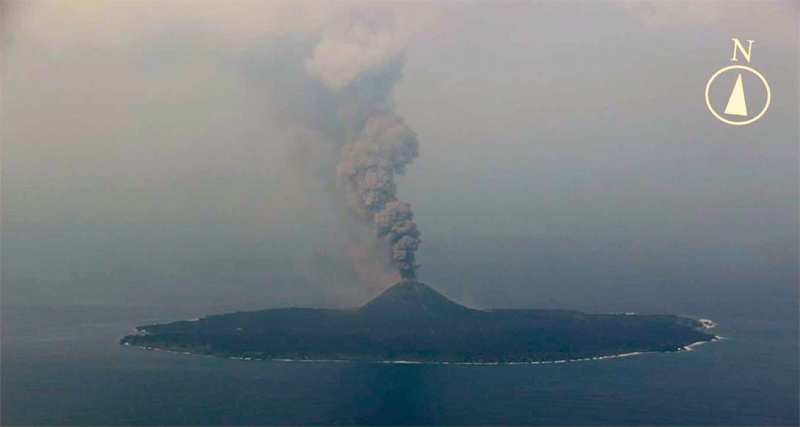
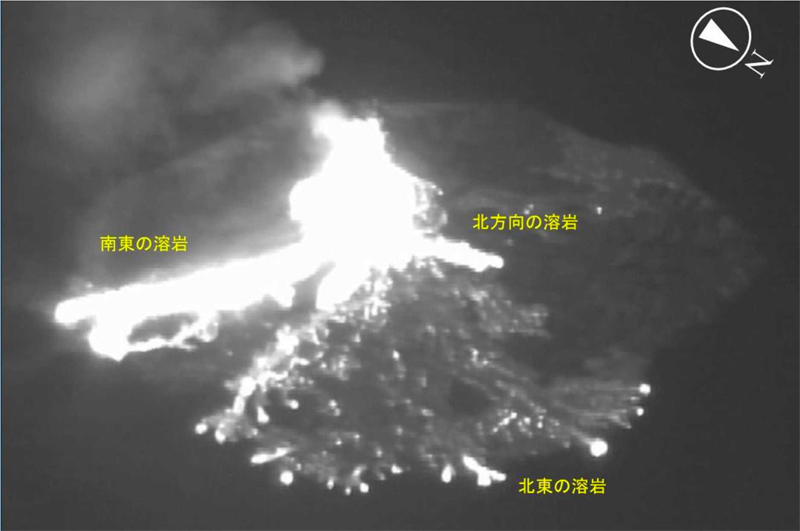
Observations by the Japan Coast Guard on 15 December 2019 confirmed that vigorous eruptive activity was ongoing; incandescent ejecta and ash plumes rose 300 m above the summit crater rim (figure 68). A new vent had opened on the N flank of the cone from which lava flowed NW to the sea (figure 69). The lava flow from the E-flank crater also remained active and continued flowing into the sea. The Tokyo VAAC reported an ash emission on 24 December that rose to 1,000 m altitude and drifted S. On 31 December, explosions at the summit continued every few seconds with ash and ejecta rising 300 m high. In addition, lava from the NE flank of the pyroclastic cone flowed NE to the sea (figure 70).
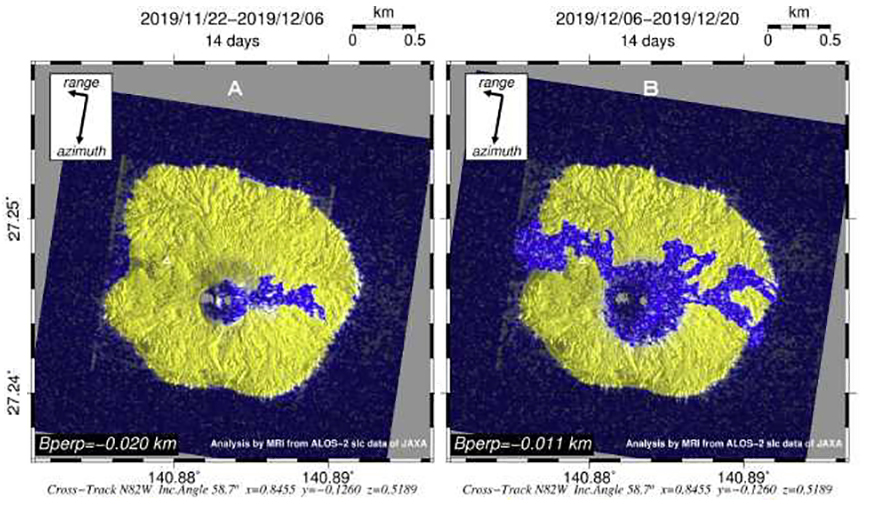
Satellite data from JAXA (Japan Aerospace Exploration Agency) made it possible for JMA to produce maps showing the rapid changes in topography at Nishinoshima resulting from the new lava flows. The new E-flank lava flow was readily seen when comparing imagery from 22 November with 6 December 2019 (figure 71a). An image from 6 December compared with 20 December 2019 shows the flow on the E flank splitting and entering the sea at two locations (figure 71b), the flow on the NW flank traveling briefly N before turning W and forming a large fan into the ocean on the W flank, and a new flow heading NE from the summit area of the pyroclastic cone.
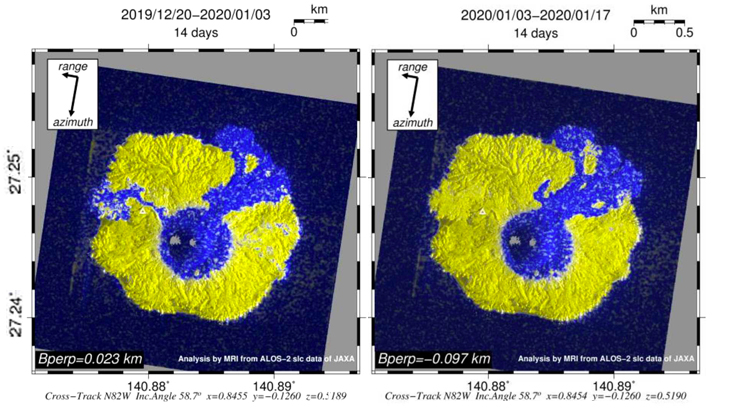
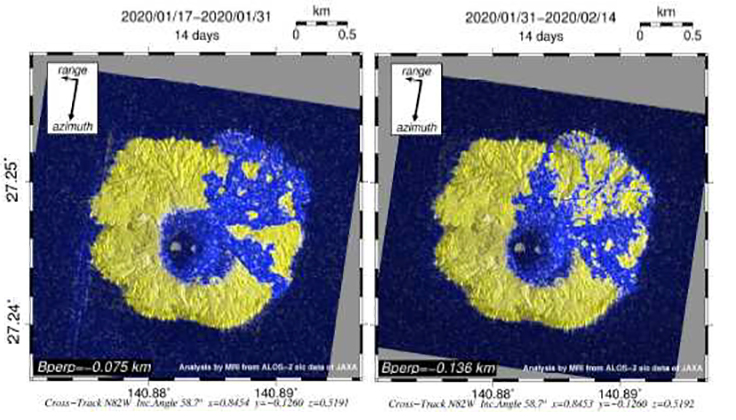
The Tokyo VAAC reported an ash plume visible in satellite imagery on 15 January 2020 that rose to 1.8 km altitude and drifted SE. The Japan Coast Guard conducted an overflight on 17 January that confirmed the continued eruptions of ash, incandescent ejecta, and lava. Dark gray ash plumes were observed at 1.8 km altitude, with ashfall and tephra concentrated around the pyroclastic cone (figure 72). Plumes of steam were visible where the NE lava flow entered the ocean; the E and NW lava entry areas did not appear active but were still hot. Satellite data from ALOS-2 prepared by JAXA confirmed ongoing activity around the summit vent and on the NE flank, while activity on the W flank had ceased (figure 73). An ash plume was reported by the Tokyo VAAC on 25 January; it rose to 1.5 km altitude and drifted SW for most of the day.
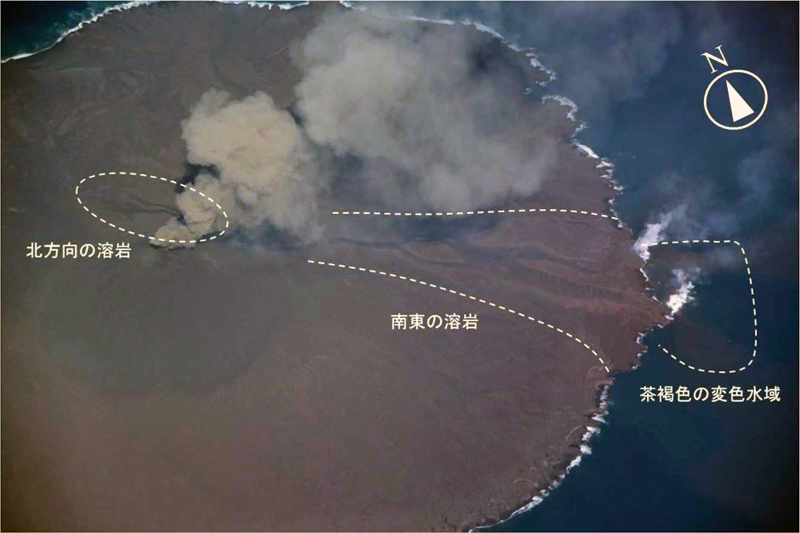
On 3 Feburary 2020 the Tokyo VAAC reported an ash plume visible in satellite imagery that rose to 2.1 km altitude and drifted E. The following day the Japan Coast Guard observed eruptions from the summit crater at five minute intervals that produced grayish white plumes. The plumes rose to 2.7 km altitude (figure 74). Large bombs were scattered around the pyroclastic cone, and the summit crater appeared filled with lava except for the active vent. The lava deltas on the NE flank were only active at the tips of the flows producing a few steam jets where lava entered the sea. The active flows were on the SE flank, and a new 200-m-long lava flow was flowing down the N flank of the pyroclastic cone (figure 75). The lava flowing from the E flank of the pyroclastic cone to the SE into the sea, produced larger jets of steam (figure 76). Yellow-brown discolored water appeared around the island in several places.
JAXA satellite data confirmed that the flow activity was concentrated on the NE flank and shore during the second half of January 2020, but also recorded the new flow down the SE flank that was observed by the Coast Guard in early February. By mid-February the satellite topographic data indicated the decrease in activity in the NE flank flows, the increased activity on the SE and E flank, and the extension of the flow moving due N to the coast (figure 77). Observations on 17 February 2020 by the Japan Coast Guard revealed eruptions from the summit crater every few seconds, and steam-and-ash plumes rising about 600 m. Vigorous white emissions rose from fractures near the top of the W flank of the pyroclastic cone, but thermal data indicated the area was no hotter than the surrounding area (figure 78). The lava flow on the SE coast still had steam emissions rising from the ocean entry point, but activity was weaker than on 4 February. The newest flow moving due N from the summit produced steam emissions where the flow front entered the ocean.
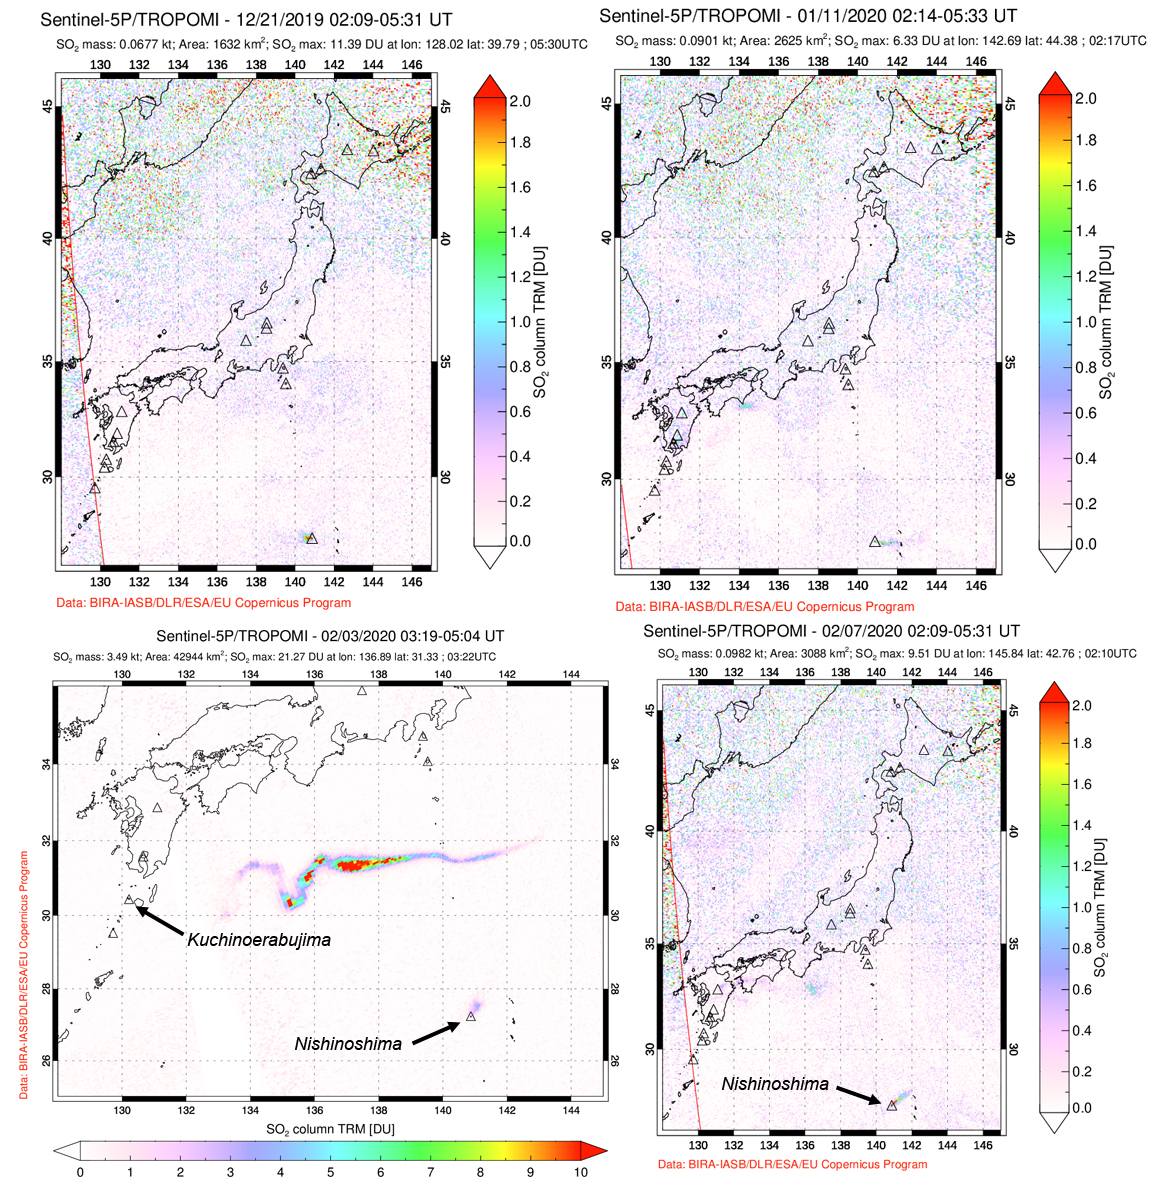
Sulfur dioxide plumes from Nishinoshima have been small and infrequent in recent years, but the renewed and increased eruptive activity beginning in December 2019 produced several small SO2 plumes that were recorded in daily satellite data (figure 79).
Geological Summary. The small island of Nishinoshima was enlarged when several new islands coalesced during an eruption in 1973-74. Multiple eruptions that began in 2013 completely covered the previous exposed surface and continued to enlarge the island. The island is the summit of a massive submarine volcano that has prominent peaks to the S, W, and NE. The summit of the southern cone rises to within 214 m of the ocean surface 9 km SSE.
Information Contacts: Japan Meteorological Agency (JMA), Otemachi, 1-3-4, Chiyoda-ku Tokyo 100-8122, Japan (URL: http://www.jma.go.jp/jma/indexe.html); Japan Aerospace Exploration Agency-Earth Observation Research Center (JAXA-EORC), 7-44-1 Jindaiji Higashi-machi, Chofu-shi, Tokyo 182-8522, Japan (URL: http://www.eorc.jaxa.jp/); Japan Coast Guard (JCG) Volcano Database, Hydrographic and Oceanographic Department, 3-1-1, Kasumigaseki, Chiyoda-ku, Tokyo 100-8932, Japan (URL: http://www.kaiho.mlit.go.jp/info/kouhou/h29/index.html, http://www1.kaiho.mlit.go.jp/GIJUTSUKOKUSAI/kaiikiDB/kaiyo18-e1.htm); MIROVA (Middle InfraRed Observation of Volcanic Activity), a collaborative project between the Universities of Turin and Florence (Italy) supported by the Centre for Volcanic Risk of the Italian Civil Protection Department (URL: http://www.mirovaweb.it/); Tokyo Volcanic Ash Advisory Center (VAAC), 1-3-4 Otemachi, Chiyoda-ku, Tokyo, Japan (URL: http://ds.data.jma.go.jp/svd/vaac/data/); Global Sulfur Dioxide Monitoring Page, Atmospheric Chemistry and Dynamics Laboratory, NASA Goddard Space Flight Center (NASA/GSFC), 8800 Greenbelt Road, Goddard, Maryland, USA (URL: https://so2.gsfc.nasa.gov/); Simon Carn, Geological and Mining Engineering and Sciences, Michigan Technological University, 1400 Townsend Drive, Houghton, MI 49931, USA (URL: http://www.volcarno.com/, Twitter: @simoncarn).