Report on Cleveland (United States) — March 2020
Bulletin of the Global Volcanism Network, vol. 45, no. 3 (March 2020)
Managing Editor: Edward Venzke.
Edited by Kadie L. Bennis.
Cleveland (United States) Intermittent thermal anomalies and lava dome subsidence, February 2019-January 2020
Please cite this report as:
Global Volcanism Program, 2020. Report on Cleveland (United States) (Bennis, K.L., and Venzke, E., eds.). Bulletin of the Global Volcanism Network, 45:3. Smithsonian Institution. https://doi.org/10.5479/si.GVP.BGVN202003-311240
Cleveland
United States
52.825°N, 169.944°W; summit elev. 1730 m
All times are local (unless otherwise noted)
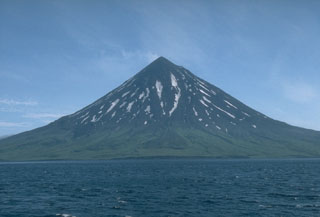
Cleveland is a stratovolcano located in the western portion of Chuginadak Island, a remote island part of the east central Aleutians. Common volcanism has included small lava flows, explosions, and ash clouds. Intermittent lava dome growth, small ash explosions, and thermal anomalies have characterized more recent activity (BGVN 44:02). For this reporting period during February 2019-January 2020, activity largely consisted of gas-and-steam emissions and intermittent thermal anomalies within the summit crater. The primary source of information comes from the Alaska Volcano Observatory (AVO) and various satellite data.
Low levels of unrest occurred intermittently throughout this reporting period with gas-and-steam emissions and thermal anomalies as the dominant type of activity (figures 30 and 31). An explosion on 9 January 2019 was followed by lava dome growth observed during 12-16 January. Suomi NPP/VIIRS sensor data showed two hotspots on 8 and 14 February 2019, though there was no evidence of lava within the summit crater at that time. According to satellite imagery from AVO, the lava dome was slowly subsiding during February into early March. Elevated surface temperatures were detected on 17 and 24 March in conjunction with degassing; another gas-and-steam plume was observed rising from the summit on 30 March. Thermal anomalies were again seen on 15 and 28 April using Suomi NPP/VIIRS sensor data. Intermittent gas-and-steam emissions continued as the number of detected thermal anomalies slightly increased during the next month, occurring on 1, 7, 15, 18, and 23 May. A gas-and-steam plume was observed on 9 May.
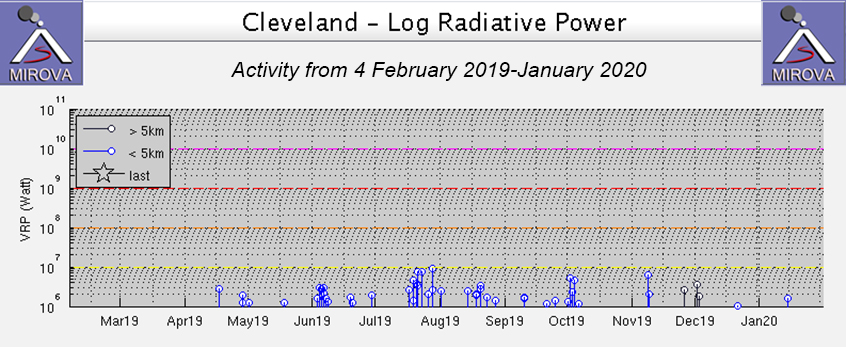 |
Figure 30. The MIROVA graph of thermal activity (log radiative power) at Cleveland during 4 February 2019 through January 2020 shows increased thermal anomalies between mid-April to late November 2019. Courtesy of MIROVA. |
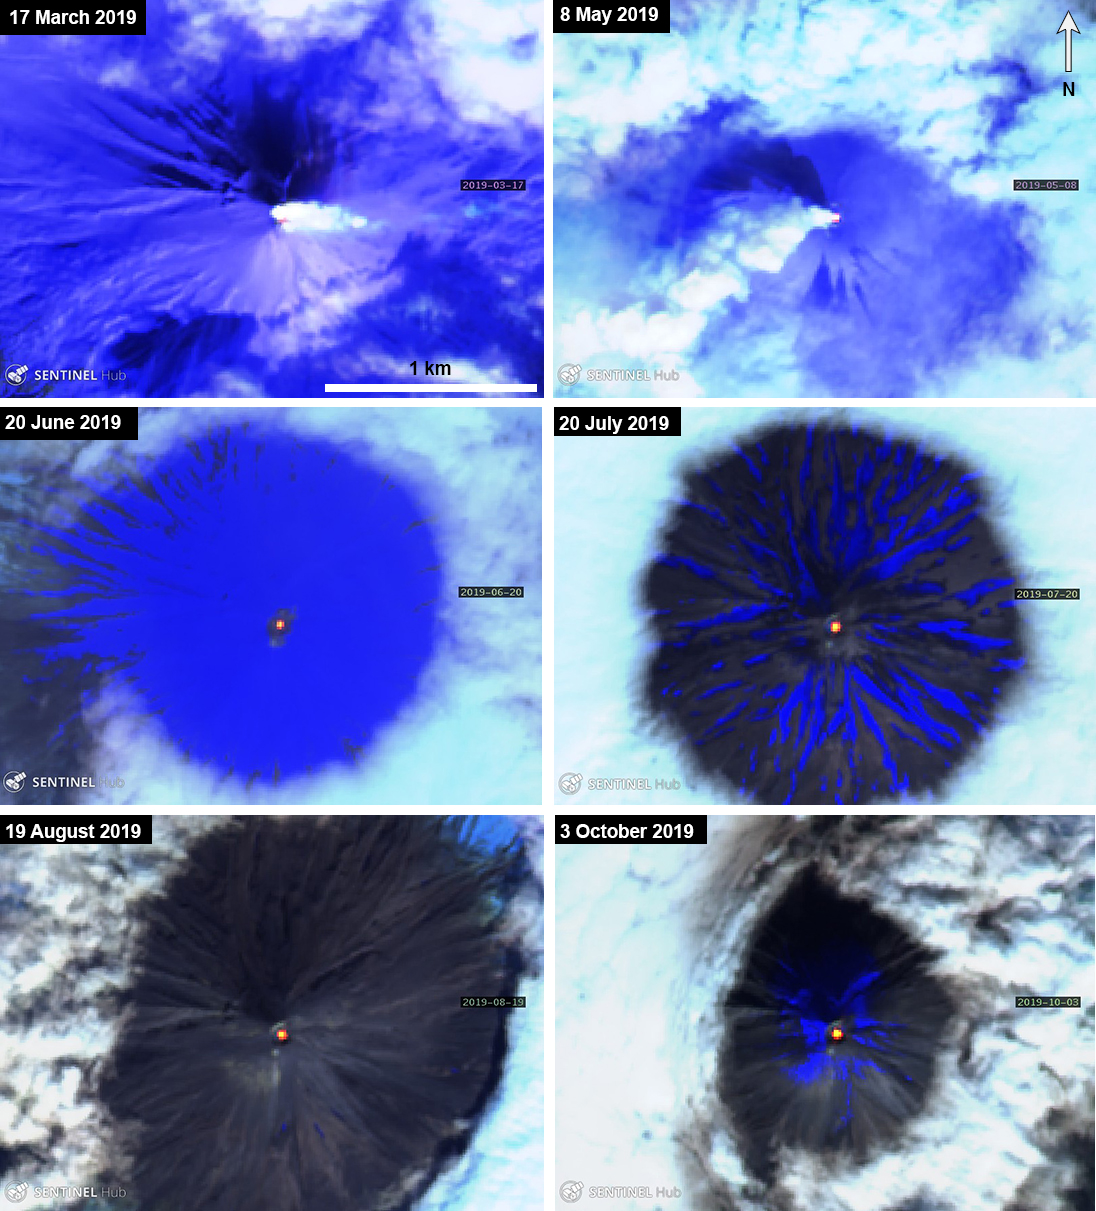 |
Figure 31. Sentinel-2 thermal satellite imagery (bands 12, 11, 8A) confirmed intermittent thermal signatures occurring in the summit crater during March 2019 through October 2019. Some gas-and-steam plumes were observed accompanying the thermal anomaly, as seen on 17 March 2019 and 8 May 2019. Courtesy of Sentinel Hub Playground. |
There were 10 thermal anomalies observed in June, and 11 each in July and August. Typical mild degassing was visible when photographed on 9 August (figure 32). On 14 August, seismicity increased, which included a swarm of a dozen local earthquakes. The lava dome emplaced in January was clearly visible in satellite imagery (figure 33). The number of thermal anomalies decreased the next month, occurring on 10, 21, and 25 September. During this month, a gas-and-steam plume was observed in a webcam image on 6, 8, 20, and 25 September. On 3-6, 10, and 21 October elevated surface temperatures were recorded as well as small gas-and-steam plumes on 4, 7, 13, and 20-25 October.
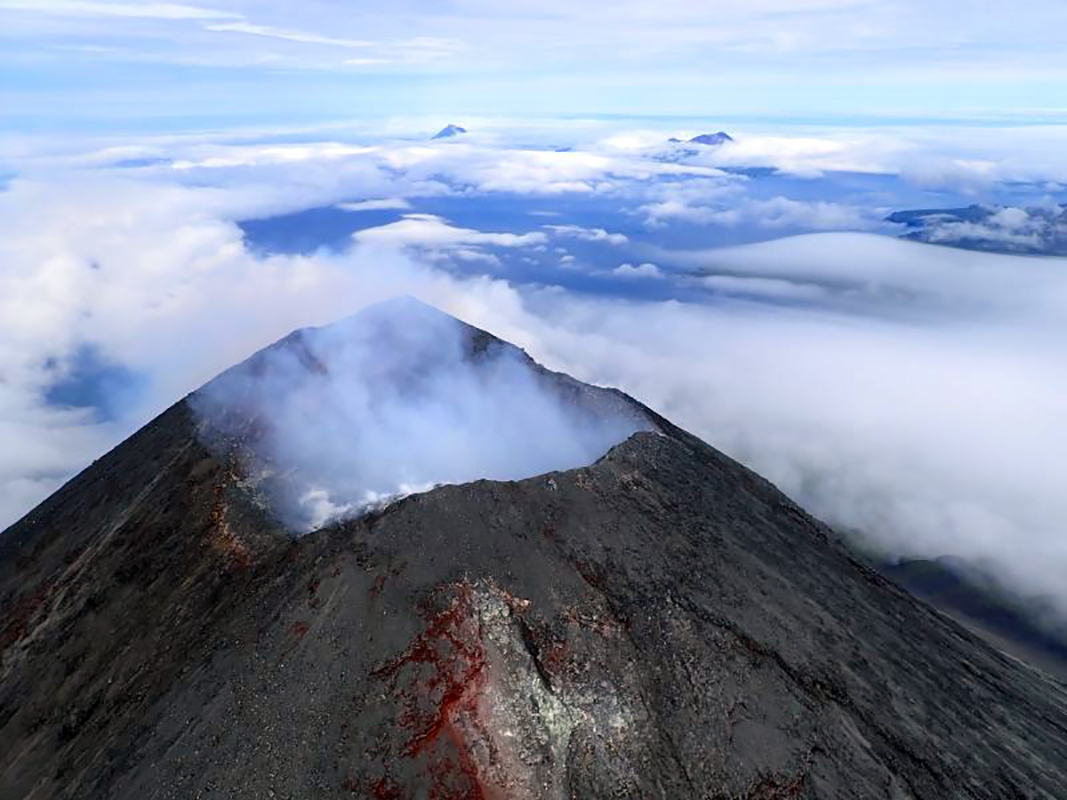 |
Figure 32. Photograph of Cleveland showing mild degassing from the summit vent taken on 9 August 2019. Photo by Max Kaufman; courtesy of AVO/USGS. |
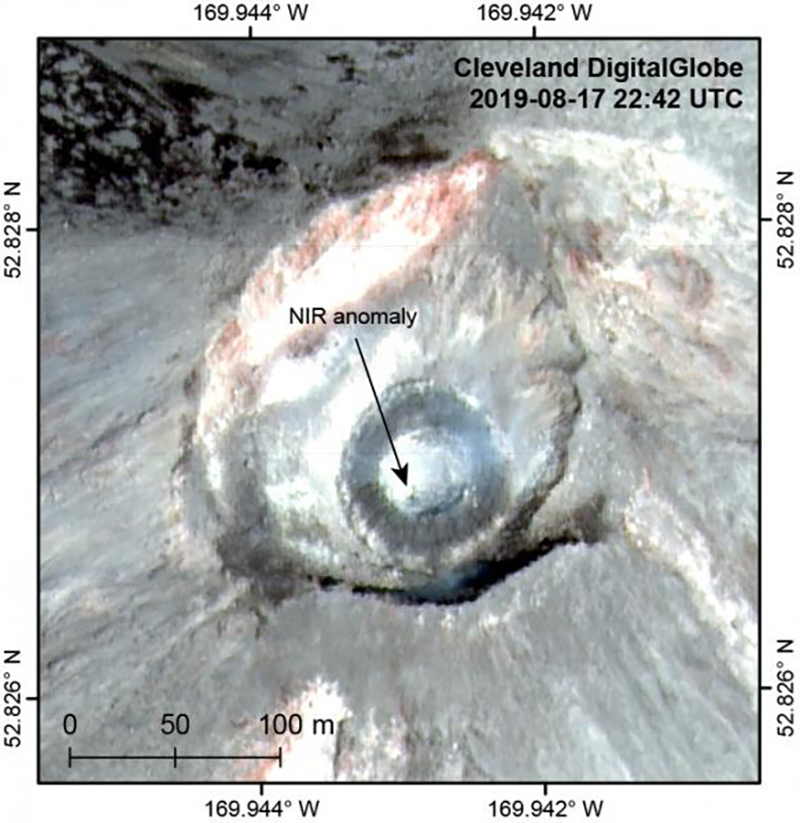 |
Figure 33. Satellite image of Cleveland showing faint gas-and-steam emissions rising from the summit crater. High-resolution image taken on 17 August 2019 showing the lava dome from January 2019 inside the crater (dark ring). Image created by Hannah Dietterich; courtesy of AVO/USGS and DigitalGlobe. |
Four thermal anomalies were detected on 3, 6, and 8-9 November. According to a VONA report from AVO on 8 November, satellite data suggested possible slow lava effusion in the summit crater; however, by the 15th no evidence of eruptive activity had been seen in any data sources. Another thermal anomaly was observed on 14 January 2020. Gas-and-steam emissions observed in webcam images continued intermittently.
MIROVA (Middle InfraRed Observation of Volcanic Activity) analysis of MODIS satellite data shows intermittent weak thermal anomalies within 5 km of the crater summit during mid-April through November 2019 with a larger cluster of activity in early June, late July and early October (figure 30). Thermal satellite imagery from Sentinel-2 also detected weak thermal anomalies within the summit crater throughout the reporting period, occasionally accompanied by gas-and-steam plumes (figure 31).
Geological Summary. The beautifully symmetrical Mount Cleveland stratovolcano is situated at the western end of the uninhabited Chuginadak Island. It lies SE across Carlisle Pass strait from Carlisle volcano and NE across Chuginadak Pass strait from Herbert volcano. Joined to the rest of Chuginadak Island by a low isthmus, Cleveland is the highest of the Islands of the Four Mountains group and is one of the most active of the Aleutian Islands. The native name, Chuginadak, refers to the Aleut goddess of fire, who was thought to reside on the volcano. Numerous large lava flows descend the steep-sided flanks. It is possible that some 18th-to-19th century eruptions attributed to Carlisle should be ascribed to Cleveland (Miller et al., 1998). In 1944 it produced the only known fatality from an Aleutian eruption. Recent eruptions have been characterized by short-lived explosive ash emissions, at times accompanied by lava fountaining and lava flows down the flanks.
Information Contacts: Alaska Volcano Observatory (AVO), a cooperative program of a) U.S. Geological Survey, 4200 University Drive, Anchorage, AK 99508-4667 USA (URL: https://avo.alaska.edu/), b) Geophysical Institute, University of Alaska, PO Box 757320, Fairbanks, AK 99775-7320, USA, and c) Alaska Division of Geological & Geophysical Surveys, 794 University Ave., Suite 200, Fairbanks, AK 99709, USA (URL: http://dggs.alaska.gov/); MIROVA (Middle InfraRed Observation of Volcanic Activity), a collaborative project between the Universities of Turin and Florence (Italy) supported by the Centre for Volcanic Risk of the Italian Civil Protection Department (URL: http://www.mirovaweb.it/); Sentinel Hub Playground (URL: https://www.sentinel-hub.com/explore/sentinel-playground); NASA Worldview (URL: https://worldview.earthdata.nasa.gov/).